Max Trades

3.2K posts

Max Trades banner
Max Trades

Max Trades

@_ctm_crypto

Crypto Trader since 2020 | Daily $BTC Analysis and Trade Ideas | NFA DYOR | Trader at: @ctmtradingac 👀

Katılım Şubat 2025
21 Takip Edilen4.9K Takipçiler
Sabitlenmiş Tweet
Max Trades
Max Trades@_ctm_crypto·
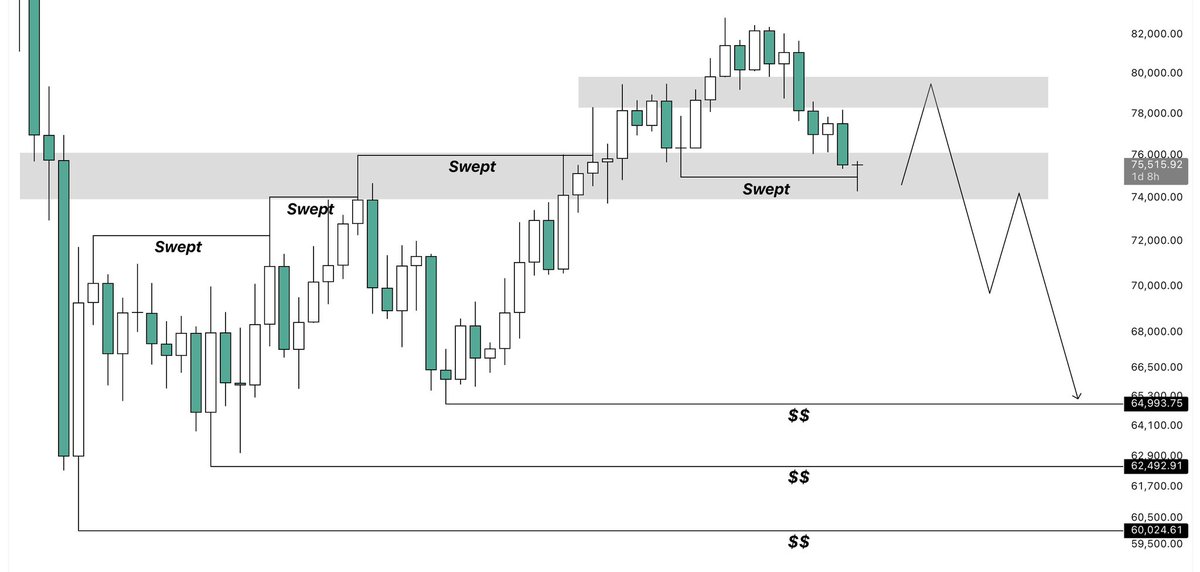
$BTC hasn’t bottomed yet and the current price action clearly doesn’t reflect a typical market low. When markets form a bottom, we usually see aggressive sell-side pressure, repeated sweeps of the lows, and clear signs of capitulation. That’s not what we’ve seen so far. There are still multiple unswept lows below, and the majority of liquidity remains positioned to the downside. Looking at the HTF picture it also becomes clear that we're still trading within a macro downtrend, with no clear shift in momentum. At the same time, sentiment is already starting to turn bullish again — which typically happens before another move lower, not at the actual bottom. All of this suggests that the market hasn’t gone through the kind of conditions you would expect at a true low. As long as these factors remain in place, I expect price to continue lower and eventually take out the remaining liquidity below. A confirmed shift in structure and a reclaim of key levels would be the first sign that this view is wrong — but until then, the downside remains the more likely path.
Max Trades tweet media
English
6
9
77
22.1K
Max Trades
Max Trades@_ctm_crypto·
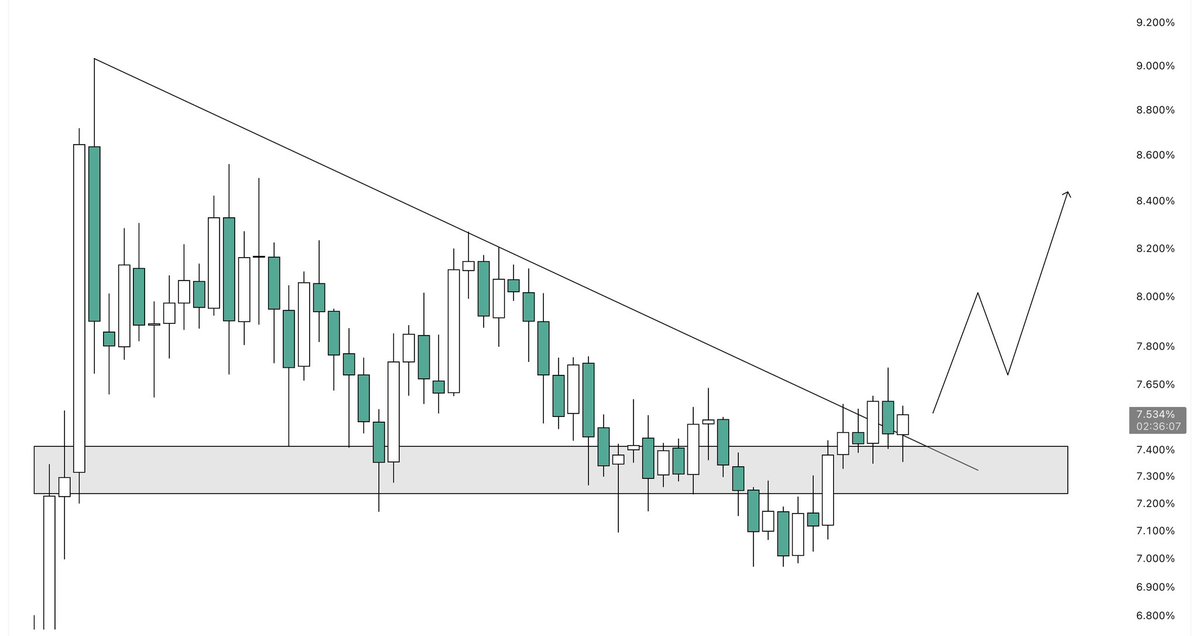
This is actually insane. $USDT dominance just broke out of this multi month bull flag after successfully reclaiming the previous resistance zone and flipping it into support. Historically, rising USDT dominance means capital is flowing out of crypto and back into stablecoins, which is generally bearish for BTC and the broader market. What makes this breakout especially interesting is that it’s happening while BTC has already broken its short term uptrend and started printing lower highs and lower lows. If USDT dominance continues pushing higher from here, it would strongly support the idea that crypto sees another leg lower before a larger bottom is formed.
Max Trades tweet media
English
2
3
18
1.1K
Max Trades
Max Trades@_ctm_crypto·
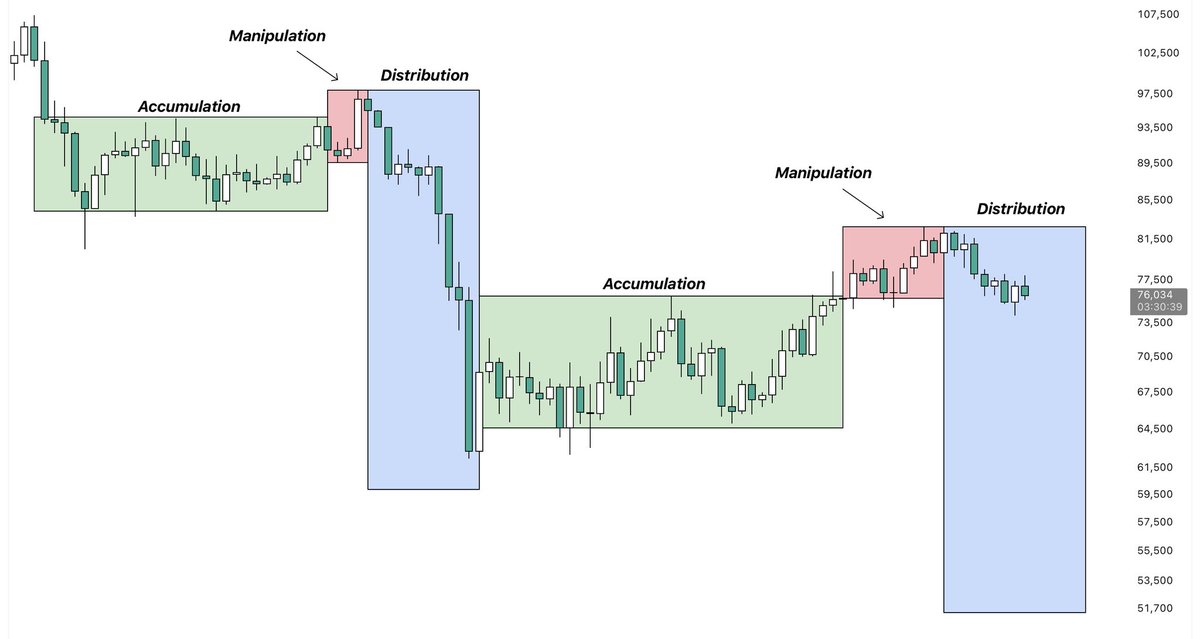
$BTC The same exact pattern from the previous breakdown seems to be playing out once again. Back at the end of last year, BTC spent several months ranging between $84k and $94k, forming what looked like a classic accumulation phase. This was then followed by a breakout above the range highs, which quickly failed and transitioned into the distribution phase, ultimately leading to a sharp correction toward the current local bottom. Now price has once again spent multiple months ranging before breaking above the highs and immediately getting rejected back down. If BTC re-enters the previous range here, it could confirm the end of the manipulation phase and potentially mark the beginning of another distribution phase. The last time this pattern played out, BTC corrected roughly 40% from the local top. If history were to repeat itself once again, it would imply a move toward the $50k-$51k region before a larger bottom formation becomes likely.
Max Trades tweet media
English
5
2
19
1.7K
Max Trades
Max Trades@_ctm_crypto·
$BTC What we just saw was a clean liquidity sweep above the current LTF range. Price pushed aggressively higher right after New York open, taking out the highs before seeing a sharp rejection back toward the monthly open. Now that BTC is already trading close to the range lows again, I believe those become the next likely target from a liquidity perspective. This is typical behavior inside a range environment, where price tends to move from one side of liquidity to the other until a confirmed breakout occurs.
Max Trades tweet media
English
8
13
35
3.5K
Max Trades
Max Trades@_ctm_crypto·
$BTC Coinbase Premium remained deeply negative throughout this entire bounce. This suggests that while perps kept pushing price higher, spot demand remained weak and Coinbase participants were aggressively selling into the move. That’s generally not what you want to see during a relief rally. As long as spot demand fails to return, the risk of another flush to the downside remains elevated.
Max Trades tweet media
English
4
6
31
2.6K
Max Trades
Max Trades@_ctm_crypto·
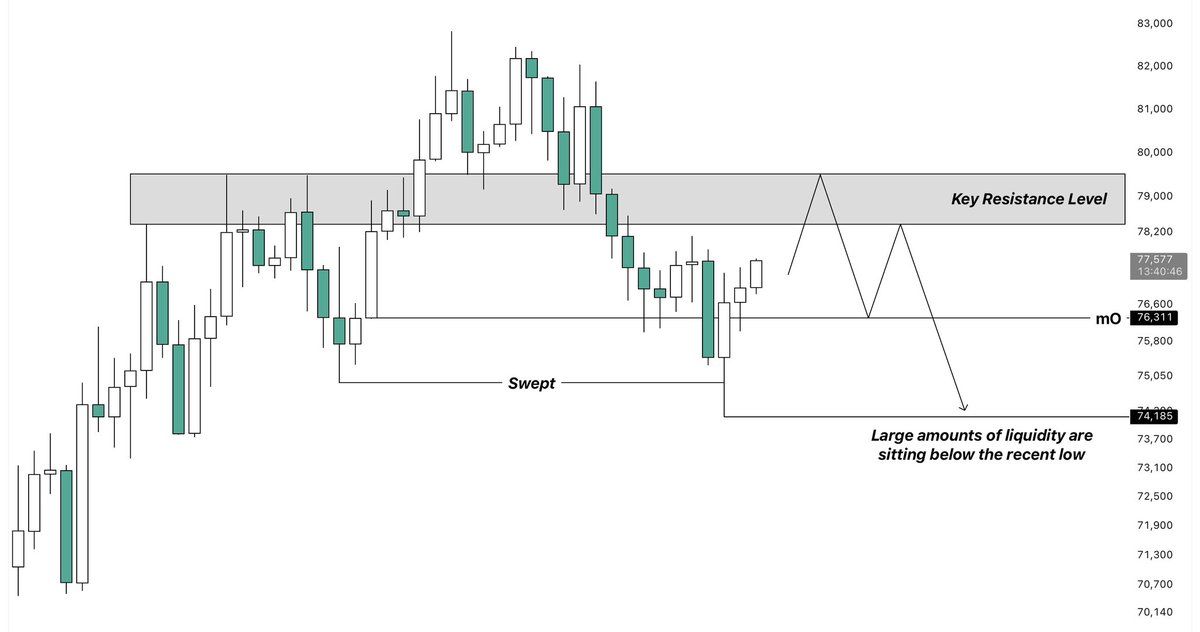
$BTC So far price still hasn’t managed to print a higher high. After closing back below the weekly open, BTC is now once again attempting to reclaim it. This level, together with the monthly open sitting directly below, will be key to hold for buyers. If price manages to maintain acceptance above this area, there’s a decent chance we see another retest of the key resistance level at $79k. Should we, on the other hand, fail to break above the previous high, price will likely continue lower and start hunting the liquidity that has built up below the recent low.
Max Trades tweet media
English
4
3
49
3.2K
Max Trades
Max Trades@_ctm_crypto·
$BTC Price saw a strong bounce from a key HTF support level while funding mostly stayed positive throughout the move. At the same time, open interest has slowly started increasing again after cooling off for a while, showing that leverage is beginning to build back up. Meanwhile, spot demand remains relatively weak for now, suggesting that the current move is still lacking strong spot participation. This creates a rather mixed picture overall. As long as spot demand doesn’t start picking up again, there’s still a decent chance this bounce turns into nothing more than another lower high.
Max Trades tweet media
English
4
2
25
2K
Max Trades
Max Trades@_ctm_crypto·
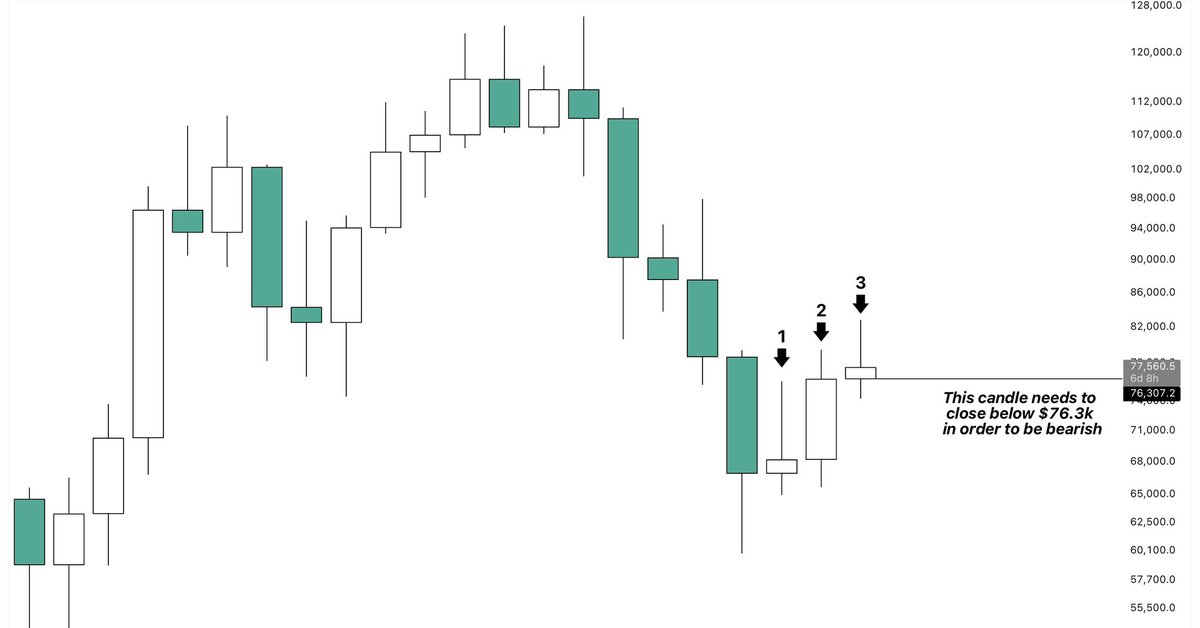
$BTC Monthly close is coming up and so far May is still on track to close green. If BTC manages to close above $76.3k, this would mark three consecutive green monthly candles in a row. What makes this interesting is that this is something that has never happened during a bear market before. While this doesn’t automatically mean that the bear market is over, it definitely shows that current price action is behaving differently from what we’ve historically seen during prolonged bear markets. With that said, we still have a few days left until the monthly close, so this will definitely be an important level to watch.
Max Trades tweet media
English
13
10
62
5.2K
Max Trades
Max Trades@_ctm_crypto·
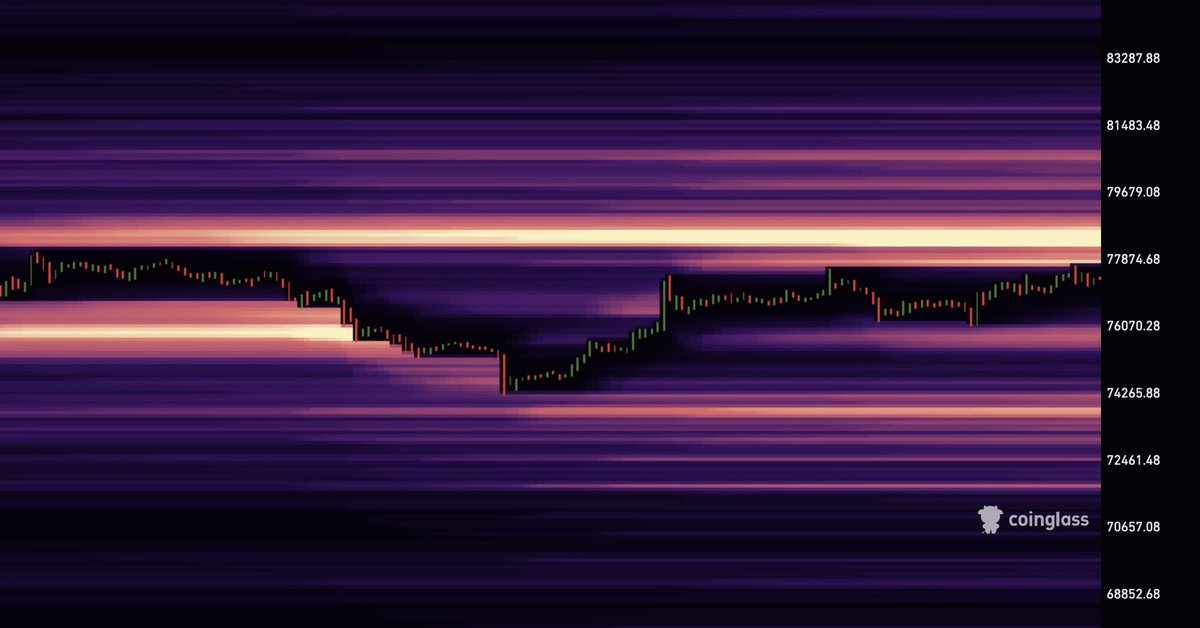
$BTC There is one notable liquidity cluster left directly above price that lines up perfectly with the key resistance area BTC is currently approaching. I believe it’s only a matter of time before this level gets tested, as such a move would make sense both from a liquidity and a structural perspective. A move into the $78k-$79k region would complete the bearish retest scenario while at the same time sweeping a large amount of short liquidity sitting above price. My plan for now is to wait for price to tap that level and see what the reaction looks like before determining the ongoing bias.
Max Trades tweet media
English
3
3
23
2.6K
Veo Xue
Veo Xue@vocean813·
@_ctm_crypto Good two-way setup. Wait for rejection or reclaim, then trade the confirmation instead of the bias.
English
1
0
0
104
Max Trades
Max Trades@_ctm_crypto·
$BTC Price swept the low at $74.9k, followed by a strong bounce and reclaim of the monthly open. This was exactly the move I anticipated and shared in a few of my previous posts. Now we are approaching the key resistance area at $78k-$79k. This zone could act as a level for a bearish retest before we see a continuation lower. If price, on the other hand, manages to reclaim this region and push back above $80k, there’s a decent chance we’ll see a sweep of $82.8k, as a large amount of liquidity has built up above the recent highs. However, the grey zone will be the key area to watch for now. If we see a rejection from this level followed by a close back below resistance, I’ll look to take a short position targeting the monthly open as well as the previous low. In case of a break above, I’ll wait for a sweep of the highs and a potential move into my previous area of interest around $84k, where also the unfilled CME gap from a few months ago sits.
Max Trades tweet media
English
4
12
37
3.1K
Bogico
Bogico@CyrilBogico·
@_ctm_crypto Interesting week ahead, and the monthly candle close is very important.
English
1
0
2
85
Max Trades
Max Trades@_ctm_crypto·
$BTC A lot of low leverage long liquidations got wiped out on this move down. This leaves only one decent cluster below, which will get swept if price takes out the previous low at $74.2k. Above price we now have one notable cluster sitting around the $80k mark and another one right above the local top. While a retest of $80k is still possible from a liquidity perspective, the current market structure favors another sweep lower. So unless BTC prints a higher high and invalidates the bearish structure, I’m expecting the liquidity below to get taken out sometime around next week.
Max Trades tweet media
English
3
7
21
3.4K
FRDM
FRDM@FRDMCrypto·
Sweeping 74.9k definitely flushed out the late longs, but this retest of the old range high is the real line in the sand. If buyers don't step up here, we’re dropping straight back into that messy chop to hunt the bottom liquidity. Definitely sitting on my hands until the reclaim is confirmed or we get the full breakdown.
English
1
0
0
278
Max Trades
Max Trades@_ctm_crypto·
$BTC This is the pullback I’ve been talking about all along. Price has now swept the low at $74.9k and is currently retesting the highs of the previous range. This is the key area buyers need to defend if they want to keep the current relief rally intact and push price higher once again. If this level holds, I believe there’s a decent chance we see a bounce back toward the $79k-$80k region. This is where the next key resistance area sits and where the formation of a lower high would make the most sense structurally. Should we lose this level on the other hand, it would mean re-entering the previous range. In that scenario, price would likely enter a much more choppy environment driven primarily by liquidity hunts on both sides. The broader focus would then shift back toward the unswept lows sitting at the bottom of the range. These remain the main target from a liquidity perspective and I still expect them to eventually get taken out.
Max Trades tweet media
English
13
13
62
6.3K
Max Trades
Max Trades@_ctm_crypto·
$BTC This is actually insane. After over a month of mostly upside price action, BTC has now started to reverse, clearing large amounts of liquidity that had built up below. Now for the first time in two months, long liquidations outweigh short liquidations by 2:1. The largest cluster currently sits around the $79k-$80k region, which also lines up with the recent breakdown level. From a liquidity perspective, a move back into that area would make a lot of sense.
Max Trades tweet media
English
5
5
30
3.1K
Max Trades
Max Trades@_ctm_crypto·
$BTC According to the Bitcoin Rainbow Chart, BTC is currently trading inside the Fire Sale zone. Historically, this has been one of the most attractive long term accumulation areas and has often appeared around major bear market bottoms. Of course, this doesn’t mean price has to bottom immediately or that downside is no longer possible. But from a long term valuation perspective, Bitcoin is already trading in a zone that has rarely lasted for long in previous cycles. This is exactly why I believe the best strategy from here is not trying to perfectly time the bottom, but slowly accumulating while the market is still pricing BTC this cheaply.
Max Trades tweet media
English
1
1
13
1.4K
Max Trades
Max Trades@_ctm_crypto·
@MaksimXBT Positive funding means longs are paying shorts, so positioning is generally more long-biased. But I agree that funding alone isn’t enough to determine market direction. That’s why I also included open interest, spot volume and price structure in the analysis.
English
0
0
3
142
Maksim
Maksim@MaksimXBT·
@_ctm_crypto funding rates being positive doesn't necessarily mean traders are bullish, it can also mean they're shorting
English
1
0
0
199
Max Trades
Max Trades@_ctm_crypto·
$BTC Price continues holding above the monthly open while open interest keeps cooling off. At the same time, funding rates remain positive, showing that traders are still leaning bullish despite momentum slowing down overall. The decline in open interest suggests that leverage is getting flushed out of the market, which generally creates a healthier structure for price. However, the sharp decrease in spot volume also shows that conviction behind the current bounce remains relatively weak for now. As long as BTC holds above the monthly open while open interest continues cooling off, another push higher remains possible.
Max Trades tweet media
English
7
5
38
3.5K