ACLLC
7.1K posts


ACLLC
@acllc2
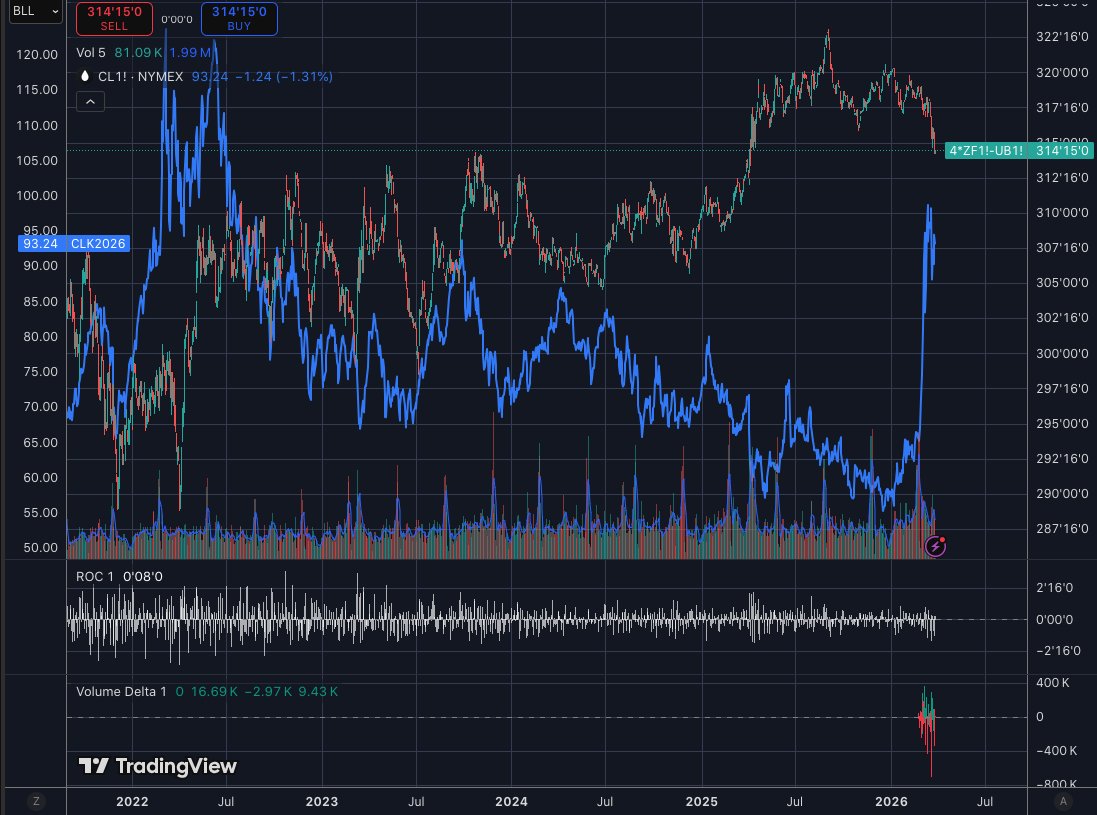
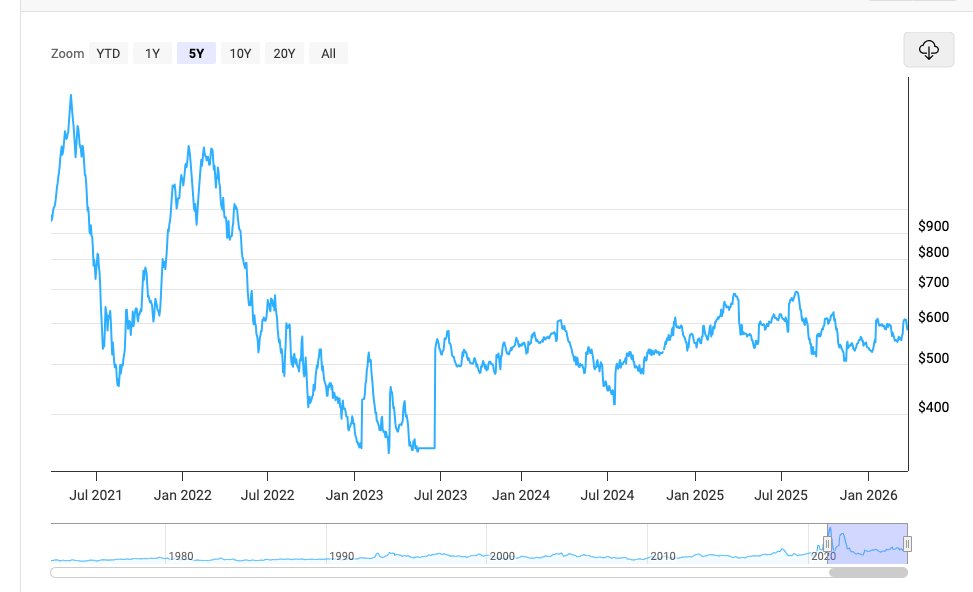
US Treasury Futures Curve, Fixed Income, Yield Curve “You lose it here and you’re in a world of hurt”
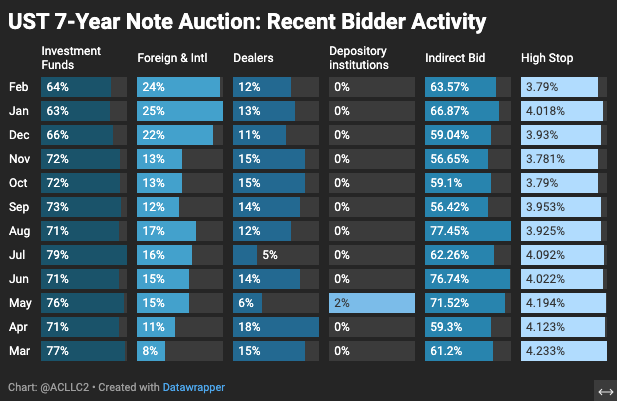
$44B UST 7-Year Note Auction 1pm ET Last 6 Averages: Bid-to-Cover 2.46 Indirect Bidders 60.3% (Feb: 2.50 & 63.6%)
$44B UST 7-Year Note Auction 1pm ET Last 6 Averages: Bid-to-Cover 2.46 Indirect Bidders 60.3% (Feb: 2.50 & 63.6%)


Record Setting US Treasury Auctions On Deck: 2yr $69B, 5yr $70B 7yr $44B (not a record...) A look-back at Auction Sizes, Bidder Activity, and a flash-crash. (A thread 1/6)
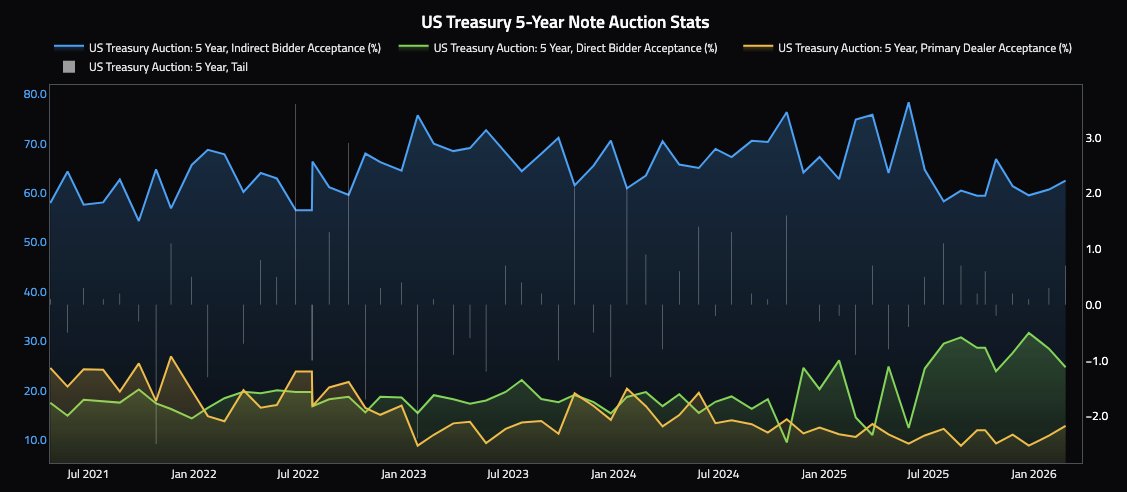
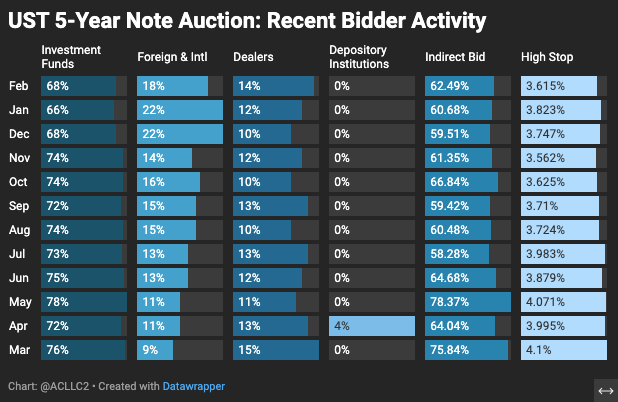
$70B UST 5-Year Note Auction 1pm ET Last 6 Averages: Bid-to-Cover 2.36 Indirect Bidders 61.7% (Feb: 2.32 & 62.5%)
We have forgotten how bad 2022 crisis was. Commodity: price today (peak in 2022) Brent: $99 ($139) EU steel: $710 ($1,435) EU wheat: €200 (€438) US corn: $4.5 ($8.2) EU gas TTF: €51 (€339) Henry Hub gas: $2.9 ($9.7) German power: €95 (€984) Urea: $660 ($910)
Its a catastrophe 😉


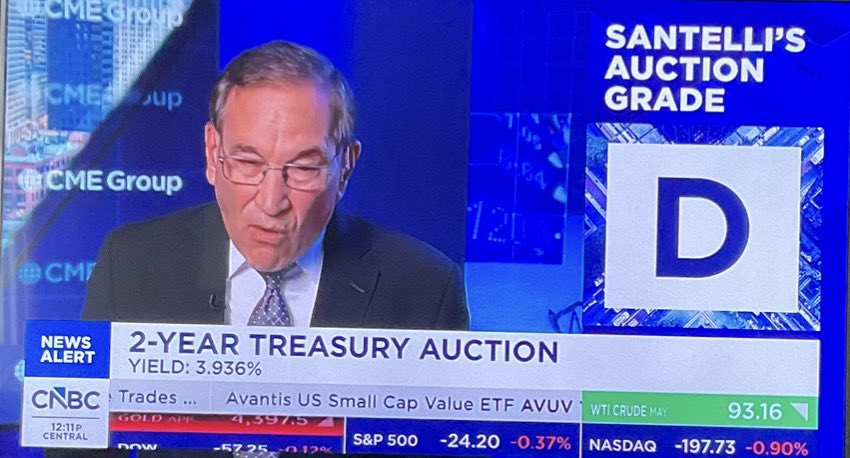
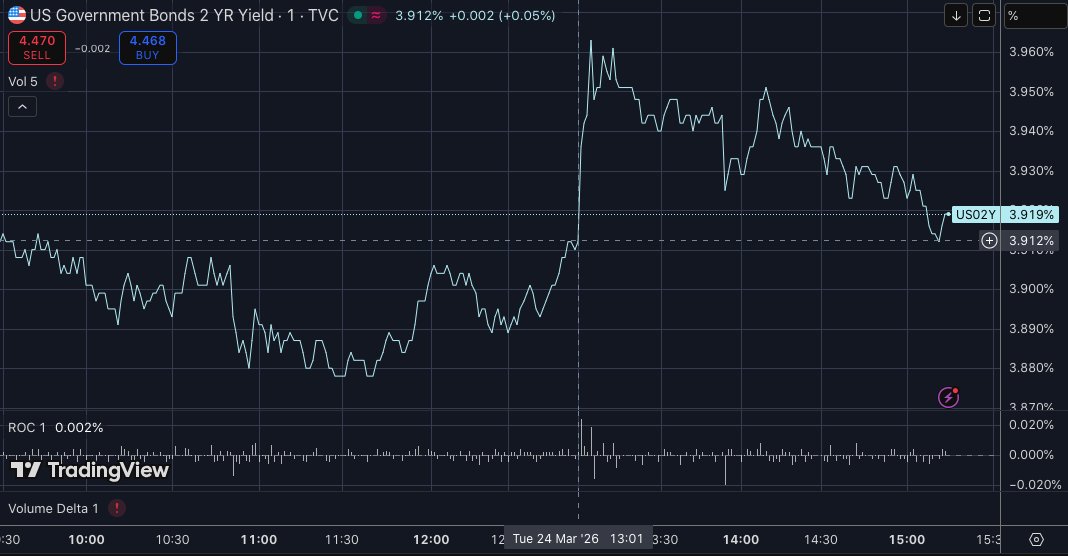
$69B UST 2-Year Note Auction 1pm ET Last 6 Averages: Bid-to-Cover 2.62 Indirect Bidders 57.2% (Feb: 2.63 & 55.9%)