Sabitlenmiş Tweet

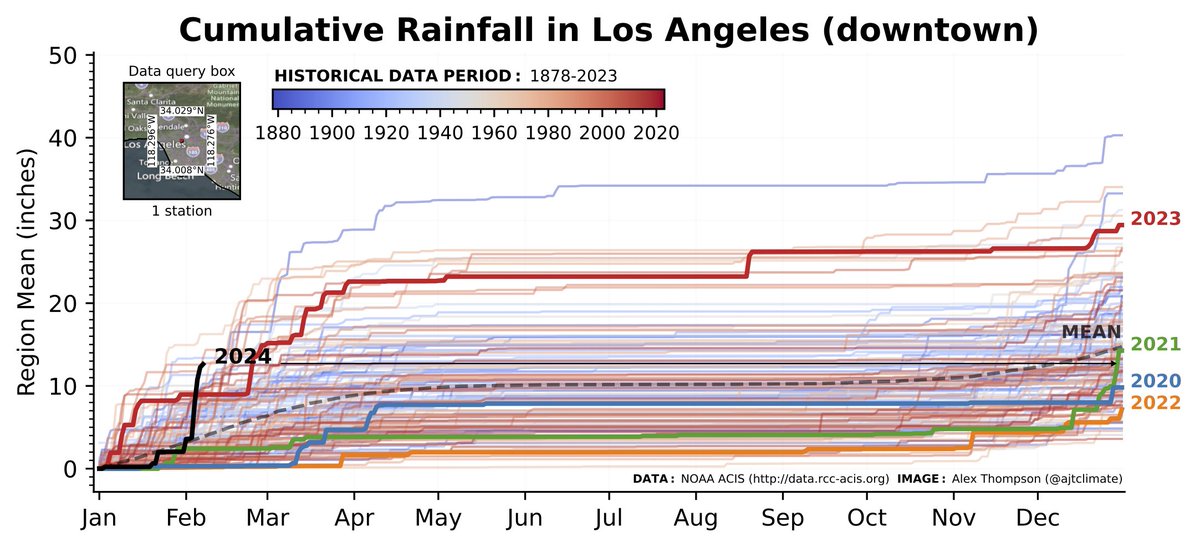
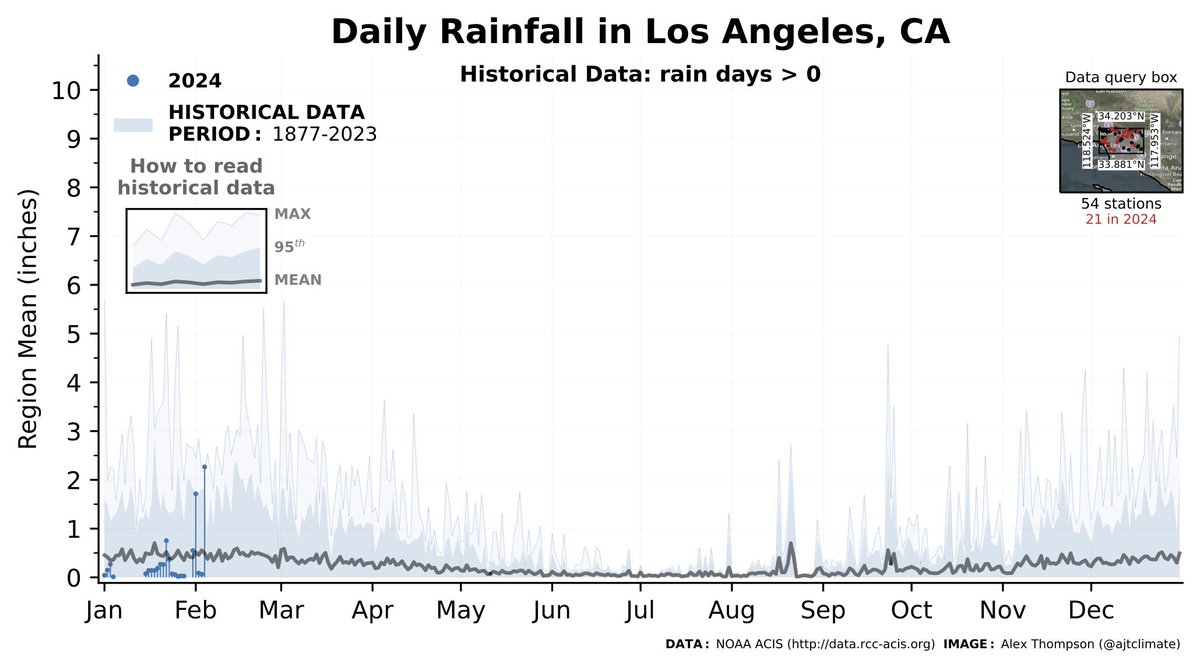
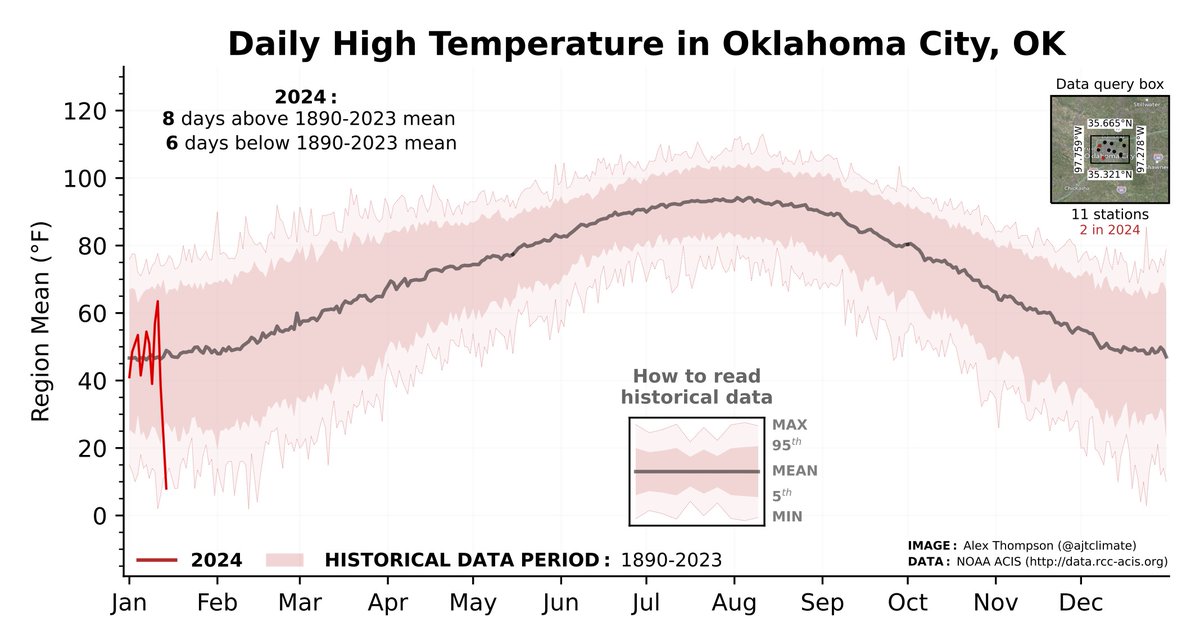
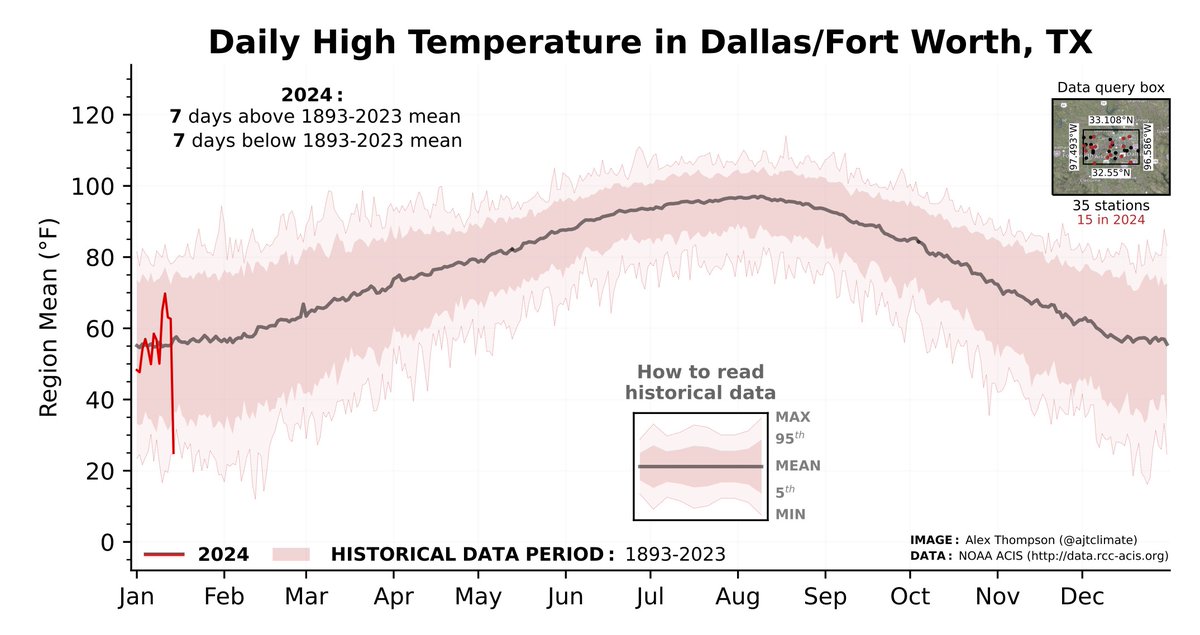
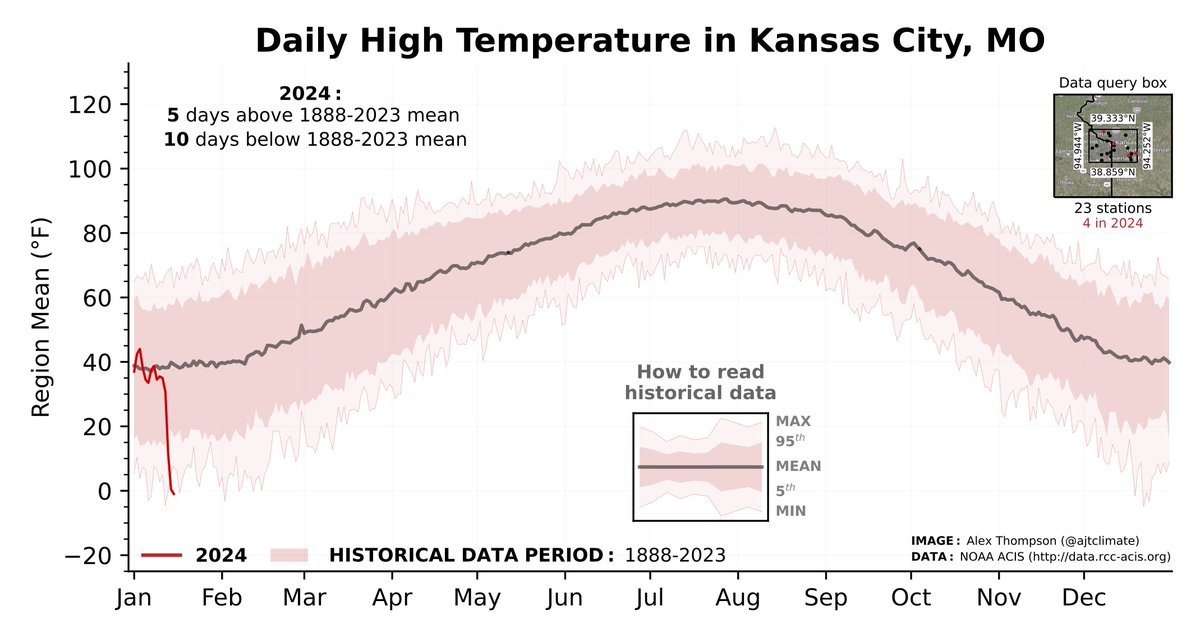
Although I am attending #AGU virtually this year with a newborn at home, I wanted to share a #climatedataviz web tool I have been working on over the past several months called Climate Data Visualizer. Give it a try at climate-data-viz.com! A quick 🧵(1/6)
English