

Abdul Kadir
6 posts

@Arjun111980 @iManasArora @NIKHILGARGCAP I think brother you should watch his YouTube videos dont just blindly follow his max sl is always 2.5% or the day loss even he has mentioned there
English

@ak_6716 @iManasArora @NIKHILGARGCAP Bhai sab hamam mai nange hai . He was little bit different . Ask him what was his SL ? If it would have blasted toh aata bolta 50 R, 60 R
English

#NewPosition - LONG in #EIEL at 224.41
stop LOD
Target: t.ly/_XCrz
Disc: Not a buy recommendation. Do NOT copy and lose your capital because you are very likely to.


English
@iManasArora @NIKHILGARGCAP How as it was mentioned low of the day?
English
@AnkurPatel59 Absolutely! I took trades in EIEL and Wabag based on this exact pattern. Your earlier tweet on Exicom helped me recognize the setup. Thank you for sharing these valuable observations—they’ve helped me improve my technical analysis and decision-making.
English
One pattern keeps showing up again and again. Earlier we saw it in Data Patterns. Then it happened in Apollo &Balaji Amines. And now the same thing is visible in stocks like Water theme and a few others.
The stock first tries to break out, but the move fails because there is not enough follow through buying. Instead of continuing higher, it slips below the 20 EMA for a day or two. At first glance, it looks like the setup has failed.
But then comes the recovery.
The stock quickly climbs back above the 20 EMA, regains its strength, and after spending another two or three days tightening up, it often presents another entry opportunity.
Whether that second entry works or not is a different question. If the market supports it, the stock can resume its uptrend. If not, it usually goes back into a period of consolidation and spends more time building a fresh base.
.The important part is recognising the pattern.
This behaviour has become quite common in the current market. Many stocks attempted breakouts a week or two ago, but the broader market was not supportive. There simply wasn't enough follow through buying, so those breakouts failed and the stocks pulled back.
Now, as the market improves, many of those same stocks are bouncing sharply from around the 20 EMA.
That is why, in the current environment, I find buying near the 20 EMA more attractive than chasing fresh base breakouts. The risk is usually smaller, and you are buying closer to support rather than after the stock has already moved away from it.


Ankur Patel@AnkurPatel59
I really like this kind of price action. A strong momentum stock slips below the 20 EMA for a day or two, quickly recovers, and starts moving higher again. If you read between the lines, it often shows that buyers are still in control. Right now, two stocks that caught my attention are Apollo and Balaji Amines. Both were on my watchlist earlier, and I like the way they have recovered after briefly moving below the 20 EMA. It feels like they could offer a good tradable move over the next few weeks. We have seen similar recoveries earlier in Data Patterns and Paras Defence. I'm not saying these stocks will repeat that kind of move, but this is definitely a pattern worth keeping an eye on. It's just a small observation. If you've come across any other stocks showing a similar quick recovery after slipping below the 20 EMA, let me know in the comments.
English
@iManasArora Sir, could you please explain the technical analysis behind these trade? What did you see in these stock that gave you the conviction to take a position?
English

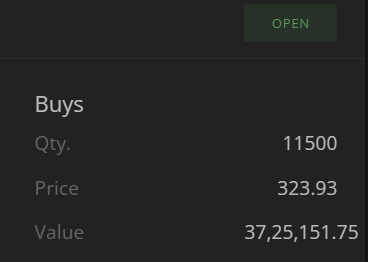
#NewPosition - LONG in #GENUSPOWER at 323.93
stop 2%
Target: t.ly/_XCrz
Disc: Not a buy recommendation. Do NOT copy and lose your capital because you are very likely to.

English