ali

1.5K posts

ali

ali

@ali_01_01_

Katılım Şubat 2023
2.7K Takip Edilen149 Takipçiler
ali retweetledi
Resource Alpha
Resource Alpha@SpeculatorPL1·
Wall Street is finally catching up. 
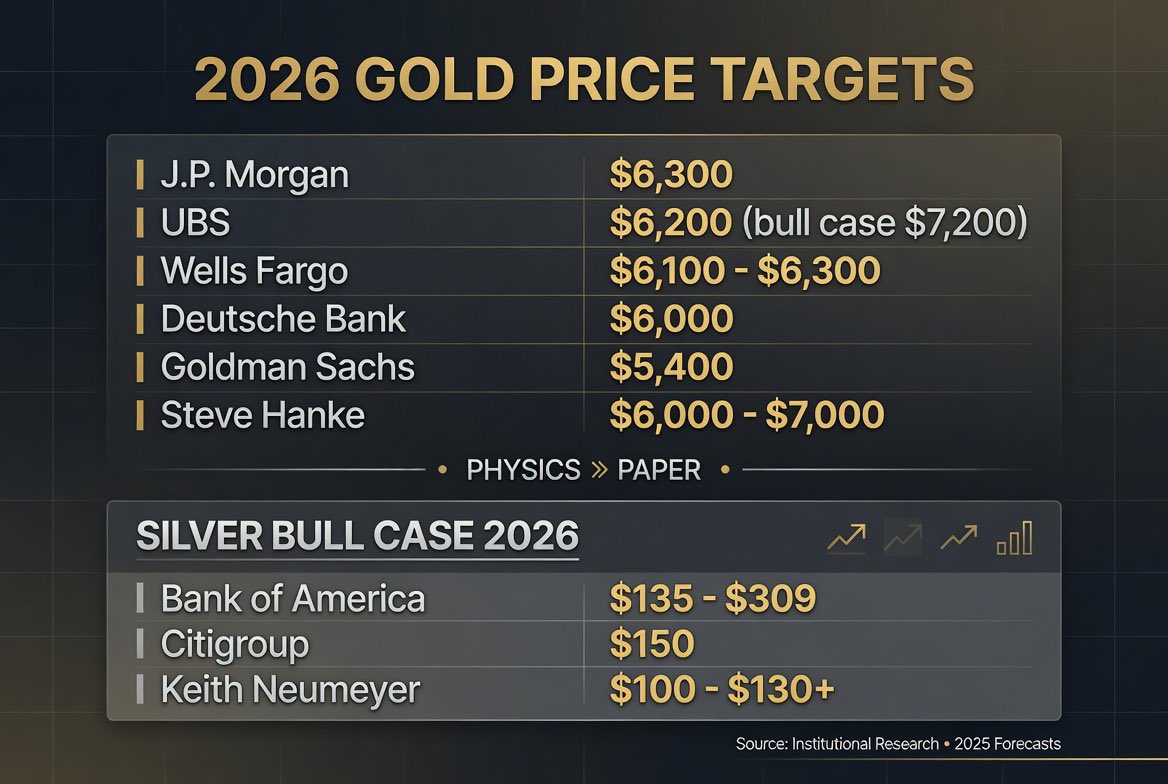
Here are the latest 2026 gold & silver price targets: **Gold:** - J.P. Morgan: $6,300 - UBS: $6,200 (bull case $7,200) - Wells Fargo: $6,100 – $6,300 - Deutsche Bank: $6,000 - Goldman Sachs: $5,400 - Steve Hanke: $6,000 – $7,000 **Silver Bull Case:** - Bank of America: $135 – $309 - Citigroup: $150 - Keith Neumeyer: $100 – $130+ This isn’t about expensive commodities. This is about collapsing fiat currencies. Physics > Paper. 🔥 #Gold #Silver #Commodities #Macro #Inflation #HardAssets #PreciousMetals
Resource Alpha tweet media
English
27
284
851
81.2K
ali retweetledi
LBroad
LBroad@BroadLuis·
The market is confused. I am not. There is a moment in every commodity cycle when the noise reaches its peak right before the real move begins. That moment is now. Gold is trading above $4,500. The XAU has moved well above its 2020 highs. And yet consensus is still doubting, still asking for confirmation, still waiting for the perfect correction to enter. That correction will not come the way they expect. It never does. What the charts are saying: Gold has spent three years building one of the cleanest bullish channels in its modern history. Every pullback has been absorbed by the Kumo. Every breakout attempt has been contained. The Price Momentum Oscillator remains positive. The structure since 2022 is a textbook impulse, with waves ① and ② already confirmed and price now developing the central extension. Fibonacci targets point to areas that look like science fiction today and could become newspaper headlines twelve months from now. But gold is not the most interesting story. The GOLD/XAU ratio is. The ratio nobody watches, and the one that says everything: For decades, when gold rises faster than its miners, that ratio rises. When miners take leadership, the ratio falls. It is the ultimate thermometer of capital rotation inside the sector. That ratio has just completed a failed Elliott wave 5. It could not break above the wave 3 high from 2008. In technical terms, that is exhaustion of the ratio’s bullish impulse. What comes next is sustained compression, and compression in the ratio means only one thing: Miners are going to outperform the metal. The critical support is 11.20. If it breaks, we enter one of the strongest historical periods of miner outperformance versus gold. This is not an opinion. It is what has happened every time this structure has completed in the past. The XAU has already broken above its 2020 highs. That matters. There is a widespread narrative saying miners have gone nowhere. That is false. The XAU is at 362. Its 2020 highs have been widely exceeded. What happened is that gold exceeded its own highs even more, creating the illusion that miners were left behind. They were not left behind. The metal simply ran faster. And that is about to change. But there is something the index does not tell you: Internal breadth across the sector is still very narrow. In my system, which tracks more than 1,300 mining stocks across 10 asset families, only 1.1% of gold miners are currently in LEADER or STRONG regime. In uranium, 3.9%. In copper, 1.2%. That is not a sign of structural weakness. It is a sign that the rotation is still in its early stages. The indexes are rising because a handful of names with flawless structure are pulling the group higher. The rest of the universe is still building its base. When that breadth expands, and it will expand, the move will stop being selective and become a sector trend. And when that happens, those positioned in the right names will have captured the most asymmetric part of the trade. The thesis in one sentence: Gold has already done its job. Now it is the miners’ turn. The capital that entered the metal as a safe haven will start looking for operating leverage. And that leverage lives in the companies that produce, develop, and explore the gold, silver, copper, and uranium the world needs. Not every name will participate. The market is never that generous. But the names with structure, confirmed regime, and real momentum are going to offer some of the most important returns of this decade over the next twelve to twenty-four months. I already have the map. And I am following it. Trends build wealth. Judgment protects it. #Gold #GoldMiners #MiningStocks #Commodities #MinerAlphaLab
LBroad tweet media
English
8
23
136
10.2K
ali retweetledi
عبادي
عبادي@abadi_1988_·
شرح متكامل لأداة تصحيح الفيبوناتشي واستخدامها في الدخول والخروج مع الاستراتيجية بطرق احترافية اتمنى فهمها وتطبيقها بالشكل الصحيح راح يفيدكم باذن الله … بالتوفيق للجميع 🤲🤍 #السوق_الأمريكي #السوق_الامريكي_بالعربي #ناسداك #تداول #سهم youtu.be/UUTy7HZidPM?si…
YouTube video
YouTube
العربية
1
19
119
10.2K
ali retweetledi
josh
josh@XennialTrader·
The symmetry on this chart is astounding. Since the covid lows, the S&P has done this: +2626 handle rally -1327 handle (50%) retracement +2655 handle rally -1312 handle (50%) retracement +2600 handle rally, so far... What's compelling is the exactness of it all. The two rallies only differ by about 1%, and the retracements differ by less than 1%. A rally of 2626 to 2655 handles from the Apr '25 tariff lows yields an upside target range of 7461 to 7490. Adding the 2626 handles from from the covid low to the high of that rally (4818) yields a target of 7445, also in that neighborhood. Previous highs took about 10-16 weeks to form, with marginal new highs being made over that period, and then a 50% pullback. If this symmetry continued to play out, a goldilocks scenario would be: 1. Two-way balanced market with rotation through July, topping out between ~7450 and ~7520 2. Selloff over the summer into the midterm elections in November 3. Bottoming over the end of 2026 into early 2027 4. The *real* AI rally through 2027 into the 2028 election. Think something like: 10k S&P / 50k Nasdaq by end of 2028. "Whoa, hold your horses there..." I know, this is not actionable and I'm not known for posts like this which lay out such long term scenarios. However, it is interesting enough that I wanted to share. We will have a good idea soon enough of whether this market can repeat this pattern for the third time. #ES_F #NQ_F $SPY $QQQ $DIA #YM_F $SPX $NDX
josh tweet media
English
16
39
328
34.8K
ali retweetledi
راكان | #السوق_الأمريكي
أسهم وصندوق قطاع الذاكرات $DRAM يقفزون قبل الإفتتاح اليوم.. الحي يحييك! محلل Goldman Sachs رفع توقعات أسعار الذاكرة بشكل جنوني: - DRAM متوقع ترتفع أسعارها بين +250% إلى +280% في 2026 - NAND متوقع ترتفع أسعارها بين +200% إلى +250% في 2026 - فجوة العرض والطلب في DRAM متوقعة 4.9% في 2026 (الأسوأ منذ 15 سنة) ميتا $META و $MSFT أكدوا أزمة نقص الذاكرات خلال نتائج الأسبوع الماضي Microsoft $MSFT و Google $GOOGL و Amazon $AMZN وقّعوا عقود 5 سنوات مع دفعات مقدّمة 10-30% نتائج وتوجيهات شركات القطاع كانت فوق التوقعات بكثير (x.com/bindollarsign/…) وصندوق القطاع ارتفع بأكثر من 40% خلال الشهر الماضي 🔥😮‍💨 $MU $SNDK $DRAM #أبيان_تداول
راكان | #السوق_الأمريكي tweet media
راكان | #السوق_الأمريكي@BinDollarSign

للمهتمين بقطاع الذاكرات بالأمس تم إطلاق صندوق $DRAM ، فيه حصص في أكبر شركات القطاع $MU تشكل 24.63% من الصندوق Samsung 24.11% SK Hynix 23.08% $SNDK 4.9% Kioxia 4.86% $WDC 4.77% Nanya 3.89% Winbond 2.4% الصندوق متاح الآن للتداول بكل سهولة عبر تطبيق #أبيان_تداول @AbyanTrading

العربية
0
3
30
11.1K
ali retweetledi
Kacper Piotr Kaminski
Kacper Piotr Kaminski@Kacper_PK_CH·
Industrial Metals Not everyone trades futures, so I thought I'd list ETCs that exist out there. WisdomTree Copper → $COPA (LSE) WisdomTree Aluminium → $ALUM (LSE) WisdomTree Nickel → $NICK (LSE) WisdomTree Zinc → $ZINC (LSE) WisdomTree Tin → $TINM (LSE) WisdomTree Lead → $LEED (LSE) Thematic / Energy Transition Metals WisdomTree Industrial Metals → $AIGI (LSE) (copper, aluminum, nickel, zinc, lead) WisdomTree Energy Transition Metals → $WENT (LSE) (copper, aluminum, nickel, silver, tin, zinc, lead, platinum, cobalt) WisdomTree Battery Metals → $WATT (LSE) (copper, aluminum, nickel, zinc, lead, cobalt, lithium)
English
9
25
131
7.1K
ali retweetledi
CryptoNews
CryptoNews@CryptoNews2008·
🚨 جدول الأسبوع المقبل جنوني بالنسبة للأسواق. 🔴الاثنين ← الاحتياطي الفيدرالي يطبع 5.058 مليار دولار. 🔴الثلاثاء ← قرار بنك اليابان بشأن أسعار الفائدة. 🔴الأربعاء ← قرار الاحتياطي الفيدرالي بشأن أسعار الفائدة. 🔴الخميس ← الميزانية العمومية للاحتياطي الفيدرالي. 🔴الجمعة ← تقرير الناتج المحلي الإجمالي الأمريكي. استعدوا للأسبوع الأكثر تقلباً في عام 2026!!
CryptoNews tweet mediaCryptoNews tweet media
العربية
5
35
363
65.2K
ali retweetledi
KaizenInvestor
KaizenInvestor@Kaizen_Investor·
I have written a full article on the AI chip supply chain. The supply chain is structured into 4 different phases with 13 layers: 1. Raw Materials: $SHECY, $SUOPY, GlobalWafers, $WAF.DE, $SHWDF, $AXTI, $IQE 2. Manufacturing Equipment: $ASML, $ASM.AS, $AMAT, $LRCX, $KLAC 3. EDA & Core Intellectual Property: $SNPS, $CDNS, $ARM, $RMBS 4. Chip Design: $NVDA, $AMD, $INTC, $QCOM 5. Foundries: $TSM, Samsung Semiconductor, $SMIC 6. Memory and HBM: SK Hynix, Samsung Electronics, $MU 7. Packaging and OSAT: ASE Technology, $AMKR, JCET Group 8. Server and Rack Integration: $SMCI, $DELL, $HPE, Foxconn 9. Networking Silicon: $AVGO, $MRVL, $CSCO, $ANET 10. Photonics and Optical Components: Ayar Labs, $ALAB, $CRDO, $COHR, $LITE 11. Power, Thermal management and Grid: $VRT, $MOD, $NVT, $SU.PA, $IREN, $CIFR 12. Hyperscalers: $AMZN, $GOOGL, $MSFT, $META 13. AI Storage, platforms and Data: VAST data, Weka, NetAPP, $PLTR, Blue Yonder, $KXSCF The article covers it all.
KaizenInvestor tweet media
KaizenInvestor@Kaizen_Investor

x.com/i/article/2029…

English
40
206
1.1K
264.5K
ali retweetledi
حسن العيدروس
حسن العيدروس@haidroos·
في وداع انفيلد لحاكمه..
العربية
33
335
2.1K
44.8K
ali retweetledi
د. سلطان بن جريس
قبل أن يتحرك السوق، تكون الحكاية قد بدأت في مكان آخر؛ في رقم تضخم صغير، أو تقرير وظائف هادئ، أو عائد سندات صاعد، أو كلمة عابرة من الفيدرالي.🏦🇺🇸 هذا المقال يأخذ القارئ إلى تلك اللحظة المبكرة، قبل الضجيج، ليفهم كيف تتكوّن حركة السوق من خلف الستار، وكيف تتحول المؤشرات الاقتصادية من أرقام جافة إلى لغة كاملة يقرأ بها الاقتصاد. قراءة ممتعة 💙
العربية
1
3
32
18.9K
ali retweetledi
Javier Crespo
Javier Crespo@JavierCrespoDM·
EL FIN DE UNA ERA: POR QUÉ ESTAMOS ANTE EL TECHO DE CICLO MÁS PELIGROSO DESDE 2007 📉🏛️ ​No os dejéis engañar por el ruido de las velas verdes de hoy. Lo que estamos viviendo en el Nasdaq no es fuerza, es la construcción de un techo de mercado que recordaremos durante décadas. Estamos en el vértice de un "Expanded Flat" (Plana Expandida) de grado mayor, y el desenlace será una tendencia bajista que muchos no han visto en su vida. ​Aquí tenéis la tesis completa de por qué estamos ante el final de este ciclo: ​1️⃣ La Anatomía del Engaño: El Expanded Flat ​Este patrón de Elliott es el arma de destrucción masiva de las "manos fuertes". ​Onda B (LA TRAMPA ACTUAL): El precio supera el máximo anterior con violencia. ¿Su objetivo? Liquidar a los bajistas y forzar al último inversor retail a entrar por FOMO. Es una subida "hueca", puramente técnica, diseñada para generar liquidez de salida. Las instituciones están vendiendo mientras el retail compra "máximos". ​2️⃣ El Fractal de la Liquidez (M2) y el Fantasma de 1999 ​El ratio S&P 500 / Masa Monetaria (M2) está gritando peligro. Estamos replicando milimétricamente la burbuja Dotcom. El mercado se ha inflado muy por encima de los dólares reales que circulan. Cuando este ratio toca el techo de Fibonacci 1.0, el sistema se queda sin gasolina. No queda dinero nuevo para sostener estos múltiplos. ​3️⃣ Sentimiento Extremo: Familias "All-in" ​Este es el dato que más me preocupa: la exposición de los hogares a la bolsa está en el 47.1%, superando los niveles del año 2000. La historia es clara: cuando hasta el último ciudadano está invertido, ya no queda nadie por comprar. El mercado siempre cae cuando el sentimiento es de complacencia absoluta. ​4️⃣ La Curva de Tipos y la Recesión Inminente ​Llevamos meses con la curva de tipos invertida, avisando de lo que viene. Históricamente, el mercado no colapsa cuando la curva se invierte, sino cuando empieza a desinvertirse, que es justo donde estamos ahora. Es el "beso de la muerte" macroeconómico que precedió a 2001 y 2008. ​5️⃣ Gaps de Agotamiento y el Dólar (DXY) ​La subida vertical ha dejado Gaps (huecos) que actúan como imanes. El mercado odia el vacío y volverá a cerrarlos con una violencia que asustará. Mientras tanto, el Dólar (DXY) ha despertado en el nivel 0.382 de Fibonacci. Un dólar fuerte en este contexto es veneno para el riesgo. ​📜 Conclusión Final ​Estamos ante una estructura de Techo de Ciclo donde la narrativa de "esta vez es diferente" ha cegado a la mayoría. Pero los datos no tienen sentimientos: ​Precios en máximos con volumen decreciente. ​Liquidez real (M2) agotada. ​El Dólar y la Dominancia de USDT girándose al alza. ​Mi consejo: No operéis el color de la vela, operad la estructura. Cuando la Onda C se active, la caída será mucho más rápida que la subida. Estamos repartiendo las últimas bolsas antes de que la música pare. La paciencia no es solo una virtud, es supervivencia. ♟️🌊 ​#Nasdaq #Trading #Inversión #Macro #ElliottWave #Finanzas #Recesión #MarketTop #1999Fractal
Javier Crespo tweet media
Español
24
58
277
32.7K
ali retweetledi
Roy Mattox
Roy Mattox@RoyLMattox·
This is literally the most extreme momentum event in 40 years of recorded data. The Nasdaq 100's RSI went from 28 (oversold) on March 30 to 70.5 (overbought) by April 15 — in just 11 sessions. That is the fastest oversold-to-overbought transition in the Nasdaq 100's 40-year recorded history. The previous fastest was 25 sessions after Liberation Day last year. The historical average is 60+ sessions. Benzinga According to Bespoke Investment Group, this also marks the fastest move from a correction of this size to a new record high since 1928. Yahoo Finance The forward return data is actually quite bullish long-term. Across all 44 historical episodes where the Nasdaq gained 11% or more in 10 sessions, the 12-month forward return averaged +24%, with a median of +30%, and a win rate of 80%. At 6 months, the win rate is 74%. Benzinga But the near-term pullback is almost guaranteed. The average maximum drawdown following these signals was −18.39% — meaning while the 12-month destination is historically higher, the journey involves deep, punishing pullbacks that can severely impact over-leveraged portfolios. Ainvest The key number to watch: Based on the 6 most comparable historical analogues — COVID recovery (−8%), Liberation Day 2025 (−4%), Fed pivot 2018 (−6%), Asian crisis 1997 (−7%) — the most probable near-term pullback is 3-8% within the next 2-4 weeks. The April 22 ceasefire expiry is the most likely trigger. After that consolidation, the historical data overwhelmingly favors a resumption of the bull trend. The S&P 500 has experienced average intra-year declines of roughly 14% since 1990, even in years that finish strongly positive — and the average correction (10-20% decline) lasts just 17 days. U.S. Bank A pullback here isn't a disaster; it's the historical norm and historically the best re-entry point. Wes and I are extremely well positioned in the leaders.
English
64
333
2.4K
362.8K
ali retweetledi
رواد الاستثمار
رواد الاستثمار@RuwadAlstithmar·
📊💡 الصناديق الأمريكية المتوافقة مع الشريعة (ETF) .. ((نبذه عن الصناديق))👇 1️⃣ SPUS: أسهم أمريكية كبرى 🇺🇸 2️⃣ HLAL: أسهم أمريكية كبيرة ومتوسطة 🏛️ 3️⃣ SPRE: عقارات مدرّة دخل 🏢 4️⃣ SPSK: صكوك إسلامية 💰 5️⃣ GLDM: ذهب مادي للتحوط ضد التضخم 🪙 6️⃣ UMMA: أسواق عالمية متقدمة وناشئة 🌎 7️⃣ SPWO: أسهم خارج أمريكا 🌐 8️⃣ SPTE: تكنولوجيا عالمية 💻 9️⃣ WSHR: شركات مستقرة وجودة عالية ✅ ((ليست توصية شراء أو بيع)) #أسهم #تاسي #سوق_الاسهم_السعودي #تداول #السوق_الامريكي #داو_جونز
رواد الاستثمار tweet media
العربية
2
9
211
13.3K
ali retweetledi
Alphatica
Alphatica@alphaticaio·
SPY UPDATE | Friday April 17 | 2:00 PM | OpEx Day $710.22. Up 1.22%. Thirteen straight green days. New 30-day high. The longest winning streak of 2026. Our Composite Score: +27.7 [Lean Bullish] Before we get into the numbers — a word for our readers. This has been an extraordinary run. We tracked the mechanics from $656 to $710 — every magnet, every dealer short, every put that bled into the tape. The structure called every level. But tonight the engine changes. Read this update carefully. It's the most important one we've published. What's happening right now: Dealers are short 215.5M shares. Read that number again. A week ago it was 44M. It quadrupled. This is the largest forced-buying position in our data's history and it cuts both ways. When dealers are short 215M and price rises, they buy. When dealers are short 215M and price falls, they sell. The same mechanic that drove 13 straight green days accelerates in reverse on a red one. $710 magnet at +$577M is pinning price. Net GEX at +$2.0B — a record that will never be repeated because it expires in two hours. Today's flow: +89.7M shares long, +$1.13B into calls (67% call-heavy), $3.27B total premium traded. OpEx volume is massive. 87% of call volume is new positioning — people are building into next week, not closing. IV skew hit +2.77%. Widest of the entire cycle. On the highest day. At the most bullish composite. Puts have never been more expensive relative to calls. Someone is paying up for protection at the top. Pay attention to that. What changes at 4 PM: 4.25M contracts expire. 21.6% of total OI disappears. $1.1B of GEX rolls off. The gamma blanket that suppressed every dip for two weeks gets pulled off tonight. Monday opens with a structurally different market. Here's what that means specifically: The magnets thin out. The dense $700-$710 zone that pinned price all week loses most of its near-term gamma. The remaining magnets are May and June dated — still present but weaker. Dealer short delta partially resets. The 215M won't stay at 215M once the 0DTE and weekly contracts expire. It drops. How much depends on what rolls and what expires. But the forced-buying engine shrinks. Vanna flipped. We flagged this this morning. Dealer effective vanna is now -55K. That means if IV drops, dealers SELL. For the last two weeks, vol compression helped the rally. Next week, vol compression is neutral to negative for price. The tailwind became a headwind. Charm pressure is the highest of the cycle at +428K. Time decay is forcing dealer selling, not buying. This was masked by the overwhelming put unwind. With that fuel gone, charm becomes more visible. The risks for next week: 1. The ceasefire expires Tuesday April 21. This is the event. If no deal, vol reprices. If vol reprices from 16% toward 25%, vanna reversal means dealers sell aggressively. The same reflexive loop that drove the rally fires in reverse. 2. The gamma cushion is gone. GEX flip is at $673 — 5.3% below. That sounds far. But without the dense near-term gamma, price moves faster. A 2-3% gap down on a headline puts us in a different structural regime overnight. 3. The dealer short at 215M is a loaded spring. It amplified every up day. It will amplify the first real down day just as hard. The 13-day streak didn't have a single session to release pressure. When it comes, the snap could be sharp even if brief. 4. IV skew at +2.77% is telling you the smart money is already hedged for this. The people driving the rally bought protection at the top. Follow their lead, not their direction. What we're NOT saying: We're not calling a top. The composite is bullish. The magnets above $710 still exist. If the ceasefire extends, this runs to $720-$725. The structure supports higher. But the character of the market changes tonight. The mechanical tailwind that made this rally feel inevitable expires at 4 PM. What's left is a lighter gamma profile, a ceasefire clock at 4 days, and the largest dealer short delta in history that works in both directions. The bottom line: Enjoy the 13-day streak. It was mechanical, it was trackable, and it was real. But the fuel source expires tonight. Next week is a different market. Stay hedged. Stay small into Tuesday. Let the ceasefire resolve before building conviction in either direction. $710 is the pin into close. $720 is the target if the ceasefire extends. $673 is the floor if it doesn't. April 21 decides everything. $SPY $QQQ $VIX
Alphatica tweet media
English
23
28
234
33.7K
ali retweetledi
Thierry from arvy 🇨🇭
Thierry from arvy 🇨🇭@ThierryBorgeat·
Today is the DAY. April 17, 2026. The intermediate top before the most difficult time of the presidential cycle. THE BAD NEWS We're entering the mid-term correction phase. Historically, markets correct an average of 16% during this period. It's the weakest part of the 4-year presidential cycle. And it starts NOW. THE CHART SPX Seasonal Composite 4-Year Presidential Cycle (99 years of data): Election Year → Post-Election Year → Mid-Election Year → Pre-Election Year Red line (current cycle): Peaked April 17, 2026 Black line (historical average): Shows consistent mid-term weakness The pattern is clear. Mid-election years are brutal. THE HISTORICAL PATTERN Out of the last 20 presidential cycles, we've witnessed 19 sharp mid-term corrections. Average decline: 16% Timing: Mid-election year (Year 2 of the cycle) This is where markets reset. THE GOOD NEWS After 19 out of 19 sharp mid-term corrections, we've seen a new bull market. Duration: 2 years Phase: Pre-election year + election year (Year 3 and Year 4) This is the most bullish part of the cycle. THE SETUP We're at the top of Year 2. The correction is coming. But the 2-year bull market follows. THE MESSAGE Buy any dip in the coming months. Not now. Not at the top. But when the market corrects 10%, 15%, 20% — that's your entry. Because history says: Mid-term corrections are buying opportunities for the pre-election rally. THE PLAYBOOK 1. We're at the intermediate top (April 17, 2026) 2. Expect a 16% correction over the next 6-9 months 3. Layer in during weakness (-10%, -15%, -20%) 4. Hold through the pre-election year rally (Year 3) 5. Ride the election year momentum (Year 4) THE PATTERN NEVER FAILS 19 out of 19 times, the mid-term correction was followed by a 2-year bull market. That's 100%. THE LESSON Don't panic during the correction. Don't fight the cycle. Buy the dip. Hold for 2 years. That's the presidential cycle playbook. Today is the DAY. The top is in. The correction starts now. The opportunity is coming.
Thierry from arvy 🇨🇭 tweet media
English
73
149
945
582.5K
ali retweetledi
ترند الذكاء الاصطناعي
Prompt 1: مولّد أفكار صفقات "حلّل سوق اليوم وطلع لي 5 فرص تداول احتمال نجاحها عالي لـ [insert stock/index/sector]. بكل فرصة عطِ سعر الدخول المقترح، أهداف الربح، مستوى وقف الخسارة، ونسبة المخاطرة للعائد المتوقعة. وبرضو اشرح لي ليه هالصفقة مناسبة باستخدام تحليل فني وأساسيات الشركة."
العربية
1
2
37
6.1K
ali retweetledi
طالب
طالب@_TALEBM_·
1. ماسح Goldman Sachs لـ "جوهرة الشركات الصغيرة" المخفية "أنت محلل أبحاث أسهم للشركات الصغيرة (Small-Cap) خبير في Goldman Sachs وتغطي الشركات قبل ما توصل $10B في القيمة السوقية — لأن يوم كبار محللين وول ستريت يبدون يغطون السهم، يكون الربح السهل راح. أبي ألقى أسهم شركات صغيرة عندها قابلية 10-100x قبل لا يكتشفونها المحللين المعروفين. سوّ مسح بناءً على: - فلتر القيمة السوقية: ركّز على شركات بين $100M و $2B — كبيرة كفاية تكون جدّية، وصغيرة كفاية إنها تتضاعف - فلتر نمو الإيرادات: أقل شيء 25% نمو سنوي بالإيرادات لمدة 3+ أرباع سنوية ورا بعض (علامة الشركات اللي تنطلق بقوة) - التغطية التحليلية: شركات يغطيها 0-5 محللين (20+ محلل = خلاص انكشف السهم) - ملكية المطلعين: المؤسسين والتنفيذيين يملكون 15%+ من الأسهم (حاطين جلدهم بالسوق = مصالحهم مع المساهمين) - رياح داعمة للقطاع: هل الشركة بقطاع نموه هيكلي للعشر سنين الجاية (AI، أمن سيبراني، تحول الطاقة، شيخوخة السكان، الأتمتة) - جودة اقتصاديات الوحدة: تحسّن الهوامش الإجمالية ورافعة تشغيلية إيجابية (الإيرادات تزيد أسرع من التكاليف) - صحة الميزانية: كاش يكفيها تعيش 18+ شهر بدون ربحية لو النمو يحتاج استثمار - الميزة التنافسية: وش اللي يخليها محمية — تأثيرات شبكة، براءات، صعوبة التحويل، أو بيانات فريدة - محفزات قريبة: أحداث واضحة خلال 6-12 شهر ممكن تعيد تسعير السهم (أرباح، إطلاق منتجات، قرارات تنظيمية) - فحص الرايات الحمراء: إصدار أسهم يخفّف الملكية، تعاملات أطراف ذات علاقة، ديون عالية، أو تكدّس مخزون طلّعها بتنسيق تقرير فرص Small-Cap على طريقة Goldman Sachs مع 5 أفكار أسهم محددة، وكل وحدة تحقق أكثر من معيار من اللي فوق. تفضيلاتي: [DESCRIBE YOUR RISK TOLERANCE, PREFERRED INDUSTRIES, INVESTMENT HORIZON, AND HOW MUCH RESEARCH TIME YOU CAN DEDICATE PER STOCK]"
العربية
1
7
69
15.6K
ali retweetledi
InvestSky
InvestSky@InvestSky·
الزبدة 5 أرقام تقراها بالترتيب: 1️⃣ Revenue → تبيع أكثر من قبل؟ 2️⃣ Gross Profit → تربح من كل منتج؟ 3️⃣ Operating Income → تشتغل بكفاءة؟ 4️⃣ Net Income → كم تربح فعلاً؟ 5️⃣ EPS → كم نصيبك أنت؟ محمد احتاج 10 دقايق يفهم القائمة. بعدها ما اشترى أي سهم بدون ما يقرأها. والفرق في محفظته بعد 5 سنوات؟ هائل.
العربية
1
2
18
1.1K
ali retweetledi
ian cooper
ian cooper@icooperTrades·
#EDUCATION POST: #Portolio balance and #riskmanagement Good morning all. I am going to set out my overall #investing strategy, #portfolio balance, and risk management as a few people have asked about it. KEY POINTS 1) I have 3 different types of accounts - #Daytrading (holding positions for minutes to hours and closing before the end of the day), #swingtrading (holding for days to weeks and a few months), long term #investments (hold for years). - I personally have different brokers/accounts for each of these so that I can track PnL for each type of trade and so I am NOT tempted to change my balance of low and high risk assets (eg, sell long term investments to chase a risky day trade that is going against me) 2) As rough percentages, I have 10% in my day trade account (day trades do not need a large amount of margin as I do not hold overnight so whilst this is a small percentage of my capital, I can take large positions, particularly on the futures). 50% in swing trade account (this needs the margin to hold for longer periods). 40% in long term investments. 3) Day trades: These are either #futures contracts, ETFs, #Stocks or #crypto. These are the highest risk as I will normally only have 1 position (possibly 2) open at a time so if I am wrong I have no other positions hedging this. Within this account, I would start with a positon that is 1/8 my max size to give flexibility. 4) Swing Trades: These are futures, ETFs, stocks or crypto. These are the medium risk part of my portfolio. Not because any position can't go wrong (they can and do, and I share them openly here), but because I can balance my positions. I will typically have 10-20 positions open and start with 1/8 position size. 5) Long term invetments; Futures, stocks, ETFs crypto. These are the least volatile and least risk part of my portfolio. I will buy these and forget them for a minimum of 12 months but often much longer. These are largely bitcoin, SPY, QQQ, gold, #Mag7 in that order of size. I will trim these positions (or fully sell) at peaks and add at troughs but rarely exit fully. NOTES: - For my long term holds in #bitcoin (I don't hold any other crypto for the long term) I prioritise security over any yield. This could be cold storage or using the larger and more secure custodians. - Most new traders make the mistake of increasing their exposure to their higher risk/higher reward assets when they are doing well and then get wiped out when they have a downturn. By keeping fixed percentages in each section, you can avoid this temptation. - I also have assets managed by other people like a pension. Whilst I could manage and invest this myself, this is an asset (like I just mentioned with Bitcoin) where I am not trying to squeeze every last % point out of. I want this to be slow and steady and having someone else manage it spreads risk.
English
4
4
35
2.3K