Sabitlenmiş Tweet

Gap Up, Gap Down, or In Range — What Happens Next? (12,390 Sessions Analyzed)
Every trading day begins with a single print on the tape — the RTH session open. That first price relative to the previous session’s range sets the tone for everything that follows. But how exactly does opening type — gap up, gap down, or in-range — influence intraday behavior?
We analyzed 12,390 trading days across four major futures contracts to answer these questions:
How often does each open type occur, and is the distribution stable?
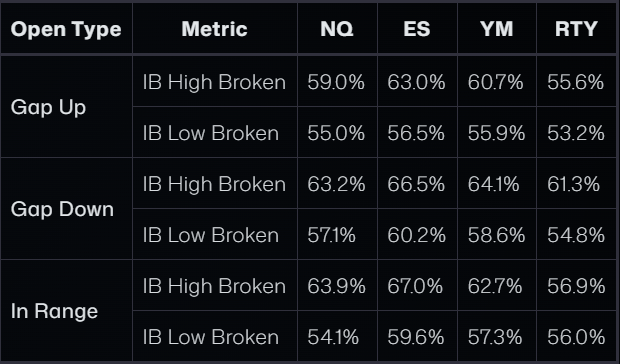
Which previous-session levels are most likely to be touched based on opening type?
Does opening within vs outside the Value Area change the day’s character?
When price touches one Value Area boundary, how often does it reach the VPOC?
How does gap size affect the probability of revisiting the prior range?
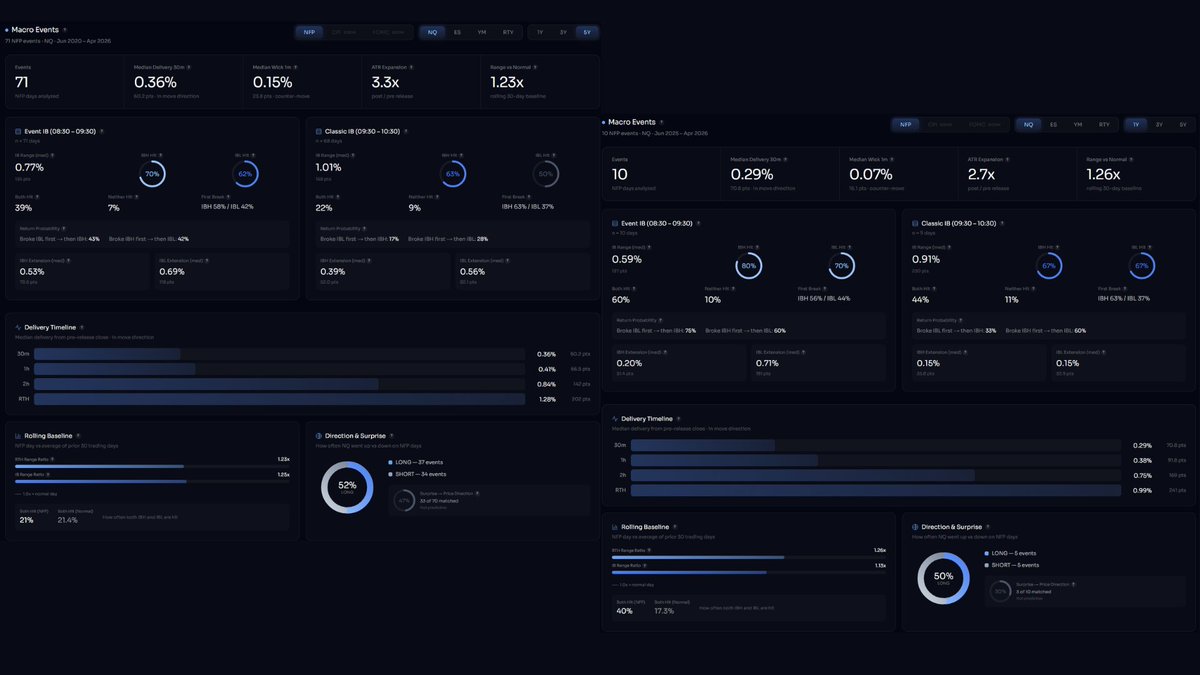
The results reveal that opening type is not merely descriptive — it carries measurable statistical weight. In-range opens show 71-73% probability of touching the previous close, while a touch of the prior VAH or VAL leads to 81–84% probability of also reaching the VPOC.
Data and Methodology
This research covers minute-level RTH (09:30-16:00 ET) data for four CME futures contracts:
#NQ (Nasdaq-100) — 3,116 days
#ES (S&P 500) — 3,042 days
#YM (Dow Jones) — 3,116 days
#RTY (Russell 2000) — 3,116 days
The dataset spans from February 2014 through March 2026 — over 12 years of market history covering multiple regimes including low-volatility bull markets, COVID-era extremes, and the 2022-2023 rate hiking cycle.
Classification Definitions
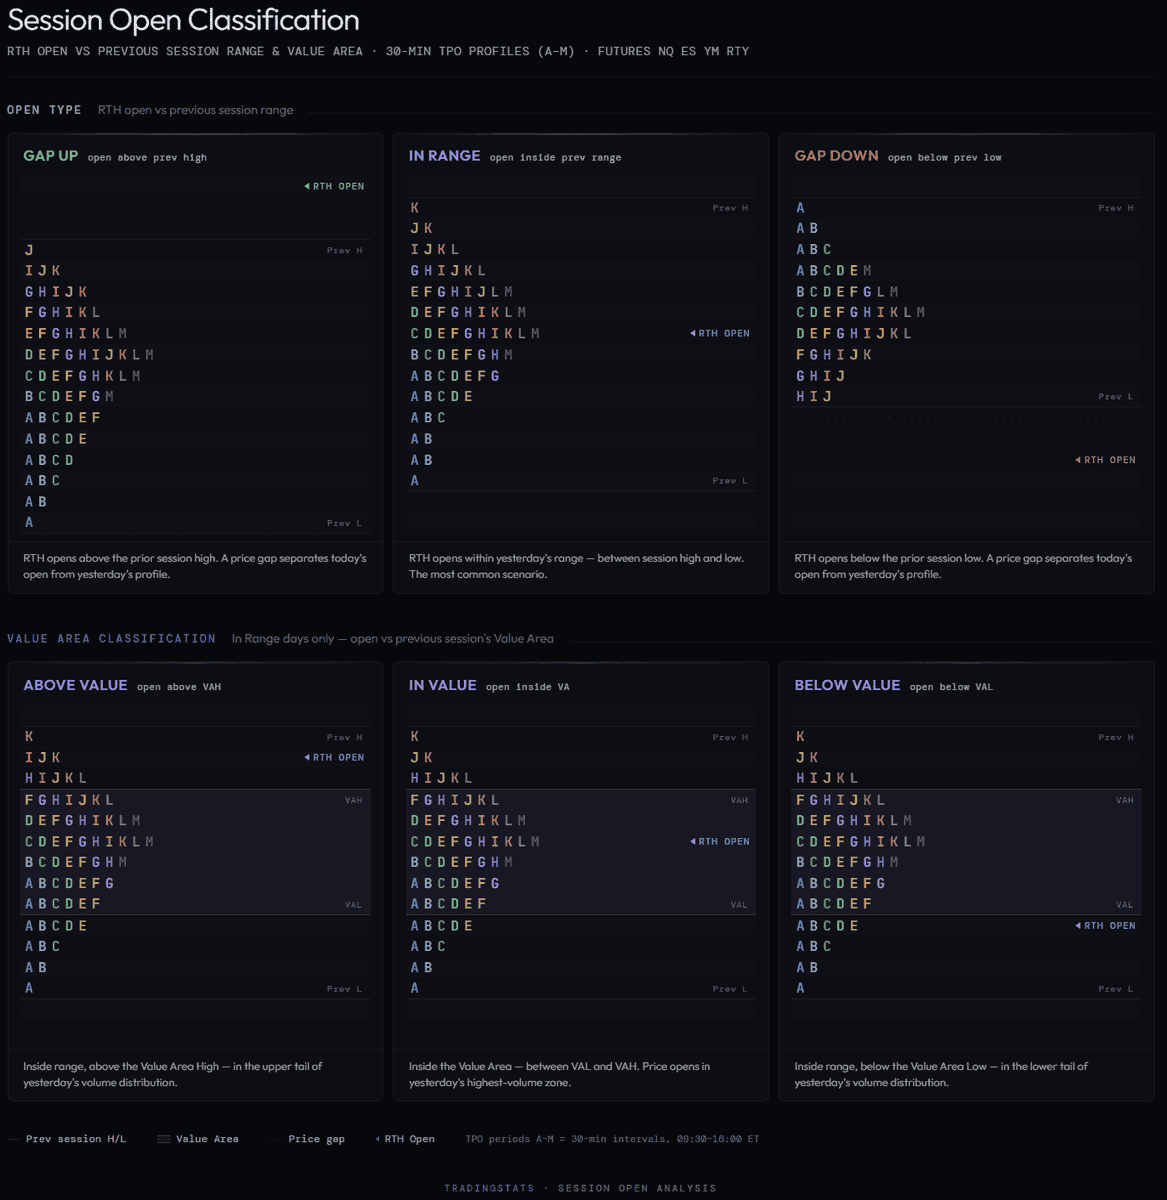
Open Type is determined by comparing the RTH open price to the previous session’s high and low:
Gap Up — RTH open above previous session high
Gap Down — RTH open below previous session low
In Range — RTH open between previous session low and high (inclusive)
Touch means the level fell within the current day’s RTH traded range (session low ≤ level ≤ session high). No specific sequence or timing is required — only that the level was traded through at some point during the session.
Value Area sub-classification applies only to In Range days and uses the previous session’s TPO-derived Value Area High (VAH), Value Area Low (VAL), and Volume Point of Control (VPOC).
English