CuriousInvestor

22K posts

CuriousInvestor banner
CuriousInvestor

CuriousInvestor

@arc1471

Engineer,CFA Level 2 & CMT Level 3 Candidate. CFTe. Learning what is not Taught. Tweets are for educational purpose only. Not a SEBI Registered Adviser

Mumbai, India Katılım Eylül 2016
41 Takip Edilen37.5K Takipçiler
Sabitlenmiş Tweet
CuriousInvestor
CuriousInvestor@arc1471·
🚨 Weekend Study Alert 🚨 Markets never sleep, but here’s your chance to learn at ease! 📚 Drop your investing/stock market queries below 👇 💡 I’ll pick the best ones and answer them this weekend. 👉 Like ❤️ + Retweet 🔁 this post so more curious minds can join in.
English
28
13
52
63.1K
CuriousInvestor
CuriousInvestor@arc1471·
There are three types of trend 1. Uptrend - Series of Higher Highs & Higher Lows 2. Downtrend - Series of Lower Highs & Lower Lows 3. Sideways Trend - Similar Highs & Lows
CuriousInvestor tweet media
English
0
0
5
2.3K
CuriousInvestor
CuriousInvestor@arc1471·
Season 1 of India's Got Latent was chaos. Unscripted, unfiltered, unpredictable. You watched because you had NO idea what would happen next. Season 2 is... fine. Funny, well-produced, safe. And that's the price of surviving a controversy. Once the whole country is watching you, you stop performing — you start managing risk. Samay knows this better than anyone. The cyber cell summons, the FIRs, the apology — that stuff doesn't just fade. It sits in the back of your head every time you're about to say something spicy. Ironic outcome: the thing that made the show blow up (unpredictability) is the exact thing it can't afford anymore. Anyone else feel this watching S2? #SamayRaina
English
1
0
3
2.7K
CuriousInvestor
CuriousInvestor@arc1471·
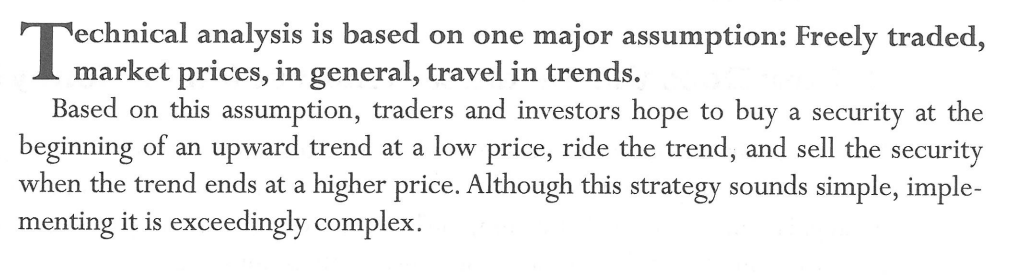
A trend in motion stays in motion until something forces it to change. That's not poetry. That's basically Newton's First Law, borrowed for the market. An object moving in a straight line keeps moving in that line — unless an outside force acts on it. Replace "object" with "stock price" and you've got the entire logic of trend-following. This is why "the trend is your friend" isn't a cliché. It's a mathematical bet: a trend is statistically more likely to continue than to reverse, right up until it shows real signs of breaking down. So the job isn't predicting reversals constantly. The job is riding the trend — and staying alert for the early cracks that say it's ending.
English
0
0
2
2.4K
CuriousInvestor
CuriousInvestor@arc1471·
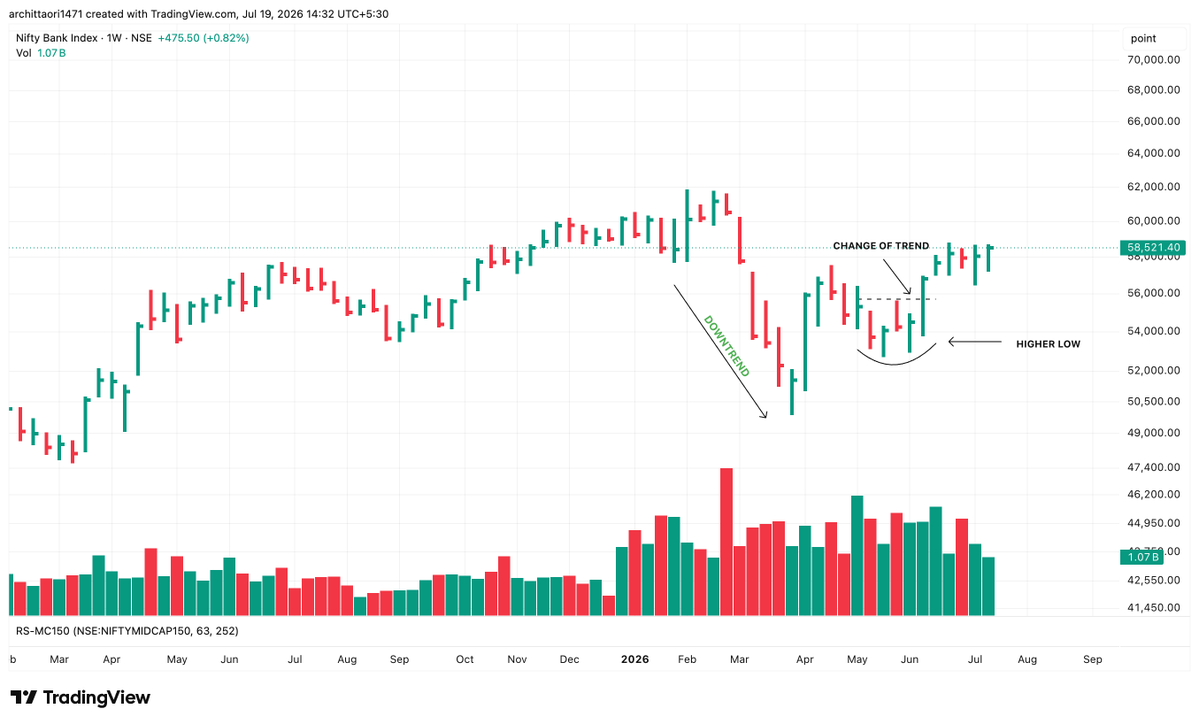
The money isn't made by spotting an uptrend. It's made by spotting the exact moment a downtrend dies and an uptrend is born. That's the highest risk-reward entry that exists on a chart. Too early → you're catching a falling knife. Too late → you're buying after the smart money already made 30-40%. The skill is narrowing that window. Not eliminating it — narrowing it. This is Stage 4 to Stage 2. This is where trend reversal trading actually lives.
CuriousInvestor tweet media
English
0
1
5
3.3K
CuriousInvestor
CuriousInvestor@arc1471·
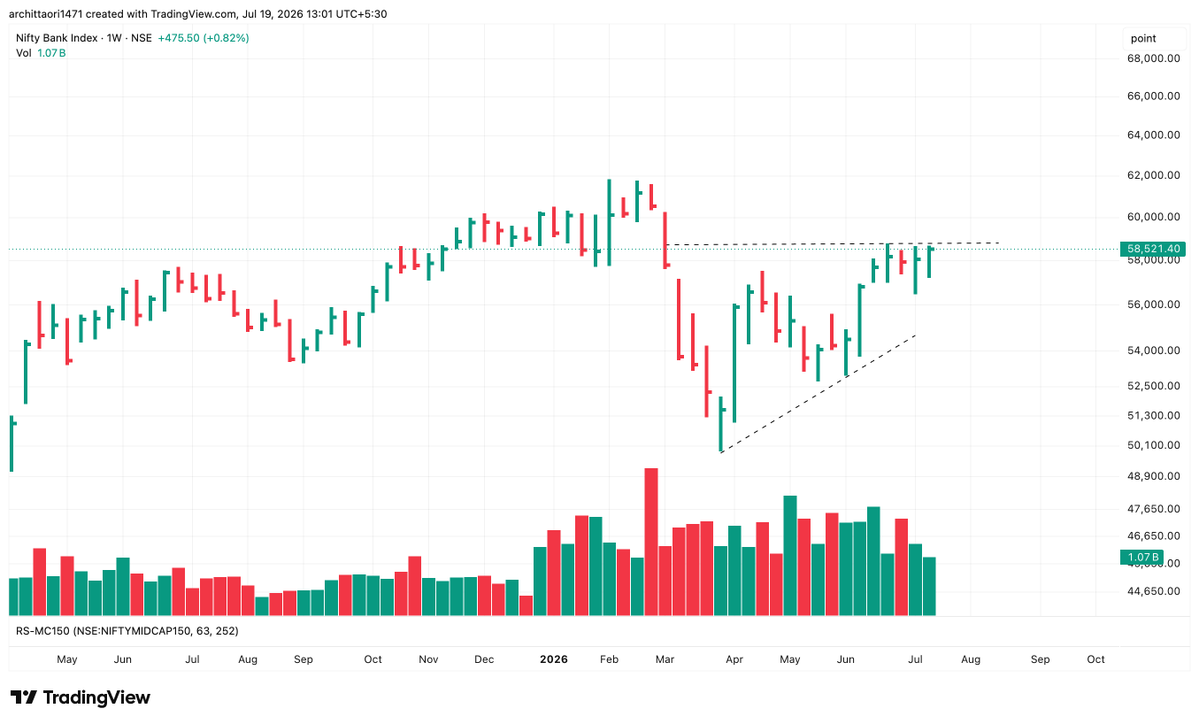
#BANKNIFTY - Above 59000 , it can blast way to 61000 straight Massive Breakout Possible
CuriousInvestor tweet media
English
3
1
39
3.8K
CuriousInvestor
CuriousInvestor@arc1471·
Surcharge confusion costs people real money. Most think it's one flat rate. It's not. 🧵 When does Surcharge actually apply on your Income Tax? Income > ₹50L → 10% Income > ₹1Cr → 15% Income > ₹2Cr → 25% (New Regime — capped here) Income > ₹2Cr (Old Regime, non-capital gains) → up to 37% Below ₹50L → ZERO surcharge. Just cess. The trap: Surcharge applies on your TAX, not your income. And there's Marginal Relief so crossing ₹50L by ₹10,000 doesn't wipe out your gains. Know your slab. Know your surcharge. Research karo. Samjho. Invest karo.
English
0
4
9
3.6K
CuriousInvestor
CuriousInvestor@arc1471·
#TCS +9.7% this week. Best weekly gain in 6 years. #TechMahindra profit +28.4%. But Nifty IT is still down 23% in 2026. Vote below, I'll share my technical view in the replies
English
1
1
3
4.2K
CuriousInvestor retweetledi
RedboxGlobal India
RedboxGlobal India@REDBOXINDIA·
MARUTI SUZUKI ORDERED TO REPLACE CAR IN INDIA’S FIRST E20 FUEL DISPUTE; COMPANY TO APPEAL A consumer commission in Raipur has directed Maruti Suzuki to replace a customer’s Grand Vitara with a new E20-compatible vehicle or refund about ₹20.5 lakh plus related charges. The case is believed to be India’s first consumer court ruling centered on alleged damage caused by E20 (20% ethanol-blended) petrol.
English
19
53
560
79.9K
CuriousInvestor
CuriousInvestor@arc1471·
Tomorrow's Zoom Session Sunday 11 am DM to get zoom link!
CuriousInvestor tweet media
English
2
2
11
3.9K
CuriousInvestor
CuriousInvestor@arc1471·
Banks show wonderful Results in Q1 Hdfcbk Q1 Profit up 5% @ 19060 Cr Icicibk Q1 Profit up 16% @ 14805 Cr Yesbank Q1 Profit up 34% @ 1071 Cr Kotak Bank Q1 Profit up 26% @ 4123 Cr Axisbank Q1 Profit up 23%@ 7114 Cr Pnb Q1 Profit up 300% @ 5253 Cr ⭐🌈
Indonesia
2
6
59
6.7K
Gagan
Gagan@Singhlicious·
@arc1471 Isse yaad aaya, Bhai thank you for suggesting NSE unlisted shares in 2023
English
2
0
5
2.7K
CuriousInvestor
CuriousInvestor@arc1471·
SBI bought NSE shares at 80 paise. Today it's cashing out at ~₹2,055. 1993-1999: SBI acquires ~8 crore NSE shares. Average cost: ₹0.80/share. Total investment: ~₹6.4 crore. 2026: NSE files for IPO. Unlisted price: ~₹2,055/share. SBI is selling 2.475 crore shares in the OFS — shares that cost them roughly ₹2 crore to acquire — for an estimated ₹5,000+ crore. That's a partial exit. It still holds the rest. On the shares being sold: a ~2,568x return. Annualized over 33 years: ~27% CAGR. And SBI still owns the remaining ~5.5 crore shares — worth another ₹11,000+ crore at current prices, untouched. Your FD gives you 7%. This is what patient, concentrated conviction looks like.
English
5
7
175
30.1K
CuriousInvestor
CuriousInvestor@arc1471·
#NIFTY - Higher Lows ! Nifty just have to cross above 24600 now ! Keep a watch
CuriousInvestor tweet media
English
3
6
70
5.7K
CuriousInvestor
CuriousInvestor@arc1471·
@Swiing_Sense Never claimed institutions decide on one indicator. RS is a filter, not a decision engine - it tells you where relative strength is showing up, not why. What you do after that (fundamentals, flows, management quality) is the actual work.
English
0
0
0
157
Jay Singh
Jay Singh@Swiing_Sense·
@arc1471 Wrong, they are not stupid to pour crores by just seeing an indicator. Have you ever seen or worked in a prop desk or a fund?
English
1
0
0
88
CuriousInvestor
CuriousInvestor@arc1471·
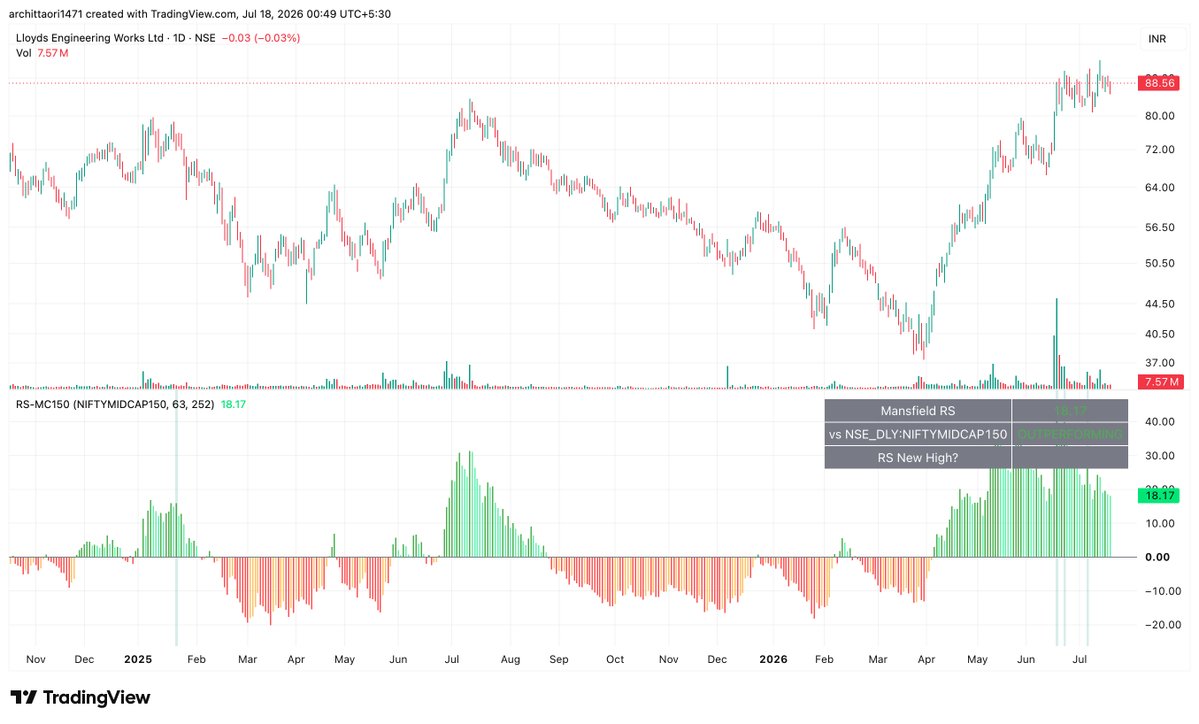
Most traders check a stock's price. Smart money checks its Relative Strength. The Problem: A stock can go up 10% and still be a laggard — if the broader market/index went up 20% in the same period. Price alone doesn't tell you if a stock is a leader or a laggard. Most retail traders never check this. They just look at the chart in isolation. The Solution: I built a Pine Script indicator that measures a stock's strength relative to the Nifty Midcap 150 - not just its raw price. 🟢 Green = stock is OUTPERFORMING the index 🔴 Red = stock is UNDERPERFORMING the index 📈 New RS highs = institutional-grade leadership signal (this is what shows up BEFORE big breakouts - Minervini/O'Neil's core principle) This is how you filter "going up" from "actually leading the market." Free script. Drop a 🔥 if you want the code, I'll share it.
CuriousInvestor tweet media
English
10
4
34
5.6K
CuriousInvestor
CuriousInvestor@arc1471·
Copy & Paste this code in Pine Editor & Apply to Your Trading View Charts! //@version=5 indicator("RS vs Nifty Midcap 150 | Curious Investor", shorttitle="RS-MC150", overlay=false) // ============ INPUTS ============ benchmarkSym = input.symbol("NSE:NIFTYMIDCAP150", "Benchmark Index", tooltip="Change this if you want to compare vs a different index (e.g. NSE:NIFTY, NSE:NIFTYSMLCAP250)") rsBasePeriod = input.int(63, "RS Base Period (bars)", minval=5, tooltip="63 = roughly 1 quarter on Daily chart. This is the Mansfield RS smoothing period.") newHighLookback = input.int(252, "New High Lookback (bars)", minval=20, tooltip="252 = roughly 1 year on Daily chart") showRawRS = input.bool(false, "Show Raw RS Ratio Line (secondary, own scale)") // ============ CALCULATIONS ============ benchClose = request.security(benchmarkSym, timeframe.period, close, lookahead=barmerge.lookahead_off) rsRatio = close / benchClose * 100 rsSMA = ta.sma(rsRatio, rsBasePeriod) mansfieldRS = (rsRatio / rsSMA - 1) * 100 rsHighestInWindow = ta.highest(rsRatio, newHighLookback) rsAtNewHigh = rsRatio >= rsHighestInWindow rsRising = mansfieldRS > mansfieldRS[1] // ============ PLOTTING ============ plotColor = mansfieldRS >= 0 ? (rsRising ? color.new(color.green, 0) : color.new(color.lime, 40)) : (rsRising ? color.new(color.orange, 40) : color.new(color.red, 0)) plot(mansfieldRS, title="Mansfield RS", style=plot.style_columns, color=plotColor) hline(0, "Zero Line (Equal to Index)", color=color.gray, linestyle=hline.style_solid) plot(showRawRS ? rsRatio : na, title="Raw RS Ratio (own scale, ignore vs zero line)", color=color.new(color.blue, 30), linewidth=1, display=display.pane) bgcolor(rsAtNewHigh ? color.new(color.teal, 85) : na, title="New RS High Highlight") // ============ INFO TABLE ============ var table infoTable = table.new(position.top_right, 2, 3, border_width=1) if barstate.islast table.cell(infoTable, 0, 0, "Mansfield RS", text_color=color.white, bgcolor=color.gray) table.cell(infoTable, 1, 0, str.tostring(math.round(mansfieldRS, 2)), text_color=mansfieldRS >= 0 ? color.green : color.red, bgcolor=color.gray) table.cell(infoTable, 0, 1, "vs " + benchmarkSym, text_color=color.white, bgcolor=color.gray) table.cell(infoTable, 1, 1, mansfieldRS >= 0 ? "OUTPERFORMING" : "UNDERPERFORMING", text_color=mansfieldRS >= 0 ? color.green : color.red, bgcolor=color.gray) table.cell(infoTable, 0, 2, "RS New High?", text_color=color.white, bgcolor=color.gray) table.cell(infoTable, 1, 2, rsAtNewHigh ? "YES ✓" : "No", text_color=rsAtNewHigh ? color.teal : color.gray, bgcolor=color.gray) // ============ ALERTS ============ alertcondition(ta.crossover(mansfieldRS, 0), title="RS Turns Positive (New Leader)", message="{{ticker}} Relative Strength just crossed ABOVE zero vs Nifty Midcap 150 — turning into a market leader") alertcondition(ta.crossunder(mansfieldRS, 0), title="RS Turns Negative (Losing Leadership)", message="{{ticker}} Relative Strength just crossed BELOW zero vs Nifty Midcap 150 — losing relative leadership") alertcondition(rsAtNewHigh and not rsAtNewHigh[1], title="RS Line New High", message="{{ticker}} Relative Strength vs Nifty Midcap 150 just hit a NEW HIGH — classic leadership signal")
CuriousInvestor@arc1471

Most traders check a stock's price. Smart money checks its Relative Strength. The Problem: A stock can go up 10% and still be a laggard — if the broader market/index went up 20% in the same period. Price alone doesn't tell you if a stock is a leader or a laggard. Most retail traders never check this. They just look at the chart in isolation. The Solution: I built a Pine Script indicator that measures a stock's strength relative to the Nifty Midcap 150 - not just its raw price. 🟢 Green = stock is OUTPERFORMING the index 🔴 Red = stock is UNDERPERFORMING the index 📈 New RS highs = institutional-grade leadership signal (this is what shows up BEFORE big breakouts - Minervini/O'Neil's core principle) This is how you filter "going up" from "actually leading the market." Free script. Drop a 🔥 if you want the code, I'll share it.

English
1
2
11
3.6K
K@n!§hk
K@n!§hk@kmehta83·
@arc1471 U have some amazing charting skills, love to read n learn from your posts God bless ❤️ Gratitude 🙏
English
1
0
2
140
CuriousInvestor
CuriousInvestor@arc1471·
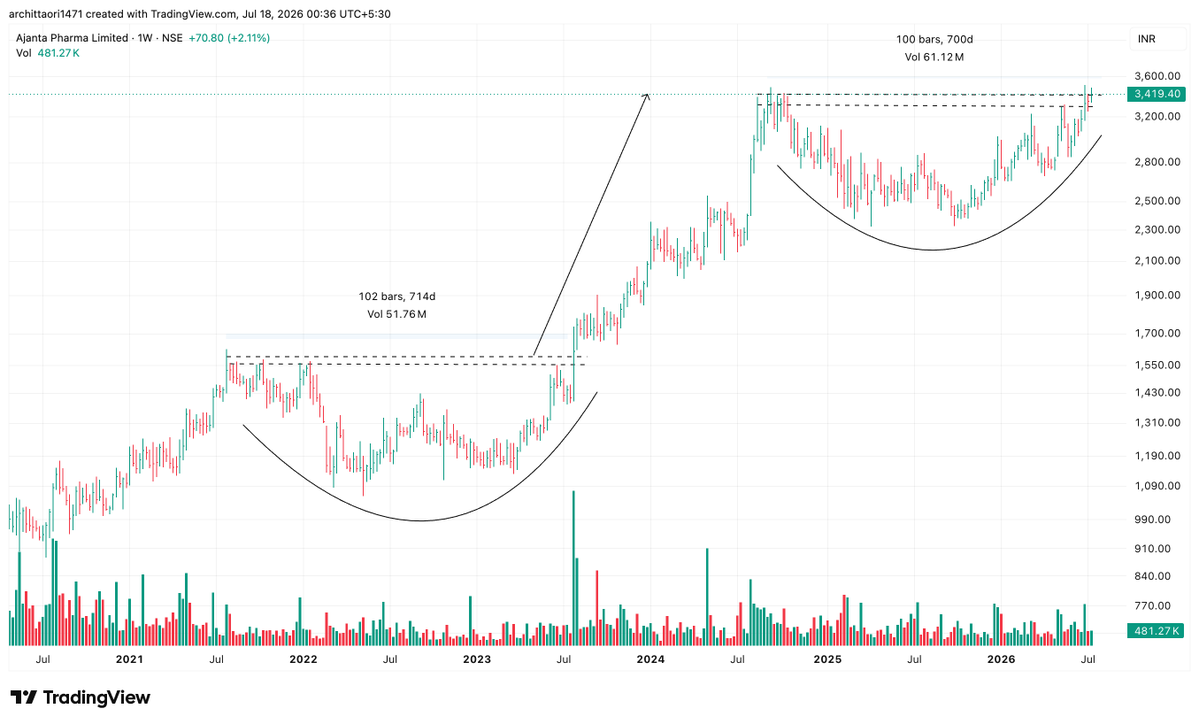
#AjantaPharma just did the same thing twice. 4 years apart. 2021-2023: A 714-day cup formed. ₹1,550 was the resistance. Broke out. Stock went from ₹1,550 → ₹3,600. (+132%) 2024-2026: Same stock, same pattern. A fresh 700-day cup just formed. And guess what level it's testing right now? ₹3,419. The exact same resistance zone from the last breakout. This isn't coincidence. This is what a Stage 2 base-building cycle looks like on a quality business -accumulation, breakout, re-basing, breakout again. Same stock. Same structure. Same discipline required to sit through 700 days of "nothing happening" before the move. Chart doesn't lie. Patience does the rest.
CuriousInvestor tweet mediaCuriousInvestor tweet media
English
4
6
92
8.5K
CuriousInvestor
CuriousInvestor@arc1471·
Everyone's asking: Will AI replace technical & fundamental analysis? Wrong question. The Problem: Today, every trader has AI, real-time data, algos, agents — all doing analysis at a click. Information asymmetry is dead. If everyone has the same tools, shouldn't every trader win equally? My take: Chart patterns were never the cause of price moves. They're the effect - of human behavior. Fear, greed, FOMO, panic-selling, euphoric buying. That psychology built these patterns in the 1900s, and the exact same patterns still work in 2026. Why? Because AI can process infinite data — but it cannot replicate human emotion. It can tell you what happened. It can't feel the panic that made a trader dump a stock at the bottom, or the euphoria that made another chase a top. Markets aren't driven by information anymore. They're driven by how humans react to information — and that hasn't changed in 100+ years, and won't change because AI got smarter. AI is a better calculator. It is not a better human. The edge was never about having the data first. It was always about mastering your own behavior when everyone else loses theirs.
English
2
3
18
3.5K