Sabitlenmiş Tweet

AskEdgar
1.1K posts
@AskEdgarIO
The new standard for trading research, now autonomous. Building AI agents on SEC filings and proprietary data.
JP Morgan's investment research team just shared exactly how they built their multi-agent system "Ask David", and it's the same architecture pattern showing up everywhere: - supervisor agent orchestrates - specialized subagents handle retrieval, structured data, analytics - LLM-as-judge reflection node before the answer ships - human-in-the-loop for the last accuracy gap worth watching for anyone building:
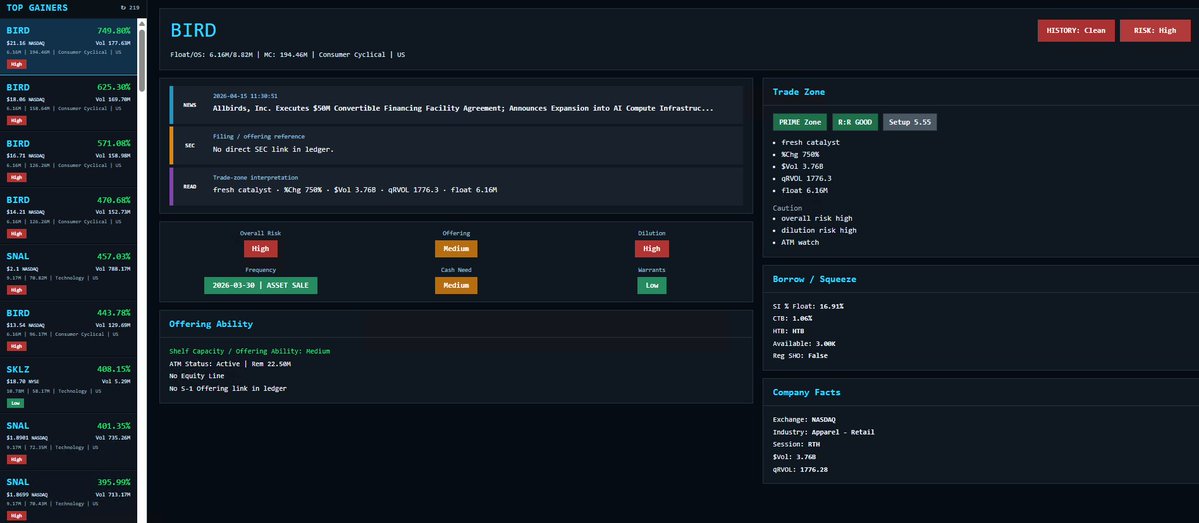
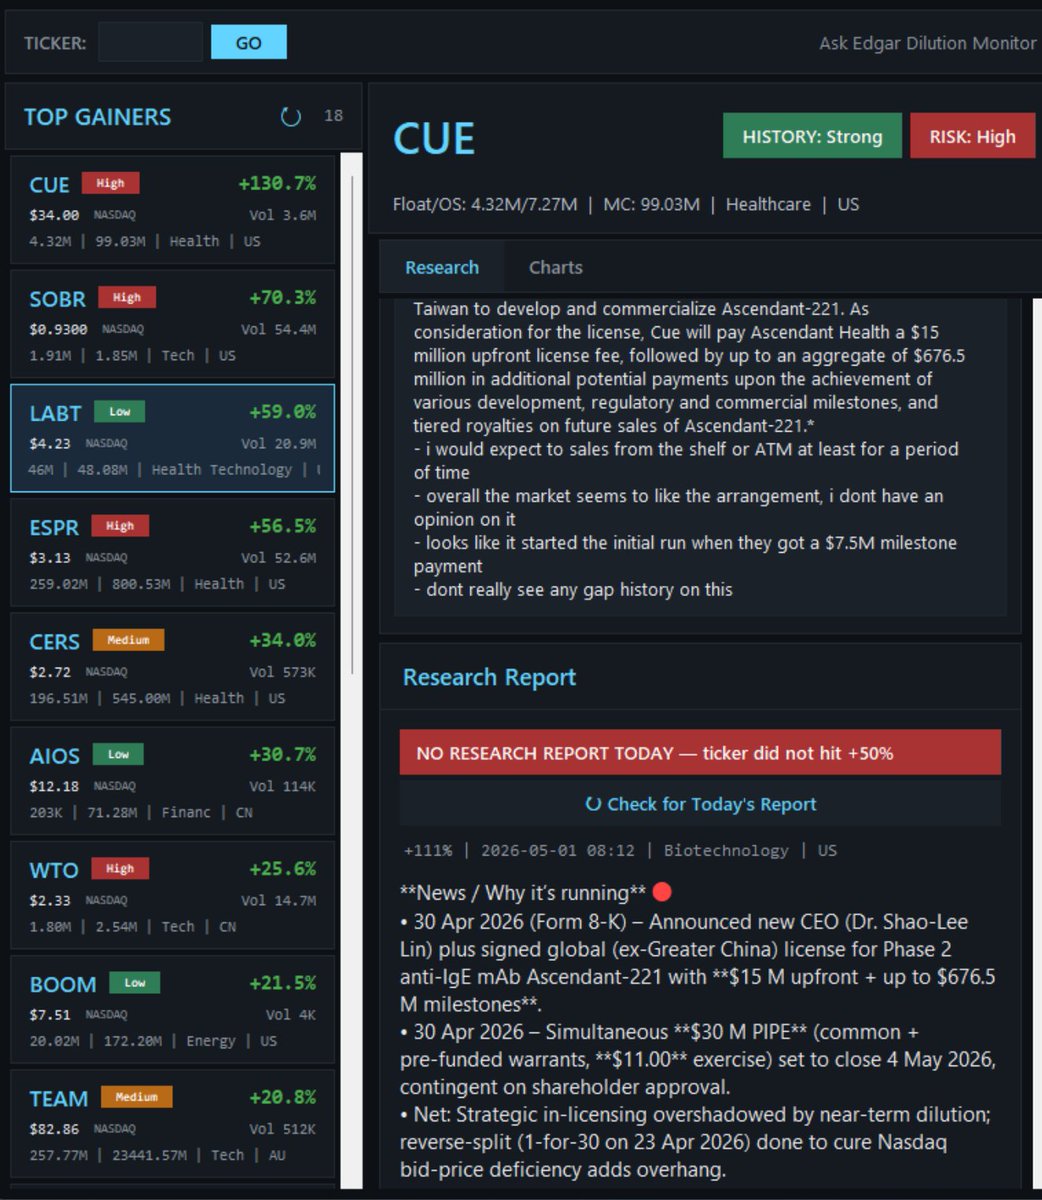
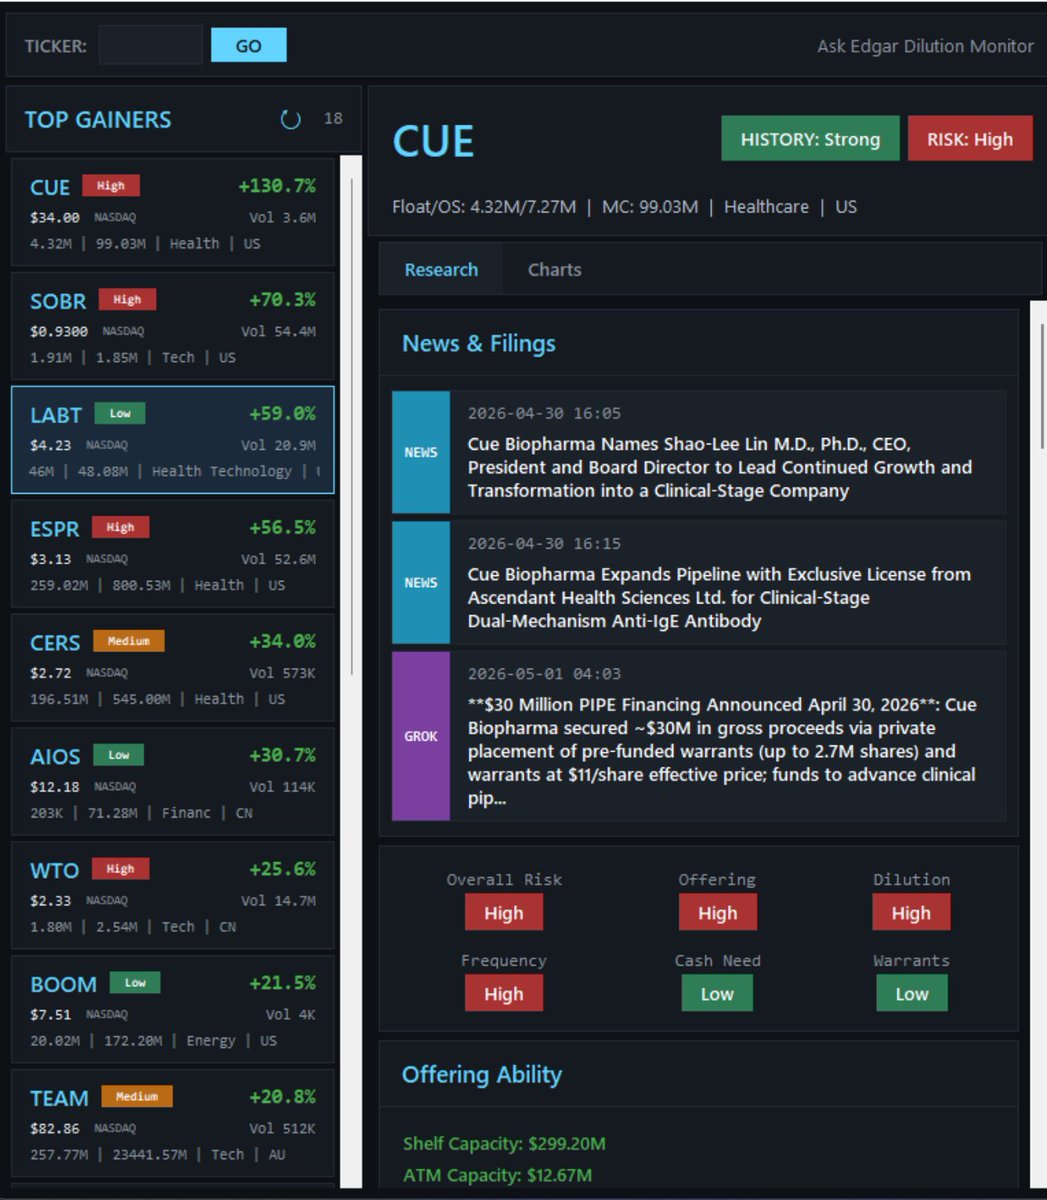
🧐Dilution was HARD, until I realized this...🧐 Most traders overcomplicate dilution. They get buried in exercise prices, price protection clauses, share calculations, and end up paralyzed by details that don't actually help them make better decisions. Here's the thing - you don't need to understand every mechanic. You need to find the common denominator. Same underwriter. Same entities holding warrants. Same chart structure developing. If you've seen how it played out before, you already have your thesis. 🎮 The Core Idea Stop trying to master every clause in every filing. Instead, ask three questions: Who's involved❓ the underwriter, the equity line provider, the warrant holders, the convertible note holders. How did it play out last time they were involved❓ Is the chart developing the same way❓ If the answer to all three points in the same direction, the odds favor a similar outcome. It won't always resolve identically - but from experience, it resolves similarly far more often than not. 🎮 Example 1 — $AHMA and the underwriter pattern When you pull up AHMA's dilution profile, it's almost blank. The only thing visible is an IPO underwritten by AC Sunshine. Not much to work with on its own. So the next step is to pull up the deal screener on askedgar.io, search AC Sunshine 🏦, and look at every other ticker they've been involved with. Go through the charts. See how those plays resolved. In this case, two tickers stood out - $CTNT and $TWWG . Both had the same setup: a high-volume trappy day one, followed by a slow grind upward over several days, then a full liquidation. When AHMA started developing the same pattern - trappy open, slow drift up, the thesis wrote itself. And it resolved the same way. You don't need to know exactly why it happened. Early lockup expiration, insider dumping, a third party accumulating and unloading - the specific mechanism doesn't matter. What matters is recognizing that the same people produced the same chart structure and the same outcome, and acting accordingly. 🎮 Example 2 — $MLEC and the equity line This one is different because the comparison isn't across tickers - it's the same ticker at different points in time. MLEC had an active equity line with an entity called Numera. Back in April 2024, they used it and the stock gapped and faded on the same day. Fast forward to a more recent move: pre-market action is developing almost identically. Similar gap, similar price action, same equity line still active. The one variable that was different this time was news. The April move had zero catalyst. The recent move had a news item - nothing with real fundamental impact, but enough to cause the gap. That may have made the setup slightly more resilient. Or maybe they didn't sell from the equity line this time. Or maybe outside players stayed away because the dilution overhang made the stock harder to control. The honest answer is: we don't know exactly. And that's fine. We don't need to know. Same entity, same structure, same developing chart — that's enough to build a thesis and manage around it. *The video this is based on is from the @AskEdgarIO YouTube channel. If you trade small caps and you're not watching it, you're missing the kind of structural knowledge that separates traders who understand what they're holding from those who find out the hard way: @askedgar" target="_blank" rel="nofollow noopener">youtube.com/@askedgar
💯 The Bottom Line Whether it's a registered offering, an equity line, a convertible note, or a straight secondary - the structure matters less than the pattern. Find the common denominator. Look at how the same people performed in previous setups. See if the chart is telling the same story. That's it. That's the whole framework. The traders who overcomplicate this are the ones who miss the move entirely while they're still reading footnotes. 🫂Where to do this research 🫂 Everything covered here - underwriter history, equity line providers, warrant holders, offering timelines, chart comparisons is searchable through askedgar.io. The deal screener alone is worth it: type in an underwriter or fund and pull up every ticker they've touched, along with what happened around each offering. For real-time tracking of shelves, equity lines, offering history, and filing alerts, here's my referral link. Transparent as always: small credit if you sign up, wouldn't share it if I wasn't using it myself: t.co/rwC54YhLqY 😋BREAKING: look at this. Claude can now answer any question about how to use the AskEdgar API, which endpoint to pick, what fields it returns, how to structure the query. connect the AskEdgar Docs MCP and start building. live now.
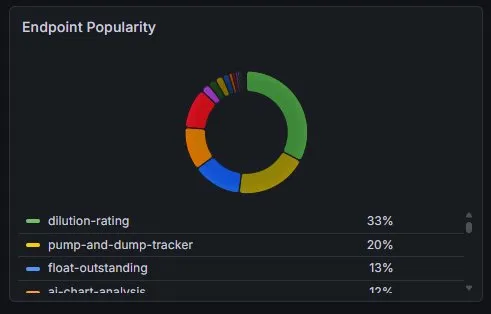
quick look at what AskEdgar API users are actually building after 7 days: - 50% of all calls hit dilution-rating or float-outstanding - ~18% hit the news summary endpoint - ~9% hit ai-chart-analysis - the rest spread across individual dilution-data, the screener , etc traders are building real small-cap and dilution monitoring tools for themselves.