AP
33 posts
AP
@austinapp1
This is my journey as a full time student and aspiring trader. 21
Goleta, CA Katılım Mayıs 2020
55 Takip Edilen10 Takipçiler


@austinapp1 @doomdayer haha okay all good my brother I am defensive around trolls these days 😂🤝
I track SO many good setups. I trade a lot of them and a let a LOT more of them pass me by. impossible to catch every wave!
English
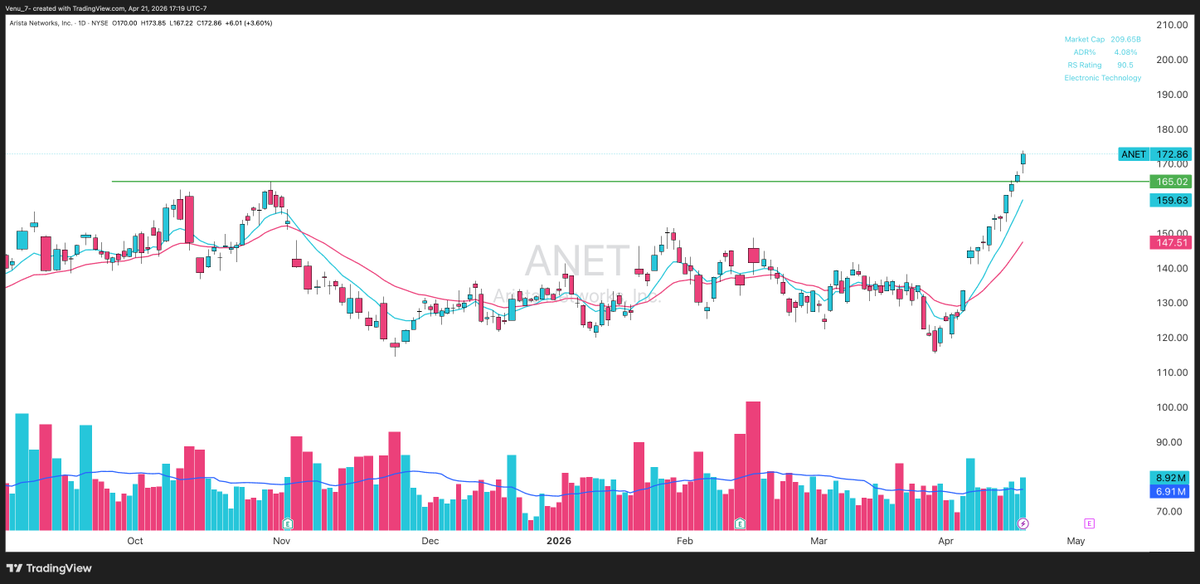
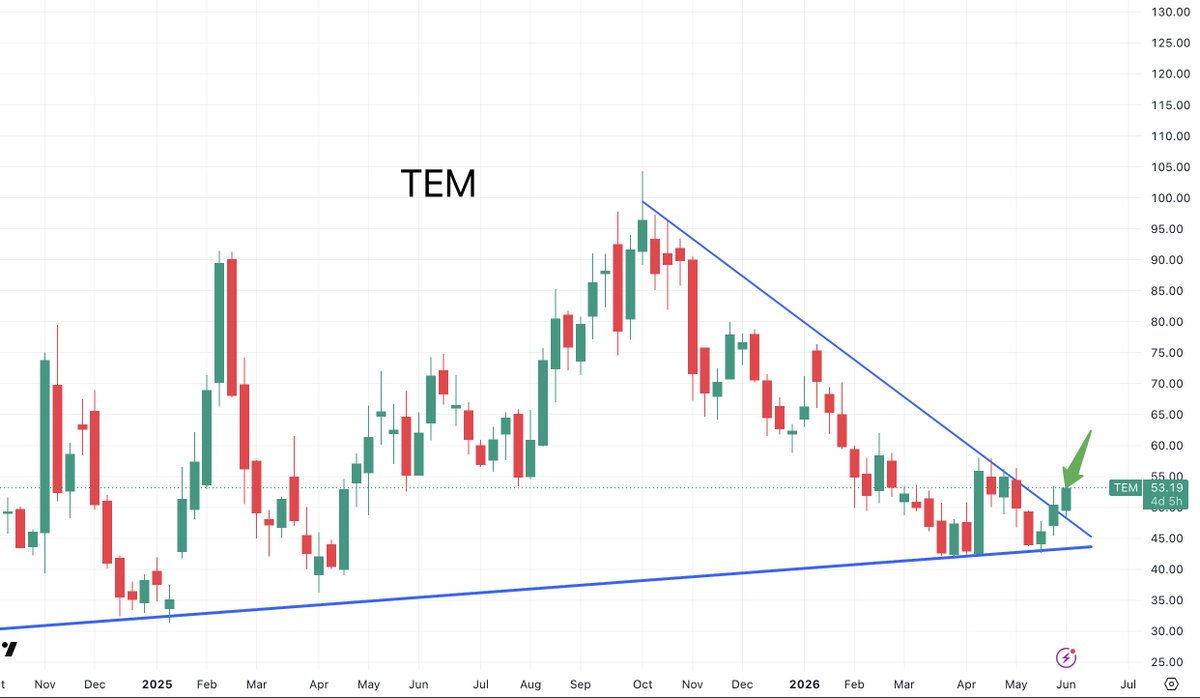
Of all the software breakouts swirling around the market right now
my favorite might be $TEM 👀
English
@jrouldz @doomdayer bro! i wasnt hating. was just an inside joke because i know you didnt press gas on ZETA and other setups and then regretted it
English
@doomdayer @austinapp1 True but also…🤣
Some people just want to try and knock strangers on the internet. it must be an insecurity thing 😅 I cannot personally relate 😂

English

Are we earlier than we think?
When we look back at the .com bubble, much of the commentary is on 1999 itself and the blowup that ensued. This angle focuses on when valuations finally eclipsed earnings, but fail to consider the earlier years in the run where the $SPY saw double digit earnings growth after the fall of the Soviet Union and the Savings and Loan Recession. This recession lasted 8 months.
The reason I mention this is because right now many are drawing the comparison of this market to the final innings of the .com blowup, when in reality, we might be earlier in the game than we think. As it stands, we are seeing robust earnings growth and fair valuations in the index:
- Positive EPS surprise: 85%, Historic rate: 75%
- S&P500 Earnings growth: 28.9%, Similar years: 1993, 2009, 2021
- NTM P/E: 21.3, Last 10 years: 18.9
Bundle these metrics up, and the market looks a lot more like the rebounds from recessions in 1990 and 2008, versus the hyperinflated speculative bubble of 1999 or even 2021.
If you actually read this put your favorite food in the comments
Early last year, I drew the comparison of the charts between 1993 and 2025, here is the update:

English

My God there are so many good setups in the market right now.
English
@Xavier671564783 @_TJRTrades The memory chip industry (DRAM, NAND) is one of the most cyclical sectors since chips are highly volatile supply/demand.
Low PEs since
- Massive capex and long fab build times (2–3+ years) create boom-bust cycles
- Demand swings
- Earnings can swing 5–10x in a cycle
English

@_TJRTrades micron trading at 10x forward earnings you’re retarded. it’s a long term play
English


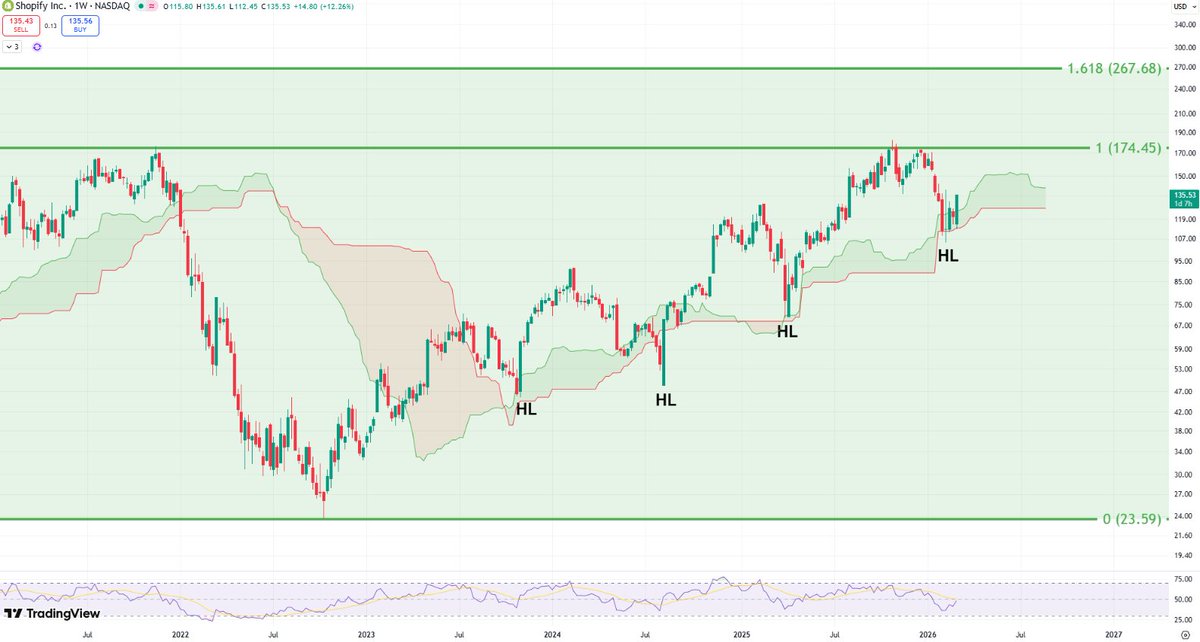
$SHOP is another chart that held exactly where it needed to, right at the bottom of the weekly cloud, printing another higher low within the broader uptrend while the weekly RSI reached its most oversold levels in years.
From a HTF perspective, this setup suggests a strong probability of significantly higher prices over the coming months and years.
5-star HTF chart.
English