

bruce bond
789 posts

@b69ndmoon
Follow for cross-asset charts no one else can make BTC vs Pokemon 📊 NFTs vs Gold, Pre-IPO vs Crypto Building @OmniaChart — chart anything vs anything. · NFA


6 months later, update on this thread: BTC MC: $1.60T Pokemon PSA total MC: ~$3.0B Ratio: ~500 The catalyst — tokenization rails — is finally landing. $CARDS, Phygitals, Beezie all shipping. It would be crazy but I think 10-20 level of this ratio could happen in next years.


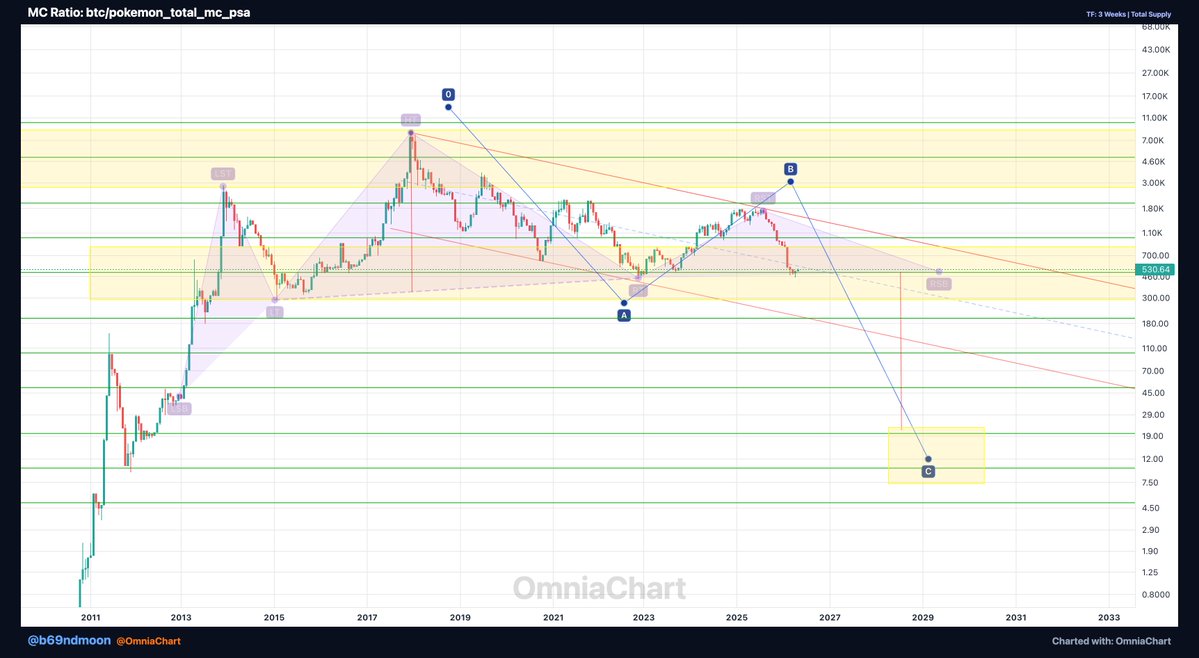
2/ The $BTC/pokemon_psa_total_mc chart suggests that the ratio might go back between 25-50. This aligns with the anticipation of an alt season and a risk-off environment, which could catalyze a massive influx into Pokemon cards via tokenization. 
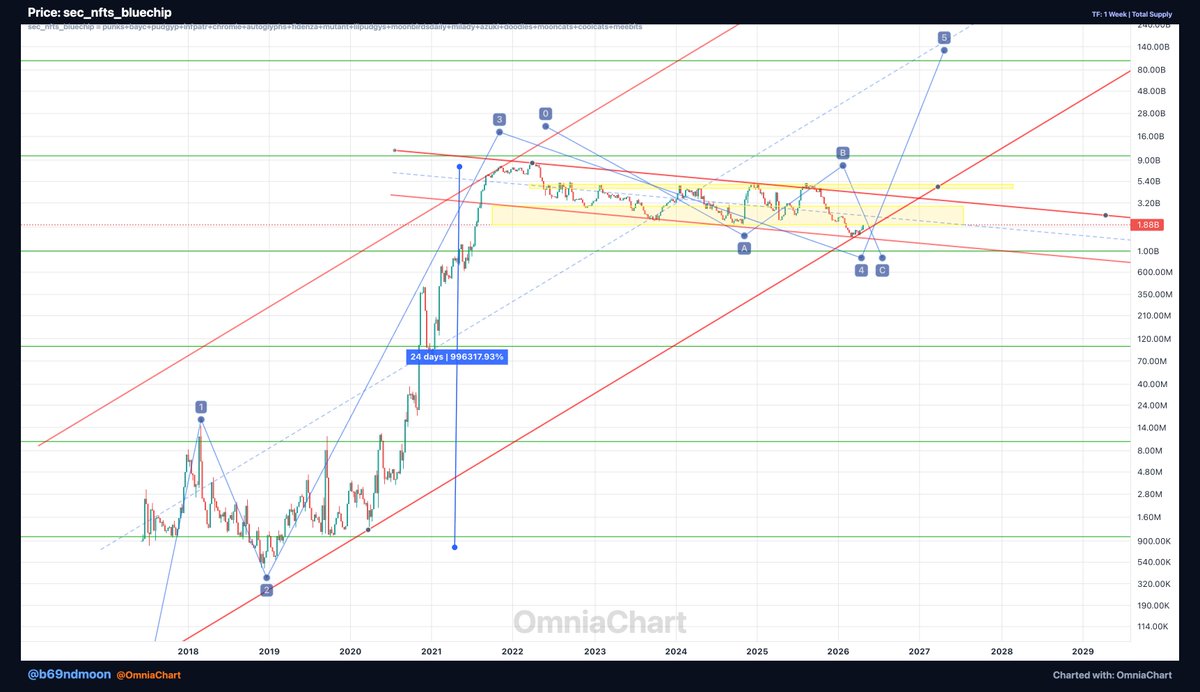
The prediction here is a final extended wave of mania driven by nostalgia and renewed interest in the Pokemon franchise. This is a reconstruction of the Pokemon PSA cards market cap using data points of prices and pops of the main cards.


Ratio Report #1 📊 BTC vs Charizard 1st Edition PSA10 — range held for over a month. 0.033–0.666 ratio boundaries. Sitting mid-range right now. Reaccumulation or distribution? Genuinely hard to call. Two completely different liquidity profiles and valuation models. Charizard 1st Ed. is ~$200M total MC. That gap matters when you read this chart. $BTC @OmniaChart #Bitcoin #Pokemon #Charizard #CollectiblesVsCrypto #CrossAsset #RatioReport #OmniaChart

Ratio Report #1 📊 BTC vs Charizard 1st Edition PSA10 — range held for over a month. 0.033–0.666 ratio boundaries. Sitting mid-range right now. Reaccumulation or distribution? Genuinely hard to call. Two completely different liquidity profiles and valuation models. Charizard 1st Ed. is ~$200M total MC. That gap matters when you read this chart. $BTC @OmniaChart #Bitcoin #Pokemon #Charizard #CollectiblesVsCrypto #CrossAsset #RatioReport #OmniaChart

CryptoPunks still have a 10x edge over Pudgy Penguins — but the gap is closing. Pudgy/Punks MC ratio: bottomed at 0.01x in 2022. Found a higher structural low at 0.1x. Now bouncing strongly off that level — wave 5 of a multi-year structure per the chart. Parity isn't guaranteed. But the higher low is real. $PENGU @pudaborgypenguins @cryptopunksbot @OmniaChart #PudgyPenguins #CryptoPunks #NFT #NFTMarket #CryptoCollectibles #Web3 #OmniaChart


The Spring phase hit in December 2023 — right after the Bittrex shutdown, with massive sell pressure and capitulation. Since then: 📉 Range-bound price structure, likely a LPS (Last Point of Support) 📈 Low but steady volume 📊 Bottoming patterns also visible vs BTC, ETH, and other pairs (charts below) 🪙 Still trading on exchanges: XeggeX, nonkyc, TradeOgre, StakeCube


