The world's most powerful family just made their boldest move ever.
They spent $3.8 BILLION to vanish from the public eye.
Not out of fear or safety concerns. But for something much bigger...
Here's the real reason a $15 TRILLION family went private: 🧵
Fibonacci Retracement Explained
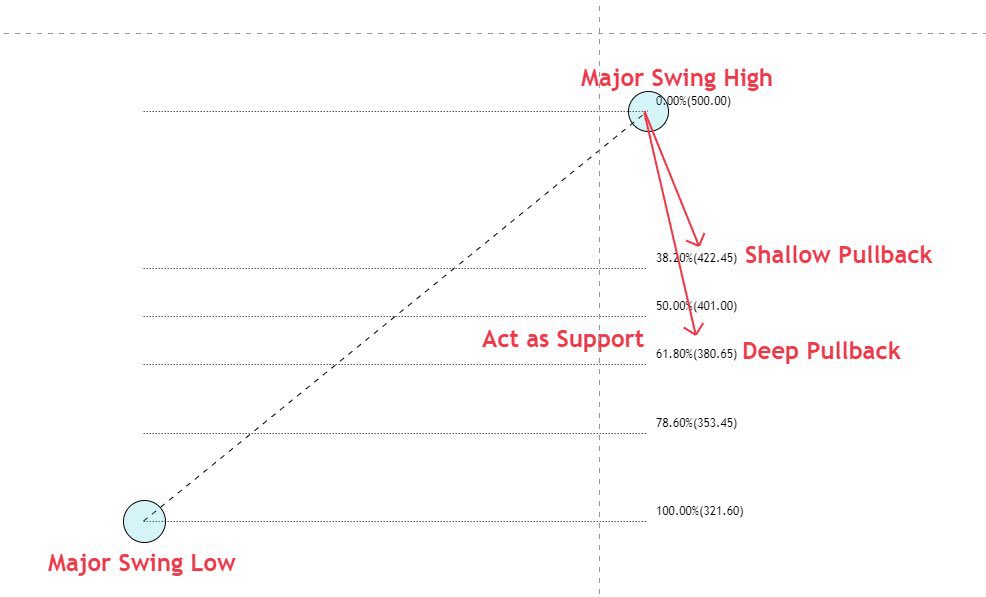
In technical analysis a Fibonacci retracement is a trading methodology for determining high probability support and resistance levels on a chart. It uses the Fibonacci sequence and that is where its name comes from.
A Fibonacci retracement uses the theory that price swings on charts will usually retrace and backfill a mathematical portion of a move, after this measured pullback the trend usually continues the move in the original direction.
A probable Fibonacci retracement level is quantified by taking two distant price points on a chart and dividing the vertical distance by using the key Fibonacci ratios. 0% is the starting point for the measurement of the retracement, and 100% is a total reversal back to the starting point of the move.
Fibonacci levels are identified by measuring moves from the starting point of support or resistance. Horizontal trend lines are drawn on the chart to identify the potential key support and resistance levels. The significant levels to look at are 61.8% 50%, 38.2%, and 23.6% for support or resistance.
A Fibonacci retracement is a very common technical tool that price action traders use to look for high probability price levels to enter trades, set stop losses in current trades, or set profit targets for winning trades.
The concept of looking at key retracement levels at possible price extensions is a method not only used with Fibonacci but also with many other methods like Elliott Wave theory, Wolfe Waves, and Gartley patterns. After an up or down swing in price the new price support and resistance levels can be seen showing up at the key retracement levels in these methods.
While moving averages can change as price moves the Fibonacci retracement levels are set prices. They are targets on the chart that stay the same. This simplifies the identification of signals and creates price levels that can be acted on immediately when reached. These levels are key reaction points on a chart and can lead to a binary action for traders as the there is either a breakout in price or it is rejected and holds as support or resistance.
The primary 0.618 Fibonacci retracement price level used by so many stock traders is approximately the ‘golden ratio’.
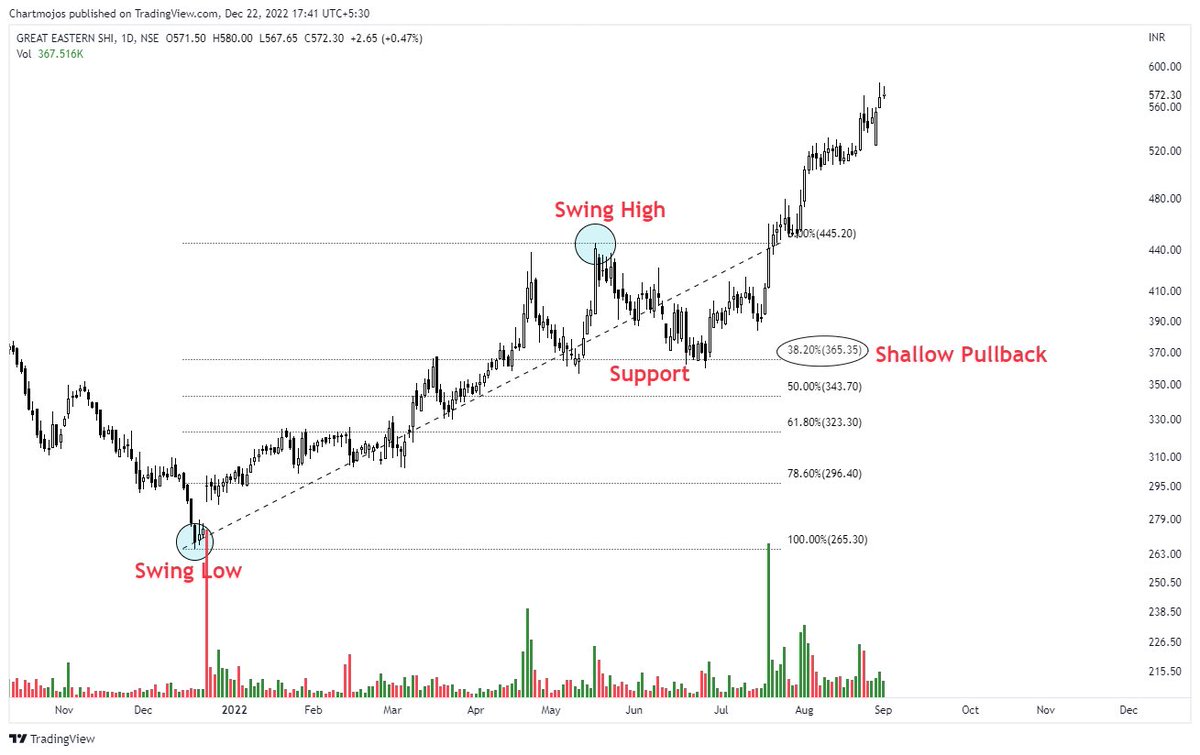
The below example shows Fibonacci retracement levels on the chart for the USD/CAD currency pair. In this example the price action retraced approximately 38.2% from a move down before continuing.
🧵 1/
People wonder why clothing changed so much between the early 20th century and now...Or why people would ever dress "So formally"
What people don't realize is how much lifestyles have changed in that time
How to increase your win rate:
1. Backtest each timeframe
2. Backtest each session
3. Develop a set of criteria to enter a trade
4. Only trade once all criteria are hit
5. Focus on one pair
6. Focus on one session
7. Focus on one timeframe
If I open the charts and don't see what my plans says that I need to see to have a valid trade, I will close the charts and go about my day.
If I see a valid setup, I will set an alert near the entry or set a limit if price is close to the level and then go about my day.
Year 1: They call you stupid because you start trading.
Year 2-3-4: Practice 24/7, losses, failures, late nights, backtests, emotional breakdowns, new systems, risks, ideas...
Year 5: They call you lucky because you are a successful trader.