
Bricks
57 posts

Bricks
@bricks_hq
Your AI data analyst to create dashboards and reports ⚡️ Join our Discord - https://t.co/Hl5oNlXbu7
San Francisco Katılım Temmuz 2024
0 Takip Edilen224 Takipçiler
📷 Webinar Replay Available!
If you missed our live training on creating dashboards & reports from your spreadsheet data with AI in Bricks, don’t worry — the recording is now up on YouTube! 📷
In this session, we cover: All the latest and new features in Bricks
- Auto refreshable dashboards
- Filters in dashboard
- Reuse dashboard as templates
- Support for bigger files (300k-500k rows)
English
Join us Oct 7th (tomorrow) at 8pm UTC for a free live webinar!
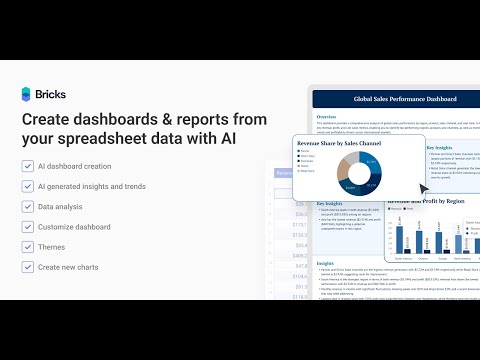
Learn how to turn any spreadsheet into a polished, interactive dashboard with AI in Bricks — no formulas, no setup.
✅ Live demo
✅ Real-world examples
New Features
- Auto refreshable dashboards
- Filters in dashboard
- Reusable dashboard (as templates)
English
Look doesn't matter if your workflow still sucks.
Try Bricks if you value your time! We can do your job in minutes that takes hours in Excel.
Microsoft Excel@msexcel
New look, same sheets
English
Dashboards with AI, made simple and stunning. Tried Bricks, the #1 AI Dashboard tool yet?
#dataanalysis #aitools #dashboard #powerbi
English
@IronRedSandHive Short answer: yes.
Long answer: it depends on how the data is structured in each sheet, and we could help with that on a quick call: calendly.com/thebricks/bric…
English

@bricks_hq Is this capable of merging 10 different sheets, or am I on the brink of insanity?
English
📷 Webinar Replay Available!
If you missed our live training on creating dashboards & reports from your spreadsheet data with AI in Bricks, don’t worry — the recording is now up on YouTube!📷 Watch here: youtu.be/RJs9ntdViAc
In this session, we cover:
✅Advanced features for dashboard creation
✅Live Q&A highlights with the Bricks team
Perfect if you want to see how Bricks can transform raw spreadsheets into polished, shareable dashboards with zero formulas or setup.
YouTube
English

@jacksoncurro 100% - that's exactly why people pick Bricks over Power BI.
English

@bricks_hq The fact is a lot of people don't care for how complex things are these days. People want simple and value.
English

@jacksoncurro Nailed it. Complexity impresses demos, simplicity keeps customers.
English
@bricks_hq What provides the best customer experience. Usually its simplicity.
English
@GLaDOUGHSandHiv It’s simple- one costs you time, the other gives it back.
English

@bricks_hq I flip-flop depending on my mood, today I say complexity for spice. Convince me otherwise.
English
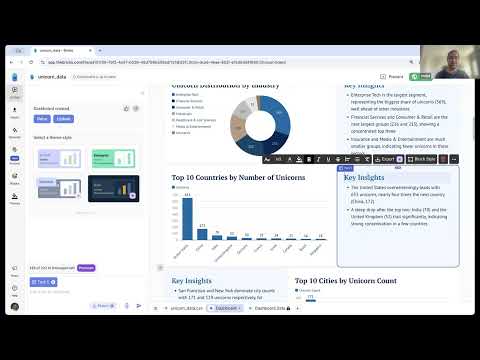
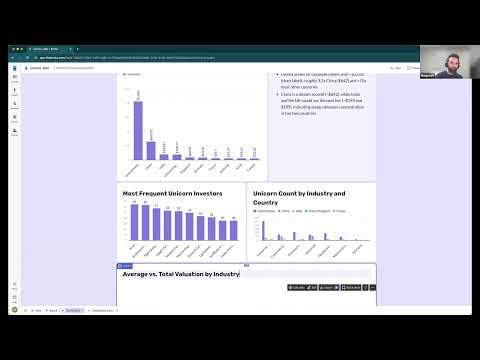
In this training, you’ll see how Bricks can transform spreadsheet data into interactive dashboards — automatically generating charts, KPIs, insights, and tables. What’s included:
- Live demo: from CSV to dashboard in minutes
- Walkthrough of advanced dashboard features
- Showcase of real-world dashboards
- Q&A with the Bricks team
English
Missed the first session? No worries 📷We’re running it again on 23rd September at 8PM UTC — another chance to join our live Zoom webinar on creating dashboards & reports with Bricks.
It’s free to attend — register here 📷 us06web.zoom.us/webinar/regist…
English
📷 Webinar Replay Available!
If you missed our live training on creating dashboards & reports from your spreadsheet data with AI in Bricks, don’t worry — the recording is now up on YouTube!📷 Watch here: youtu.be/wNn19gs1FaM
In this session, we cover:
✅ How to turn Excel/CSV files into interactive dashboards instantly
✅ Advanced features for dashboard creation
✅ Live Q&A highlights with the Bricks team
Perfect if you want to see how Bricks can transform raw spreadsheets into polished, shareable dashboards with zero formulas or setup.
YouTube
English