Sabitlenmiş Tweet

$BTC
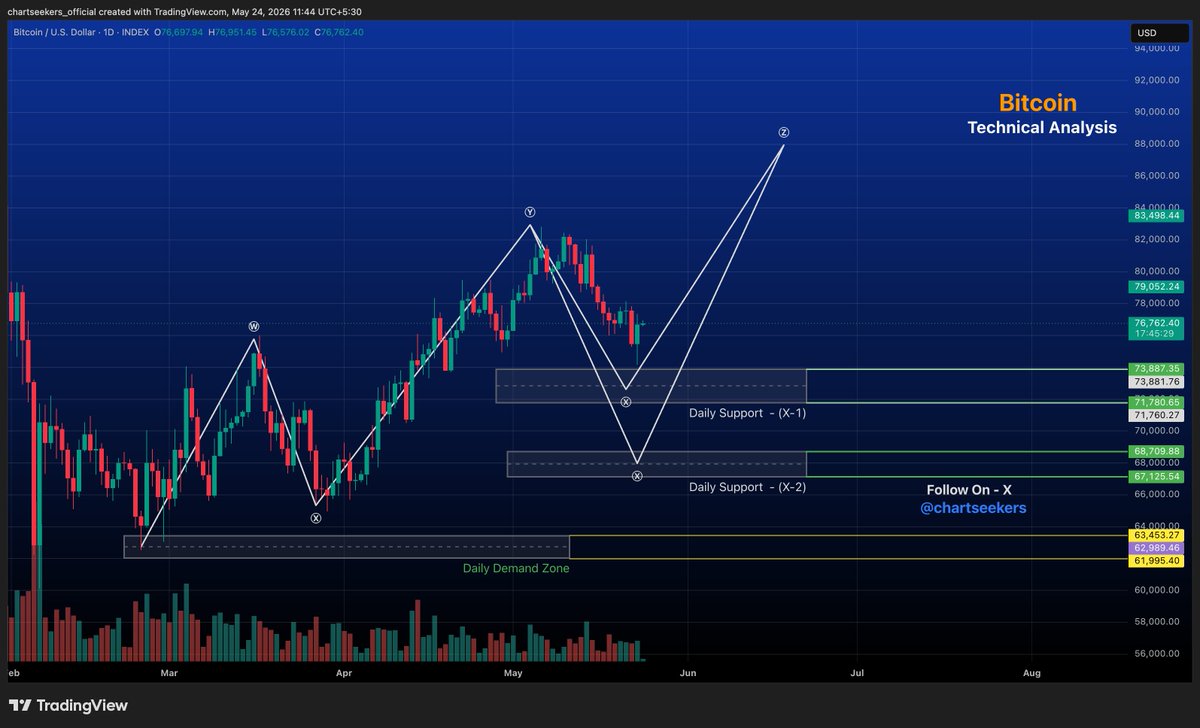
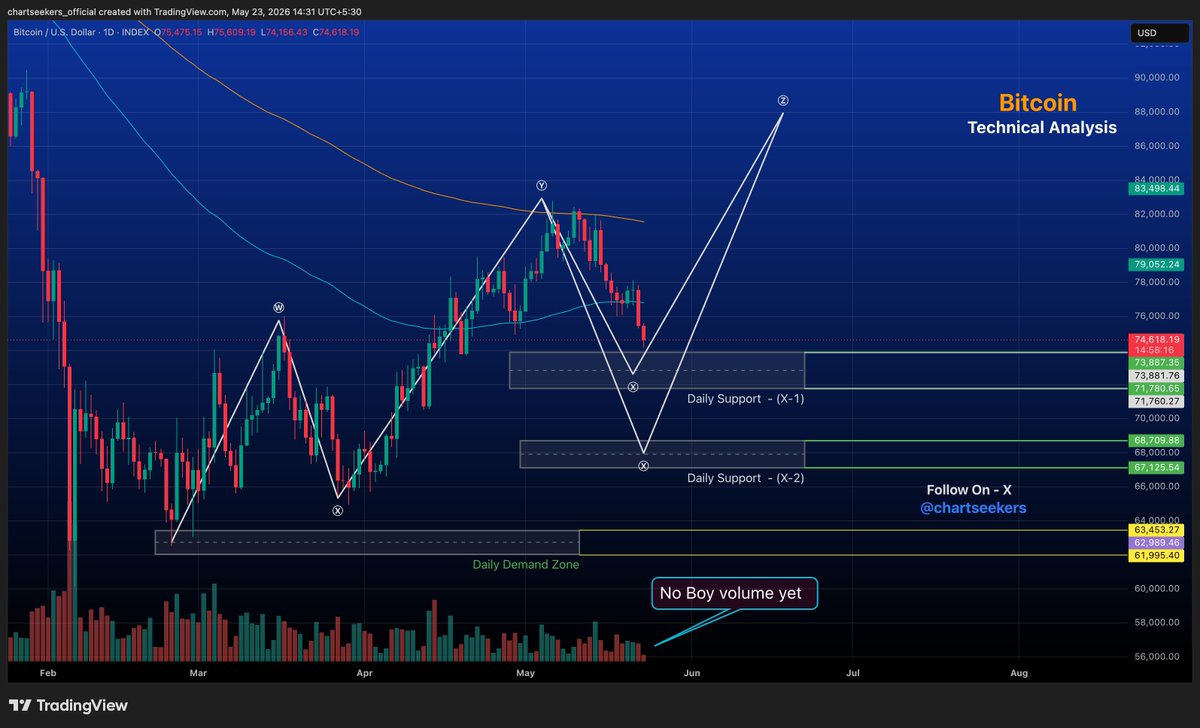
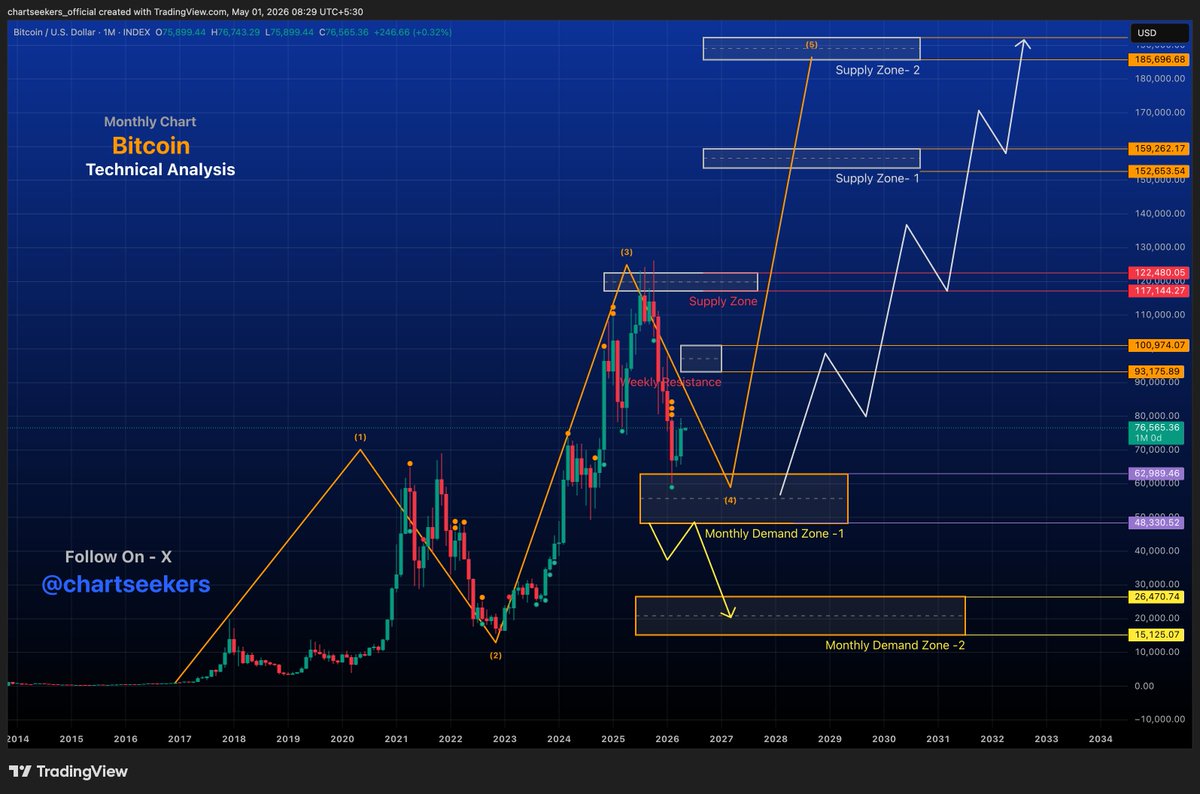
#Bitcoin has confirmed a strong monthly close, finishing above the previous month’s candle — a bullish signal that strengthens the ongoing macro uptrend. This monthly breakout keeps the higher-timeframe structure intact and increases the probability of continuation toward the major supply zones ahead.
As long as price sustains above key support levels, the next upside targets remain the $150K–$159K range, followed by the upper supply zone between $180K and $185K. Momentum on the monthly chart suggests buyers are still in control, with any short-term pullbacks likely to be viewed as continuation opportunities.
On the downside, one major risk still remains open on the chart: the untested monthly demand zone between $25K and $15K. While this is a low-probability scenario under current bullish conditions, it remains an important long-term liquidity zone if the market faces a deeper corrective cycle.
Overall, Bitcoin remains in a powerful long-term bullish structure, with higher targets active unless key monthly support zones are decisively broken.
English