chartvist
181 posts


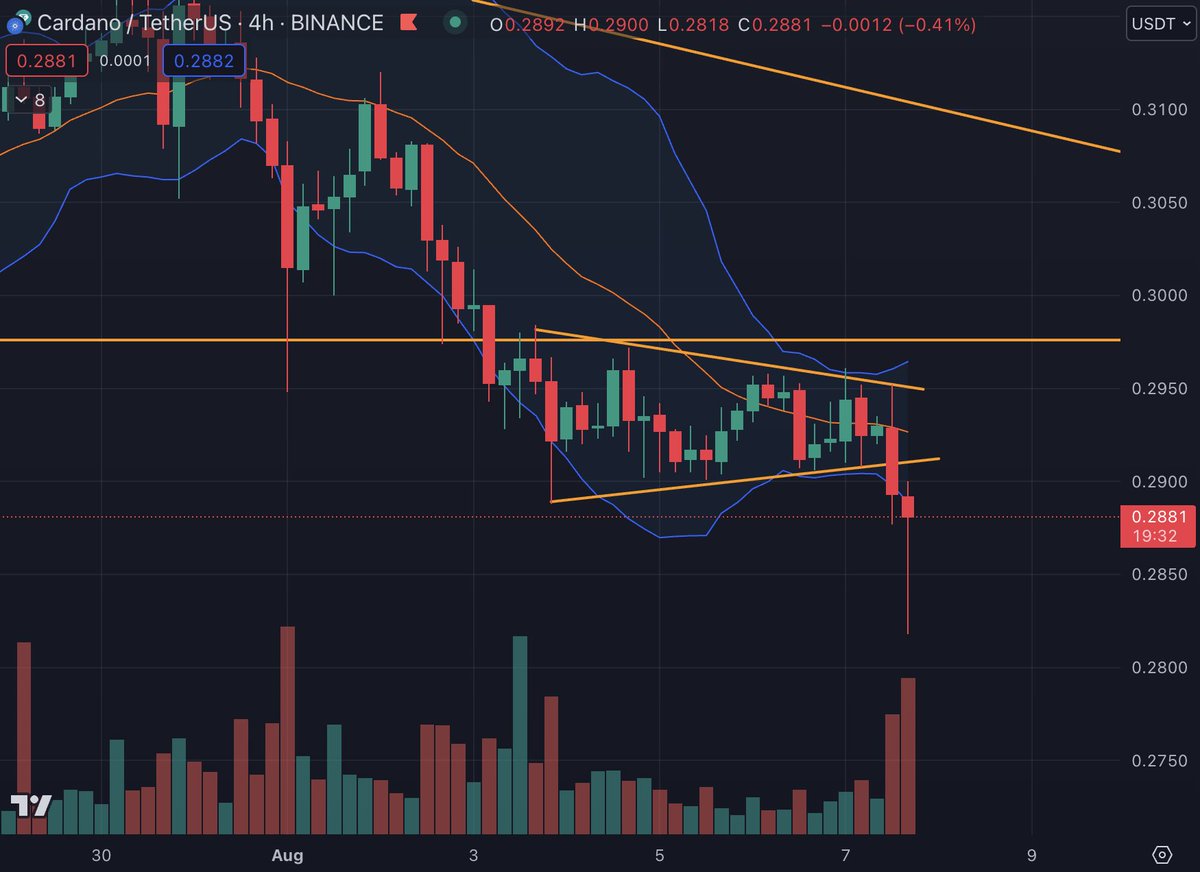
$ADA having a rough day breaking down from pennant below .30 Possible hammer could indicate strong buyer support and put price back in range for daily candle close Otherwise prior support at .2816, .26, and .2522 is in the cards
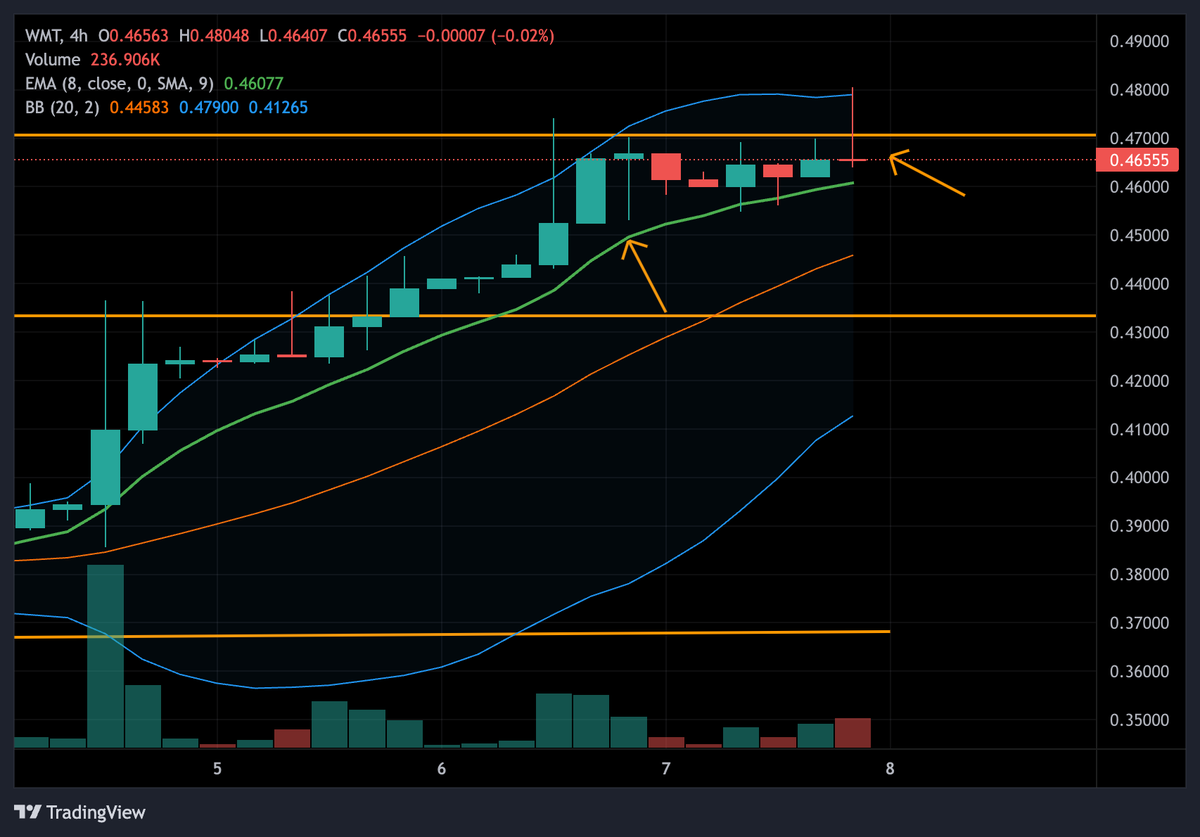
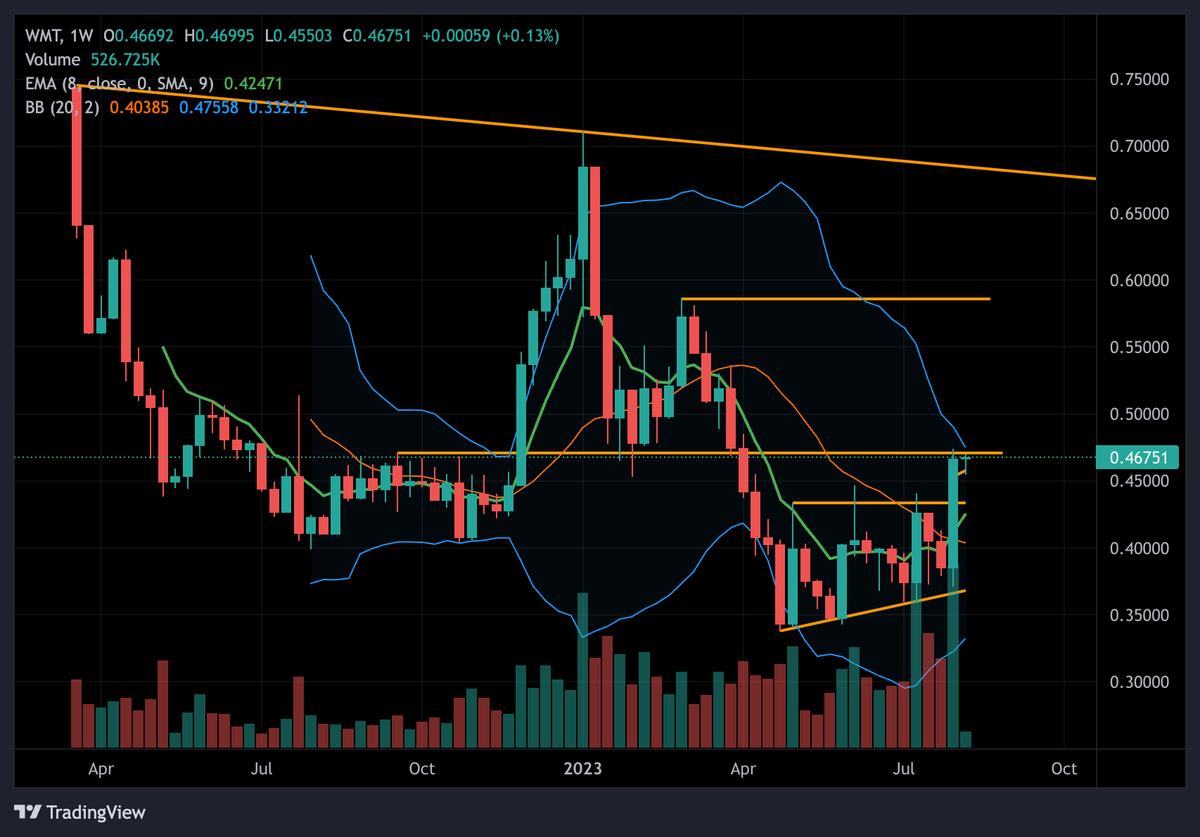
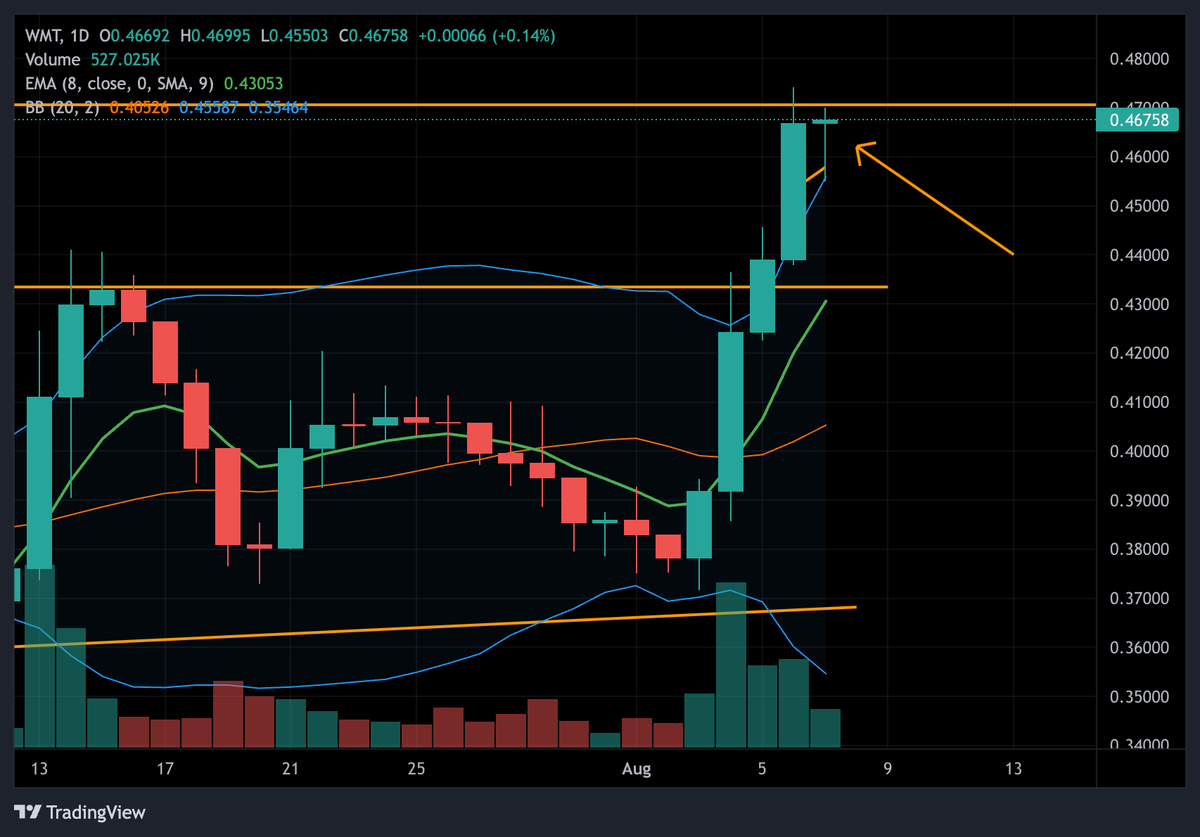
$WMT strong breakout from consolidation pattern However, price has returned to test macro resistance and macro picture is still downtrend Macro resistance tests like this are a common short set up for analysts, especially if daily closes in this hanging man doji candle
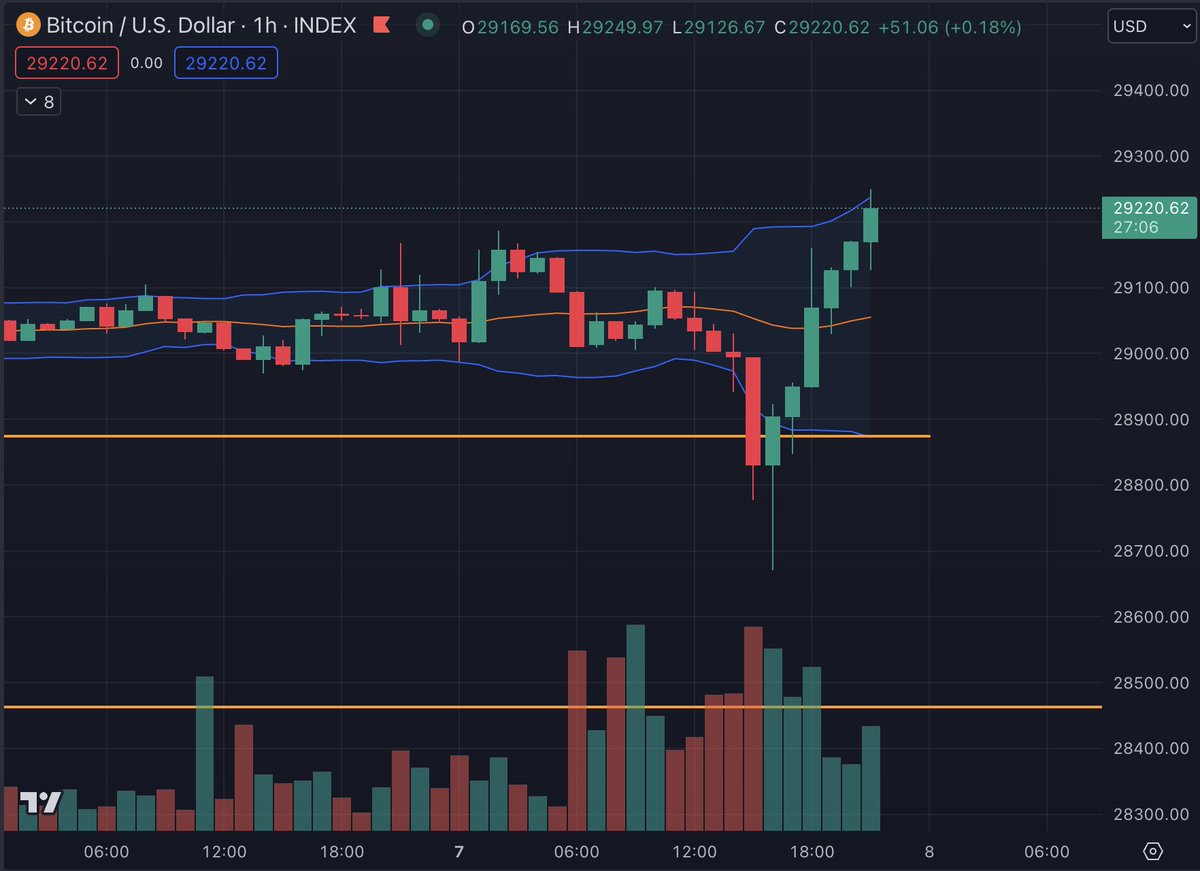


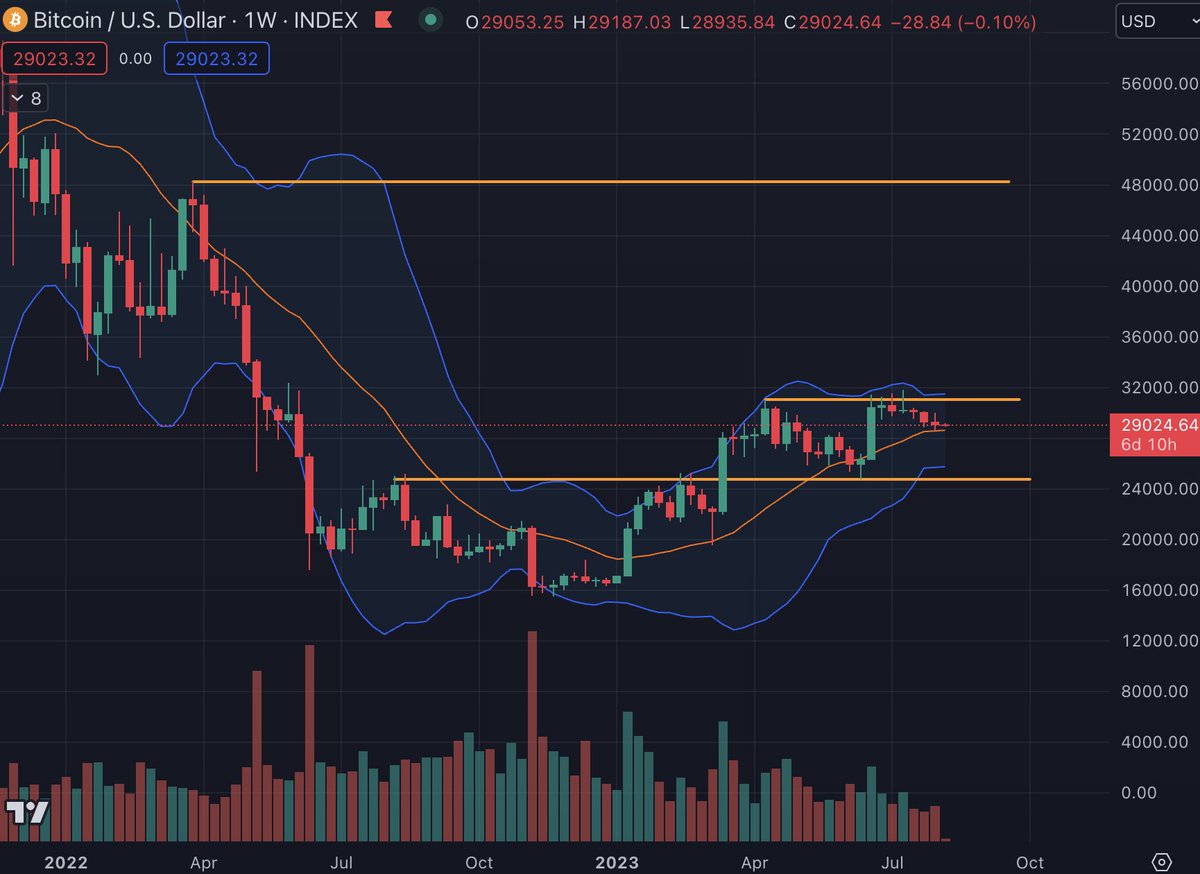
Historically low Bitcoin Vol indicating big move is coming. From a Cycle position, #bitcoin is in a great spot to make a fast 10-week run towards $42,000. In the meantime, on the downside, $24,700 should not be breached to remain in play.


Two charts. Two different prices. But not totally dissimilar. 🤔 #ethereum #Cardano
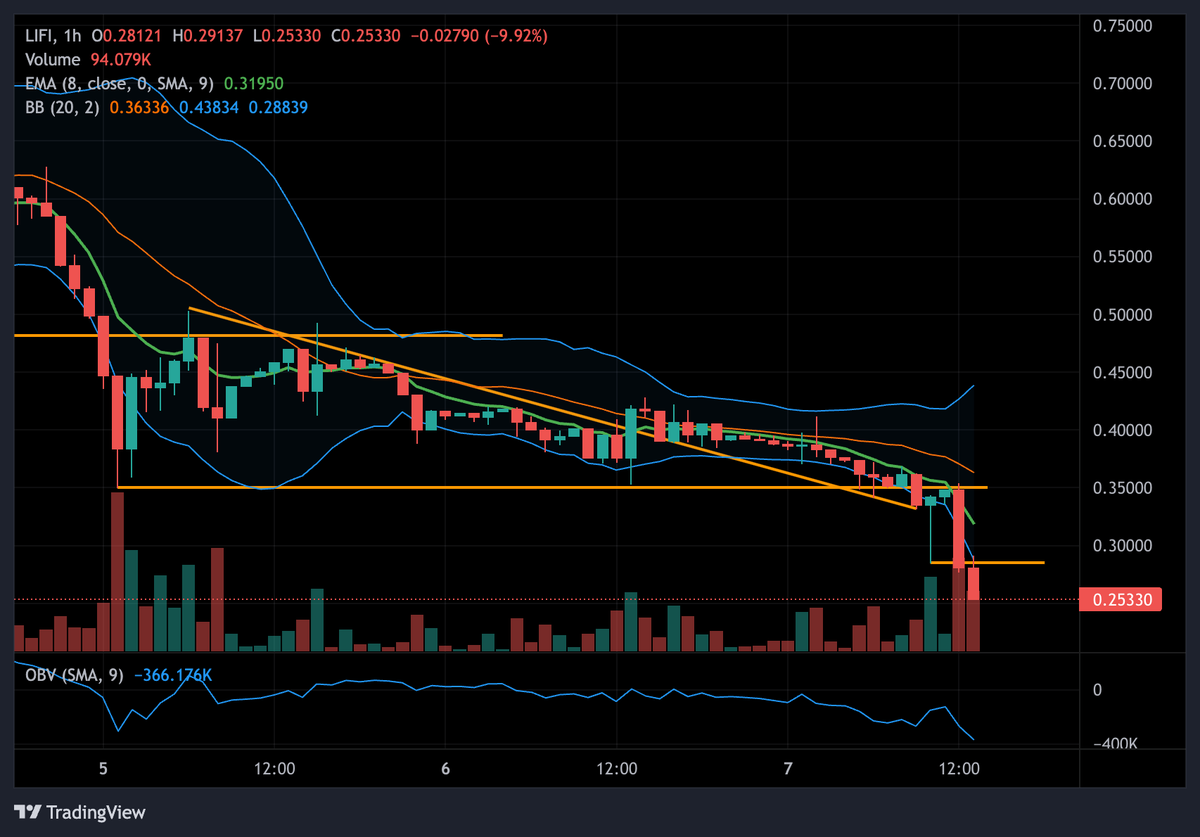
$LIFI showing a hammer with massive volume after dropping below original price Hammer indicative of reversal, especially with high volume However, prices will often retest wick bottom for support as a good entry Confirmed break above .35 resistance may indicate change as well
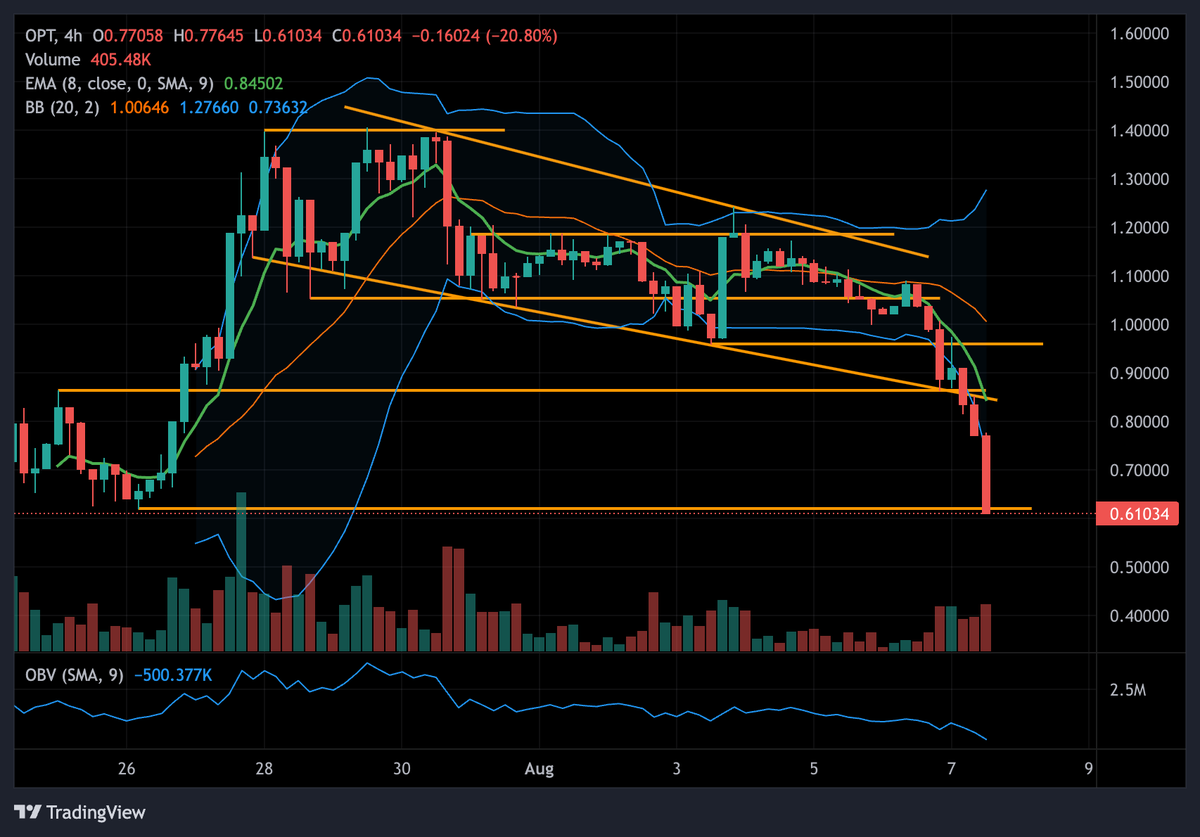
$OPT continues break down through major support levels and trendlines In conditions like this, do not rely on hope or hype that a coin will "bottom" or go up from here, as many do not. Expect trends to continue, wait for the market to tell you otherwise
$OPT continues break down through major support levels and trendlines In conditions like this, do not rely on hope or hype that a coin will "bottom" or go up from here, as many do not. Expect trends to continue, wait for the market to tell you otherwise

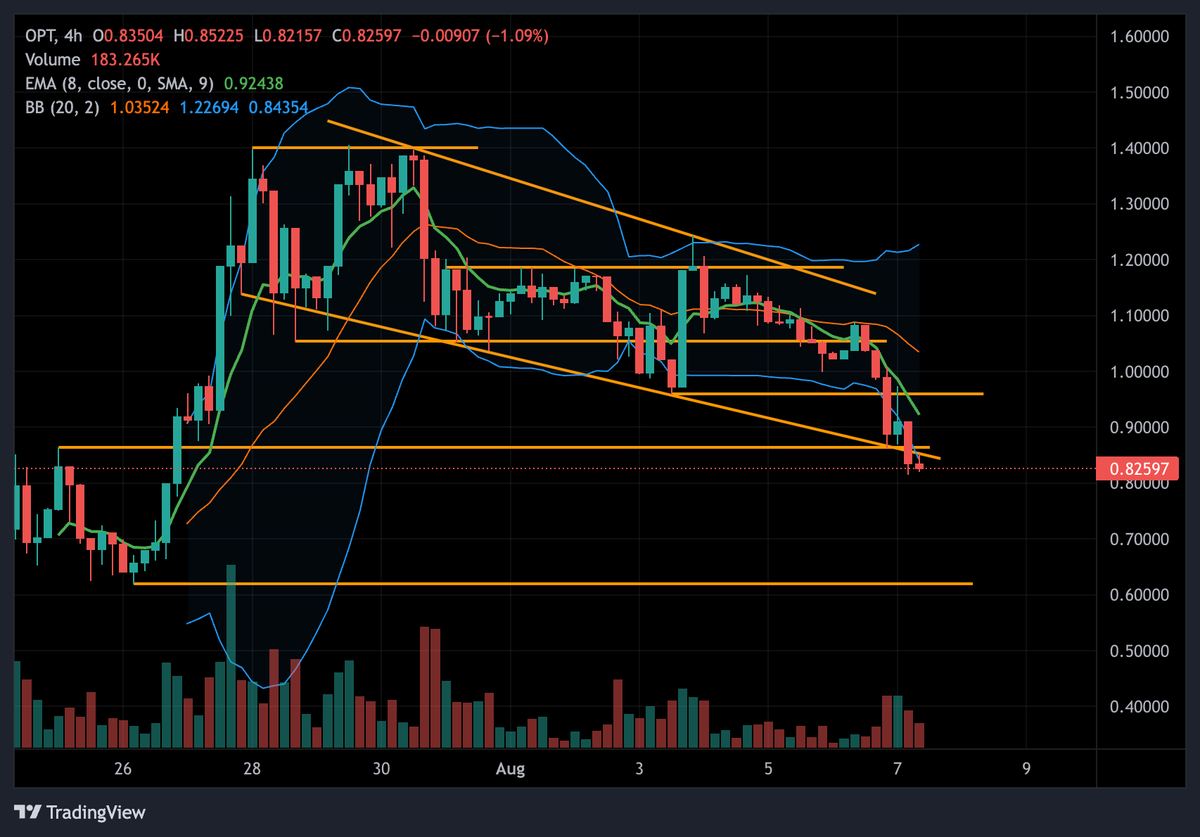
$OPT broke down to the only remaining support in its history Could rally from this point, and reclaiming 1.05 as support would begin to indicate reversal, however currently a picture of weakness