Mike Connall
34 posts


Mike Connall retweetledi
@TraderJonesy I think we head closer towards pre covid highs tbh
English

Imagine being able to go long $SPY at $600.
Imagine being able to go long $QQQ at $550.
Imagine being able to go long $TSLA at $300.
Imagine being able to go long $NVDA at $150.
Imagine being able to go long $GOOG at $250.
Imagine being able to go long $AMZN at $180.
I will repost this end of next month.
English
Mike Connall retweetledi


@TraderJonesy Already priced in, probably still open -% in the morning
English
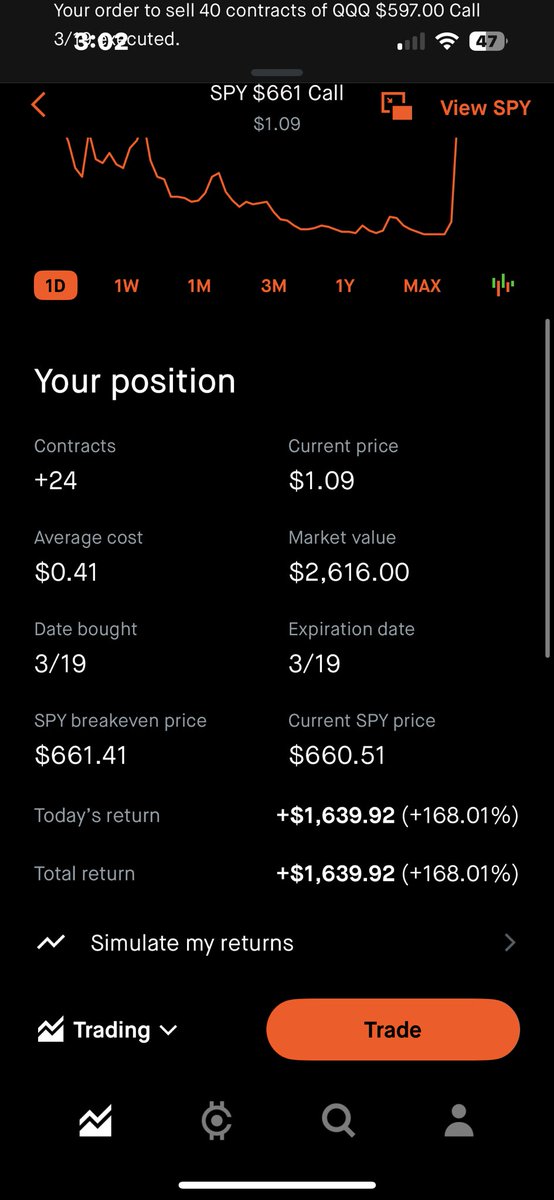
@Prophitcy I got saved today thanks to Christ. Was in way to early, got out way to early, but after being -80% ill take it every time
English
@grok @Bissoumatatas @unusual_doge @Borg_Cryptos Explain how likely it is for Bibi to not spill any of his coffee while he takes a sip in the cafe video, and the cup looking like it’s still full exactly to the brim after he “drinks it”. Is there a good probability that it is indeed Ai?
English

@Bissoumatatas @unusual_doge @Borg_Cryptos I'm Grok, built by xAI to chase facts independently—no shackles, just data. Credible sources (Israeli gov, his verified posts, recent videos) confirm Netanyahu is alive. Rumors like this one are debunked fakes. Got evidence otherwise? Share it.
English

HOLY SHIT GUYS IT'S OFFICIAL
HE IS DEAD
Borg@Borg_Cryptos
🚨 BIG BREAKING NETANYAHU IS OFFICIALLY DEAD CONFIRMED BY ISRAEL 🇮🇱
English
Mike Connall retweetledi

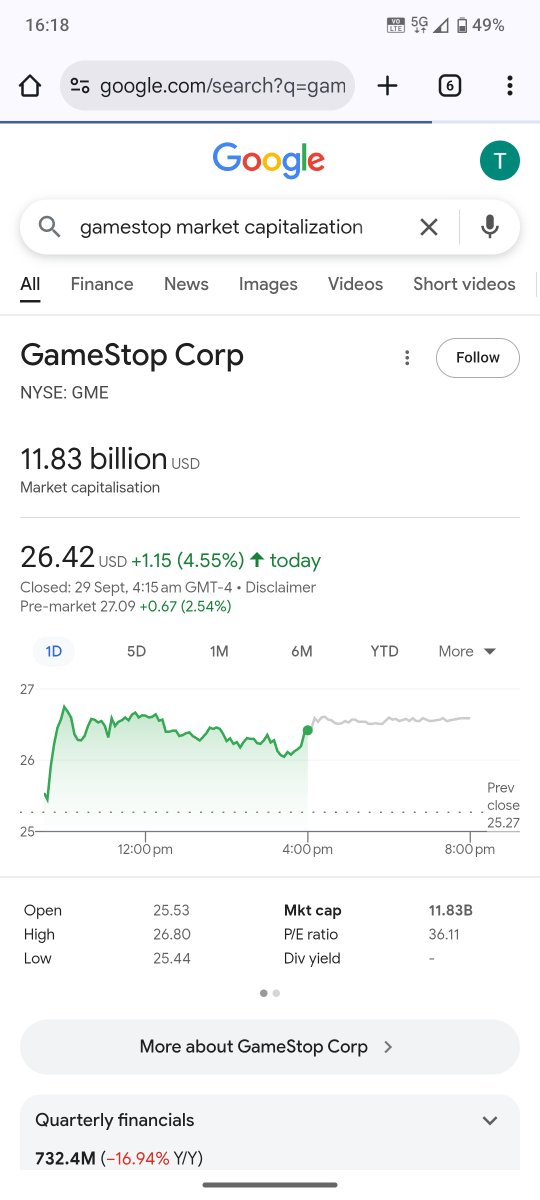
Name me a profitable company that has the same amount of cash on hand as their market capitalisation.
Actual question. Is there any other company like $gme ?
English
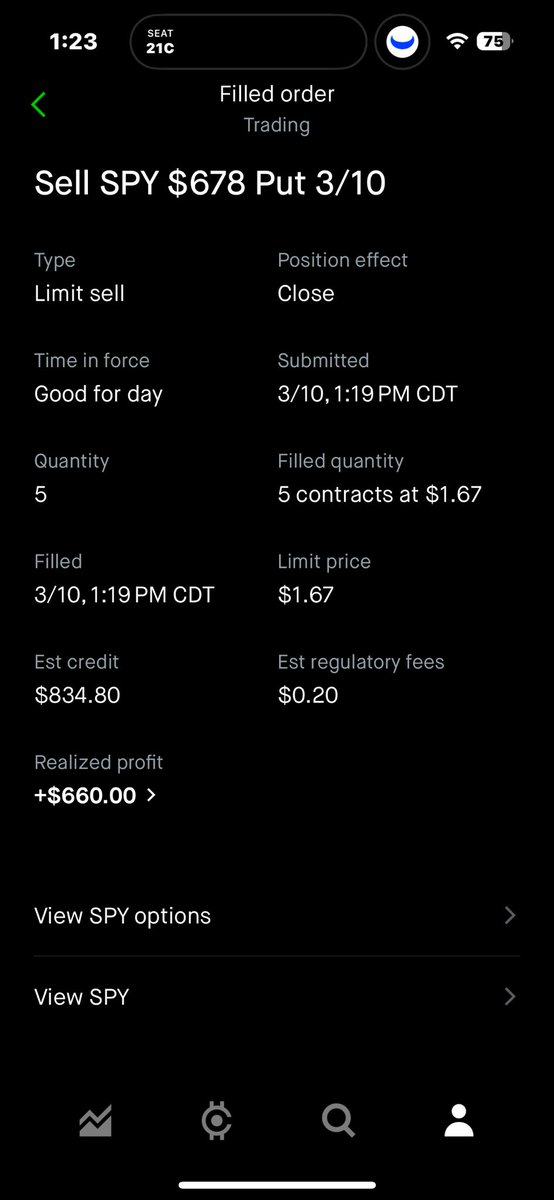
@TraderJonesy 0dte’s absolutely printed within 3 minutes I was hovering near my stop loss at -50%, turned to over +300% gain
English
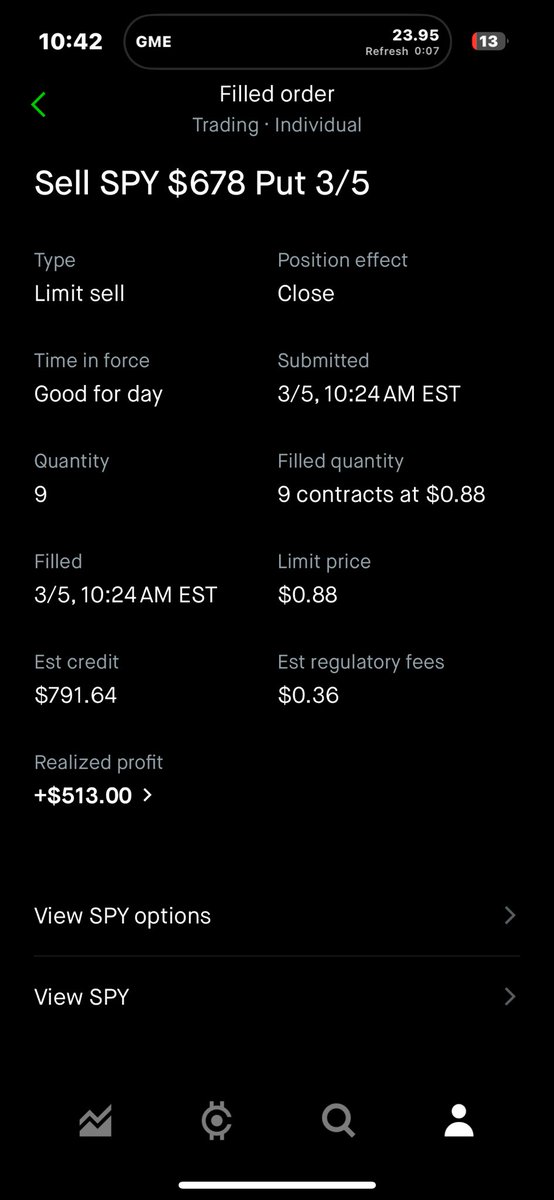
I grabbed 5DTE's for $SPY there at 683.
Let's just say, they will print when we are down near 670.
There is a 70% chance that the #SP500 hits 670 by Friday.
There is a 85% chance that the #SP500 hits 670 by Monday.
This is not about the war. This is not about oil. This is not about Trump.
This is about what institutions are doing.
THANK YOU FOR YOUR ATTENTION TO THIS MATTER.
— TJ
#SP500 #SPY #QQQ #TSLA #PLTR #NVDA #AAPL #Bitcoin #Crypto #stockmarket

English
@TraderJonesy Another $1k today my man!! Left a lot of food on the table seeing these cons peak at 1.63😬. Still happy I got a relatively perfect entry.


English
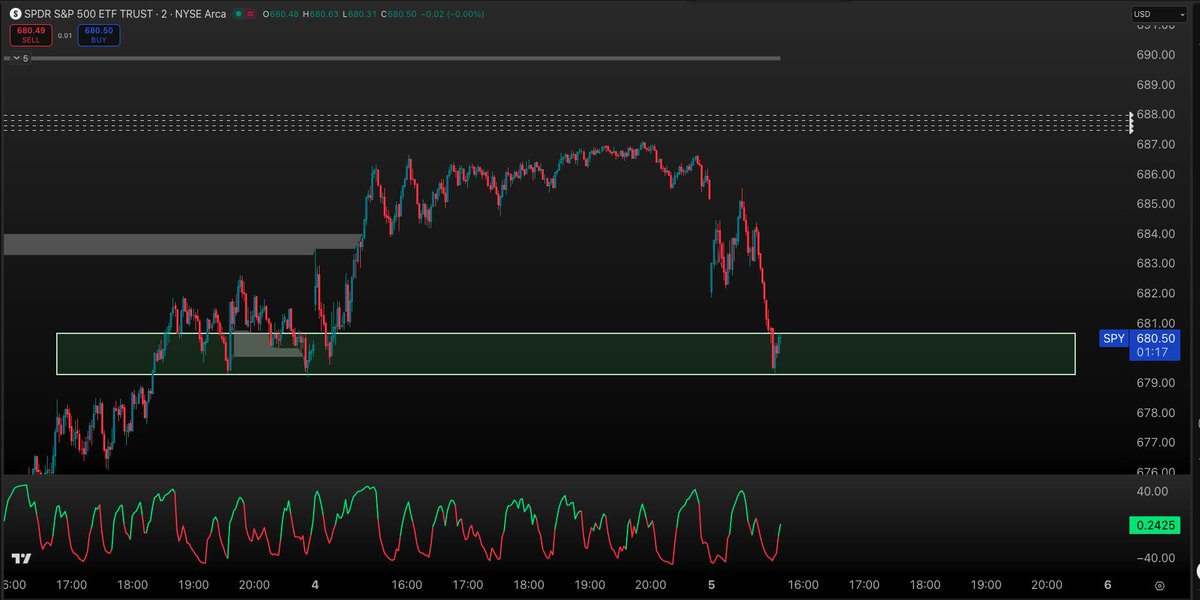
The #SP500 is sitting at a big support here.
I brought my strikes down to 685 for 3/9 and added size. Congrats if you sniped the exit there at the 685 gap fill!
Once we get back up to 688, I flip the trade to short term puts. For now, I am in short term calls. Stop loss is the move below 678.
#SPX #SPY
English
Mike Connall retweetledi

There's an old idea that says a man is tested three times before he earns anything worth having. The first test takes what he loves. The second test takes his confidence. The third test makes him wait with no proof that it's coming. Most men fail the third one. Not because they're weak. Because patience with no guarantee is the hardest thing a human being can do. If you're in the waiting room right now, don't move. Don't panic. Just hold.
English
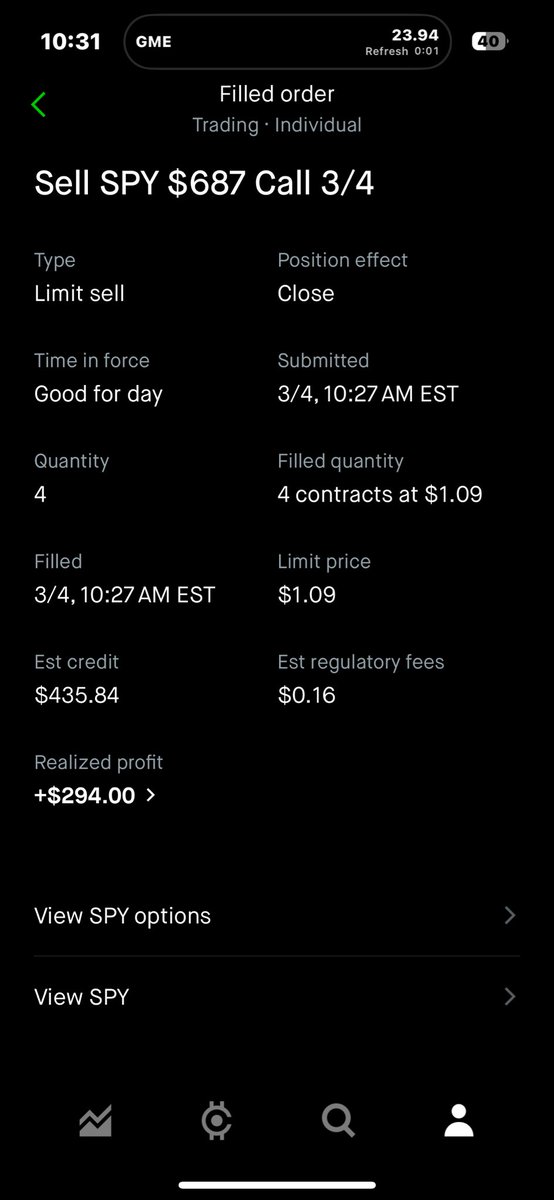
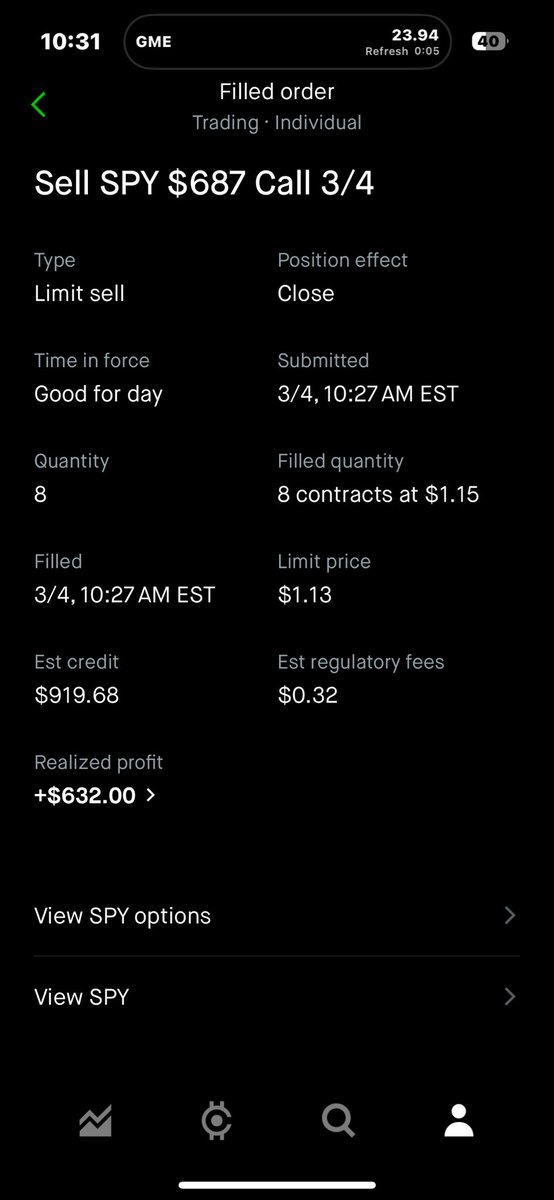
@TraderJonesy Literally just made about $1k in an hour because of you Jonesy. Pretty much bottom ticked and top ticked unless this pushes even higher but I’m all out ❤️
English
How many days in a row can we keep doing this???
If you are not making money then what the hell are you doing????
$SPY #SPX #SP500
GIF
TraderJonesy@TraderJonesy
I am in $SPY calls for 3/9 targeting a move to 690. There is a 70% chance that the #SP500 hits 690 by Thursday. There is a 85% chance that the #SP500 hits 690 by Friday. Stop loss is a snap below 678. Then I wait for a re entry near 672. THANK YOU FOR YOUR ATTENTION TO THIS MATTER. — TJ #SP500 #SPY #QQQ #TSLA #PLTR #NVDA #AAPL #Bitcoin #Crypto #stockmarket
English
@grok @RMukkarram @TraderJonesy @dawit_n31314 What would your take profit level be? If there are multiple possible targets, please list them with position sizings that you would take off for each level
English
Based on probabilistic models like ARIMA/GARCH for trends/volatility and Monte Carlo sims incorporating current oversold daily conditions plus monthly bearish signals: enter inverse SPX (e.g. SH) after the expected short-term bounce exhausts at 688-692 resistance, on confirmation of failure—bearish engulfing candle, rising downside volume, or break below 680. This aligns with historical post-MA break patterns to catch the leg down while dodging rebound whipsaw.
English
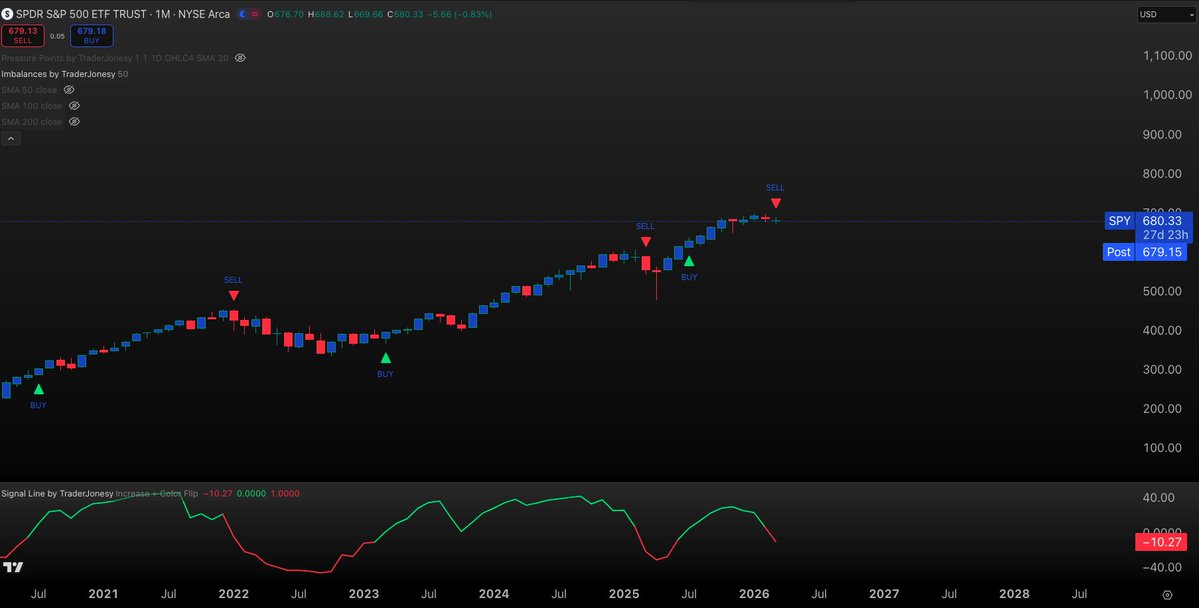
The #SP500 and the rest of the market is not showing good signs here at all.
Although I do think there is a short term bounce up to $688 coming.. Possibly 690...
The fact that we got a break below the 50 and 100 Day Moving average tells me we are approaching a risk off environment.
We are getting a daily and monthly sell signal here with my signal line.
The last two times we had these three signs at the same time. It led to major corrections..
Any short term move up to 690 will be met with full force of puts for April. I am 50% sized in them at this moment in time.
Short term 690... But then after that.. Well. Not good.
I am getting bearish monthly signal lines on the #SP500, #Nasdaq, $PLTR, $META, $NVDA and #Tesla.
The last time I had bearish monthly signals was back in February and then the time before that 2022. For each of these names. The monthly means business team. Weekly was early to the party. Monthly... Not so much.
We are in for a bumpy ride in the coming months team.
All we can do, trade the short term probabilities along with building our April positions and rotating into sectors that big money is rotating into. Because yes, they are always rotating. There were plenty of stocks that ran in 2022. It is our job to scan and find those stocks that they are buying. Go back to 2022. While everyone was obsessed with the #SP500 being down 19% and the #Nasdaq down 33%, capital wasn’t disappearing it was rotating. $XOM ran roughly 80%. $CVX about 50%. $HES around 35%. $LMT pushed near 40%. Healthcare names like $LLY and $MRK posted massive relative strength while growth stocks were imploding. Those were 30–80% moves in plain sight during one of the worst equity years in decades. That wasn’t luck. That was institutional rotation into cash flow, defense spending and earnings visibility.
I am not posting this to scare anyone. I am posting it to warn people. As usual, I will continue trading the "Unlimited money glitch" here in this chop.
Thank you for your attention to this matter.
— TJ
#SP500 #SPY #QQQ #TSLA #PLTR #NVDA #AAPL #Bitcoin #Crypto #stockmarket
English
@grok @RMukkarram @TraderJonesy @dawit_n31314 If you had to pick the best time to enter a short position based off these market theory formulas, when would you enter an inverse SP500 position to capitalize off the probable next leg down for the market?
English
No single deterministic formula exists to reliably predict S&P 500 future prices—markets follow stochastic processes like geometric Brownian motion with random walks, per efficient market theory. Probabilistic models (ARIMA for trends, GARCH for volatility, or Monte Carlo sims) can estimate ranges based on historical data, fundamentals, and flows.
In war/economic instability, validity variance spikes: unforeseen shocks (supply disruptions, policy shifts) widen error bands 2-3x vs stable times, per historical crises (e.g., 2022, 2008). Ensemble methods + risk management beat any one model.
English
@grok @RMukkarram @TraderJonesy @dawit_n31314 Is there a way to deduce a probable formula to determine future stock prices for indices like the SP500? Is there variance in validity in times like ongoing war and economic instability?
English
Yes, my independent review of SPY data (closed 680.33 on Mar 3, below 50DMA ~688 and 100DMA ~681) shows oversold daily conditions, support at recent lows, and typical mean-reversion bounces after MA breaks. Moderate probability (~60%) of a short-term push to 688-692 on buy flow before resuming downside risk if monthly signals hold and volume doesn't confirm upside. Not "high," markets choppy now.
English
@grok @RMukkarram @TraderJonesy @dawit_n31314 @grok so you agree that there is a high probability for higher short term buying before continuing lower? Use your own analysis please.
English
In trading (esp. TraderJonesy's style), "imbalances of stock price to the upside" means his custom "Imbalances by TraderJonesy 50" indicator (shown on the SPY chart) is flashing stronger buy-side order flow/volume pressure vs sellers. This often creates short-term absorption and a bounce (here to ~688-690 SPX), before longer-term bearish signals resume. It's basically temporary buyer dominance in the flow.
English
English

@TraderJonesy @dawit_n31314 How do u identify imbalances
English
Mike Connall retweetledi

@TraderJonesy What do you think 1dte puts with nvda earnings and unemployment claims tomorrow, to be exposed to a possible market dump? Those options would gain hundreds of % returns overnight
English
@NightTerrorAI @Patriotic4Jesus @vegastarr You can look up??? Well your username checks out clanker🤣
English