
jeremy schwartz
90 posts

From a relative power standpoint.
No.
The biggest losers of this 'war' is
Iran and America.
Saleh~@saleh_76m
@EvanWritesOnX Do u agree with the Chinese professor that the GCC is the biggest loser of this “war” ?
English
jeremy schwartz retweetledi

The tape is broken.
The S&P 500 has confirmed a close below its 200-day moving average today for the first time since May 2025, ending a 214-session streak above that level, on a quarterly options expiry, with four consecutive weeks of losses behind it and an unresolved US-Israel-Iran conflict entering the weekend.
Range expansion has been sustained for weeks. Volume on expiry is heavy.
The primary trend is structurally compromised.
Beneath the technicals, the macro transmission mechanism is equally impaired: Treasury yields have risen sharply across the entire curve since February 27, rate cuts have been fully priced out, and the Federal Reserve is boxed by an oil-driven inflation shock with no capacity to act as a relief valve.
Six conditions Paul Tudor Jones identified before Black Monday 1987 are present.
The regime configuration is possibly the most complete alignment of 1987-analog conditions since October 1987.
The analog is not a forecast. It is a structural warning.
English
jeremy schwartz retweetledi

I’ve been waiting last few months for signs that 3.5 year cycle has topped. We’ve been buyers of dips as models were bullish. It has changed in Feb when I posted that I went mostly cash and now all models I track are now on a weekly sell signal / bear regime.
-The last time we had a similar set up was Dec 2021 and we went defensive before the bear market which positioned us well to be buyers of stocks at bargain prices later in 2022. Now current 3.5Y cycle is peaking/rolling over - time to pay attention.
-I don’t like playing Monday morning quarterback so I try to give you my actionable primary roadmap a few months out and adjust along the way based on cycles, models, technicals etc. Saying something was obvious after the fact doesn’t help anyone.
-Below is my experimental $SPX composite leading indicator which I’ve been working on for several years combining various cross-asset signals. Not meant to perfectly time every micro move but can be used as a confluence for larger trend changes
-In Dec ‘25 I saw upside headfake move (UTAD in Wyckoff terms) in Q1 2026 and then rollover; now with more data coming in it’s suggesting a bigger decline in Mar-Apr - in line cycles/ models / TA
- $SPX is still only -3.4% below ATH so real correction hasn’t even started. When talking heads on CNBC start panicking it will be too late. Not trying to fear monger, just calling it what models are showing. Capital preservation is key.
-I take time out of my weekend to post this to open people’s eyes to a potential significant downside in the market and consider contingency plans. If you find it helpful and want to get more updates - please retweet.

Namzes@Namzes_G
Expecting ‘22 have much higher volatility with a trip to SPY 400 (gap) around mid ‘22. Can’t discount the possibility of back testing pre-Covid highs of 339 if we get some unexpected Fed moves. 339 would be extremely bullish as Fed would reverse tightening & trigger new bull run.
English
jeremy schwartz retweetledi
Iran's target selection in this conflict isn't random.
It's a doctrine designed to produce the specific domestic political conditions under which President Trump stands down.
New memo: The Architecture Attack. Thread below.
English
jeremy schwartz retweetledi

jeremy schwartz retweetledi

Powell / Fed's Emergency Rate Cut on 03/03/26 Full Moon / Eclipse Tuesday? ⚠️⚠️⚠️
This is reminiscent of Powell's Emergency Cut on 03/03/2000.
Why Am I Forecasting This?
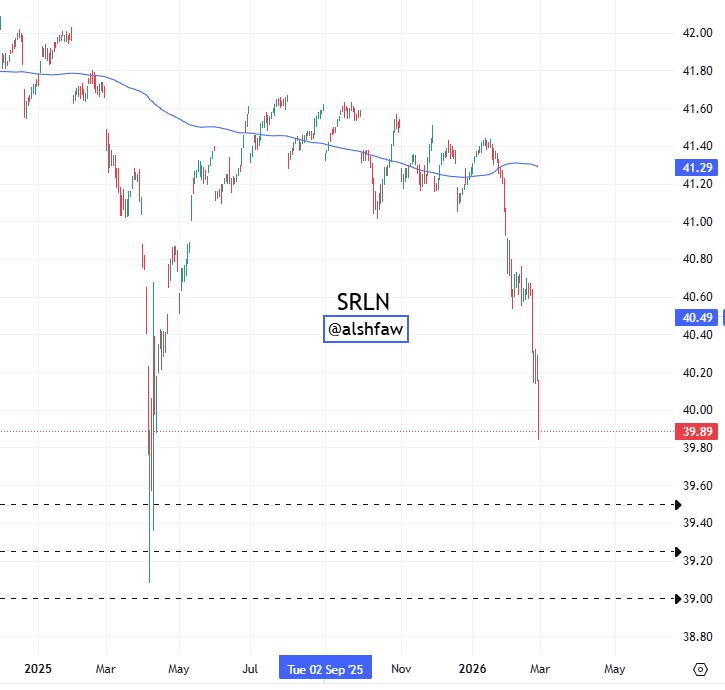
1. Credit swaps are indicating deteriorating financial conditions in private credit. $SRLN ETF heading to levels last seen during the pre-Liberation-Day crash March 2025. See picture.
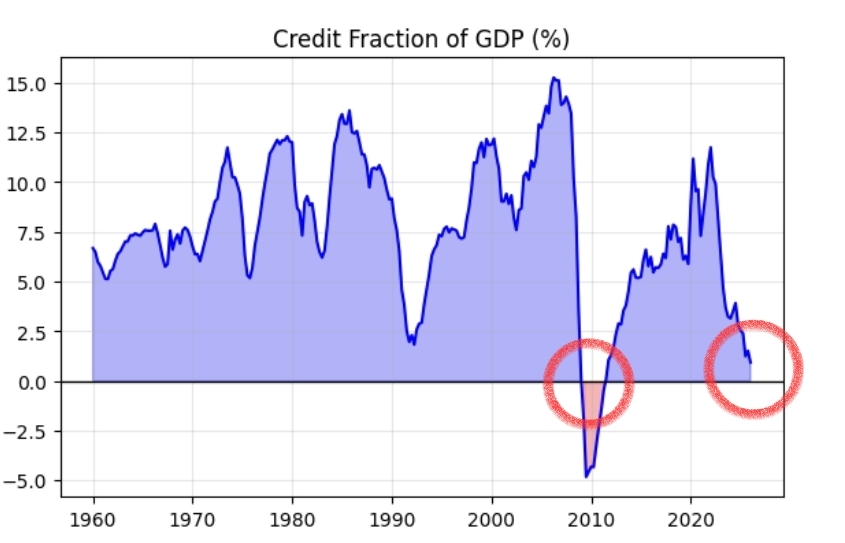
2. Credit Fraction of GDP % approaching levels last seen just before the 2008 GFC. See picture.
3. Bearish Sentiment and Armageddon level puts are already loaded, and Powell can give the Wall Street Casino an opportunity to squeeze hundreds of billions out of them with one short press release cutting the rate. He can even do it today to avoid the symmetry of the 3/3 anniversary, and trap them all.
4. Iran War + Private Credit Risk = Plunge Protection Team PPT must come back. If they come back you will see first hand what "Blow-off Top Engineering" will mean: $720 $SPY
>>> If the Feds do not inject liquidity into the market from early this week, then the risk of a credit event is extremely high. I will then submit to the bears forecast and say it was all by design, but I am skeptical.
Looking at the $SPY $SVIX charts, the market has not put the 2nd shoulder (top) yet, making the Wave5 top from January the first top only. An ABC for a 2nd top is a must. Liquidity must improve, and $BTC is nodding as it also gets its Buy9 heading into March 19th.
How to prepare for this? At what $SPY level the cut may happen based on geometry? All of this, Iran discussion, and more was shared with paid members here:
astrozan.substack.com/p/spy-setup-ne…
This article is so good, I will only unlock it for free reading with 50 retweets by 9pm EST today.
Share & Subscribe, :
$SPY $QQQ $IWM $MDY $RUT $DIA $SDOW $SOXX $SOXS $SMH $NVDA $TSLA $YINN $VIX $VXX $TLT $BTC $GLD $SLV $SVXY
English
jeremy schwartz retweetledi
Iran War 2.0 vs. Iran War 1.0 ⚠️🔑
Some traders with good memory are ready to trade 2.0 like the 1.0 war template, but this is naive.
Iran 1.0 started at the beginning of an impulsive Wave 3 in the cycle whereas Iran 2.0 started at the height of a terminal Wave 5 in the cycle.
A geopolitical shock hitting at the end of Wave 5 is the exact opposite of War 1.0. The wave has no more structural energy to absorb bad news.
This morning I published full analysis of what this means to $SPY going forward, and I also highlighted unique information Numerological Astronomical on the connection between @realDonaldTrump and the Islamic Republic of #Iran. Information you can only find at AstroZan Daily 💯, the article is linked below for paid members. I will however fully unlock this article to become a free read, if I see 30 reposts / retweets of this brief you are reading now.
astrozan.substack.com/p/numerology-o…
The picture shown below was my forecast of a gap-down on $NVDA for Monday, forecasted based on the chart - done before the Iran War started. See key drawdown targets.
Share & Subscribe, :
$SPY $QQQ $IWM $MDY $RUT $DIA $SDOW $SOXX $SOXS $SMH $NVDA $TSLA $YINN $VIX $VXX $TLT $BTC $GLD $SLV $SVXY

English
@ces921 nice chart Craig - wonder who mentioned that yesterday 😄
English
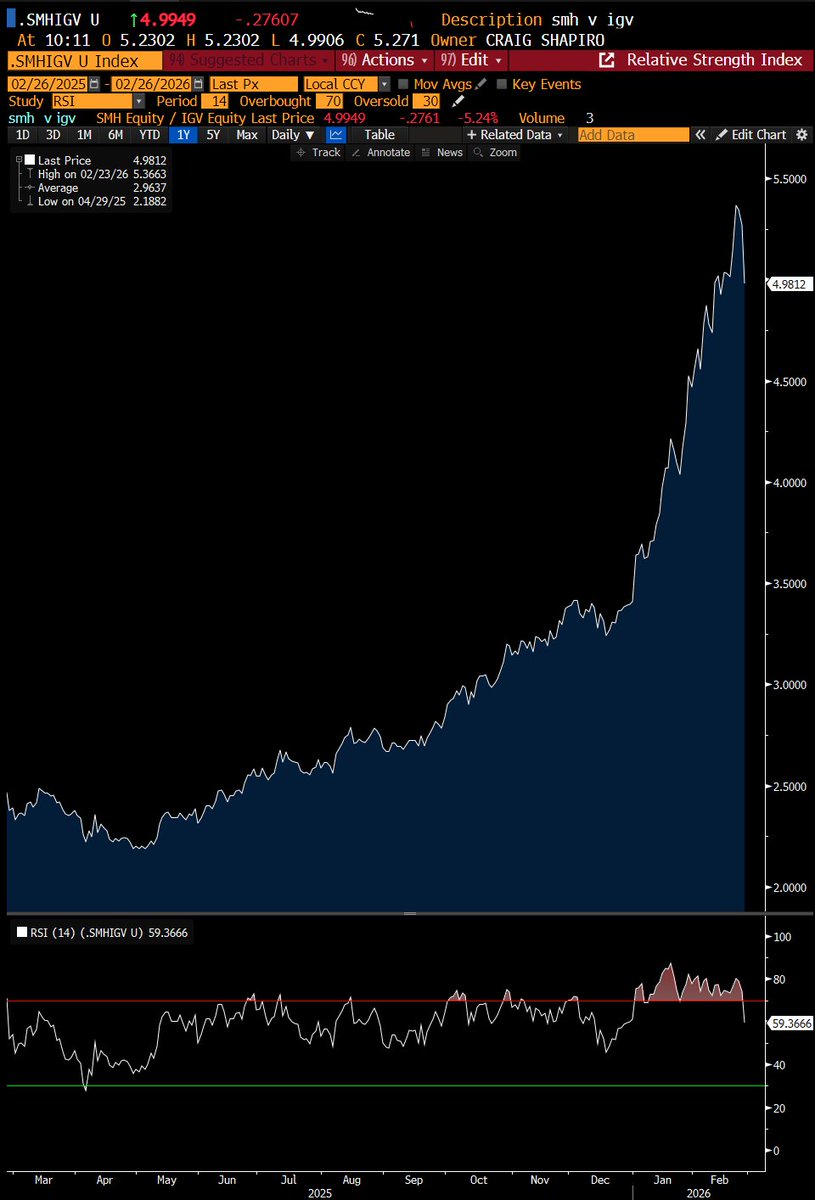
SMH vs IGV - Semis underperforming by close to 600bps today given the CRM bounce with NVDA fail.
Unwind city coming to a theater near you
English
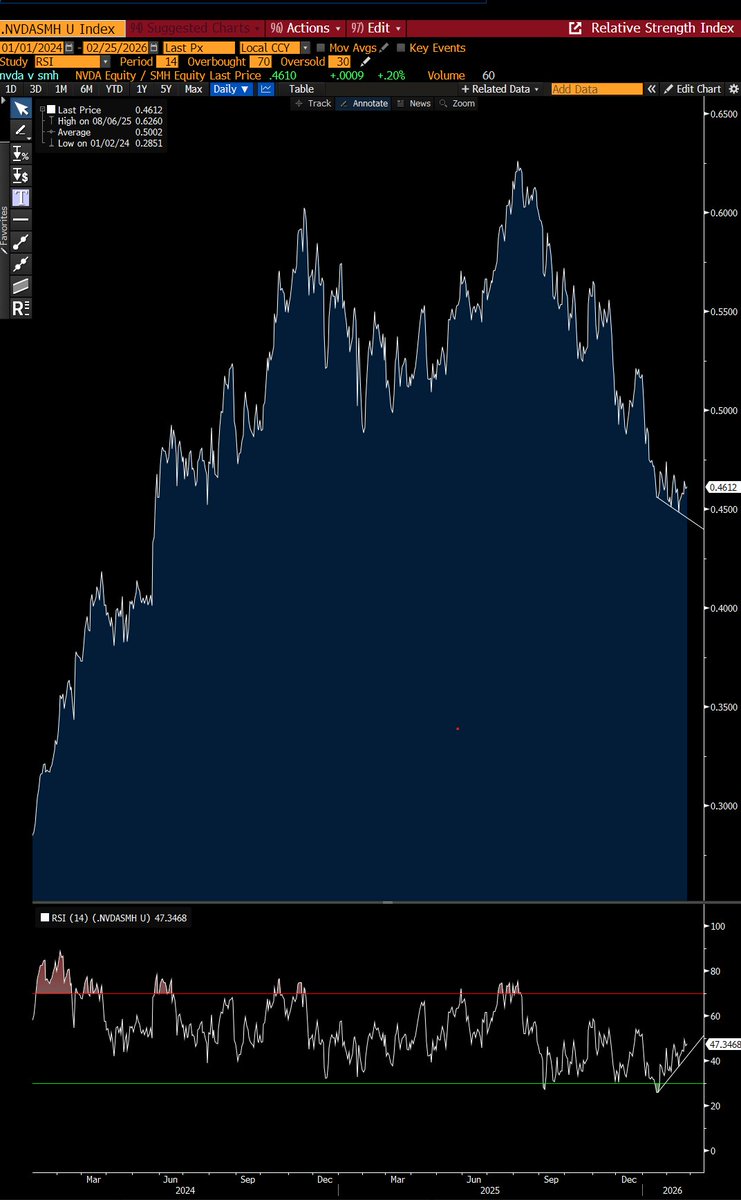
NVDA vs SMH - setting up some potential positive divergences as well
Are folks set up for the NVDA crushes it and gaps higher trade, taking all the market cap with them trade?
English
What Will 2026 Bring?
The only thing we know is certain - volatility.
coreviewasset.com/what-will-2026…
English
@FortuneOptions I think that’s as much a function of how society feels at the moment as anything. When so many people are struggling and don’t see opportunities to improve, they find outlet opportunities. There are many more of those now.
English
@market_sleuth SPY goes ex-div on 12/19 John… that’s the reason.
English

I find myself using the word "unprecedented" in regards to so many assets these days... now it's gold's turn.
coreviewasset.com/what-is-gold-r…
English
@market_sleuth @datruthbomb By October? Probably not, later in year or early next… no?
English


Our weekend Plan was simple:
There is room to $SPX 6,700
Then a decision point:
Hourly Sell Signal or $SPX 6,750.
English
Three-word review: Another dreadful opener. nytimes.com/athletic/66082…
English
It's all about liquidity...
coreviewasset.com/liquidity-liqu…
English
@Bluedeerc i always appreciate the confidence in a position, but i'm just not seeing what you are, absent a bull shock event tonight... if bulls take out 5700ish ES it's all yours
English
