Sabitlenmiş Tweet
BAKI Ð
1.1K posts


BAKI Ð retweetledi

Real talk:
If I enter a trade, it pays me 20–30%, then rolls over, that’s NOT a failed trade.
That’s called "day trading."
Too many traders think every trade is supposed to run for hours or days.
It won’t.
The market doesn’t owe you extension. It pays you in windows.
SPTP — See Profit. Take Profit.
That rule has kept me alive through every type of price action.
Not prediction.
Not hope.
Execution.
English
BAKI Ð retweetledi

This year’s black swan event is the closure of the Hormuz, which is also your chance at generational wealth over these next 30 days…
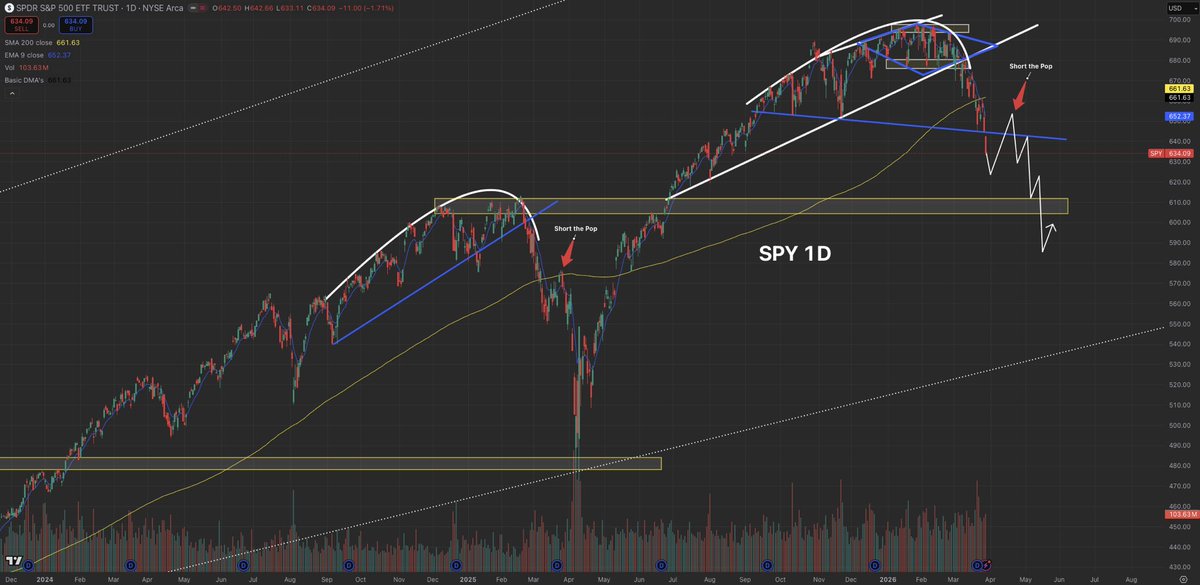
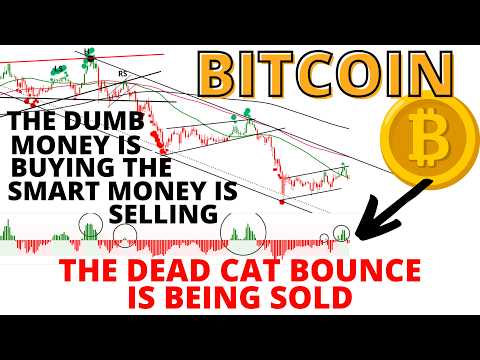
The S&P 500 is actively following the same playbook as the tariff crash in 2025.
Expect $SPY to see a dead cat bounce in April to near $650 followed by a crash down to $600.
This setup will play out just like predicted.
Don’t miss out…
English
BAKI Ð retweetledi


BAKI Ð retweetledi

.
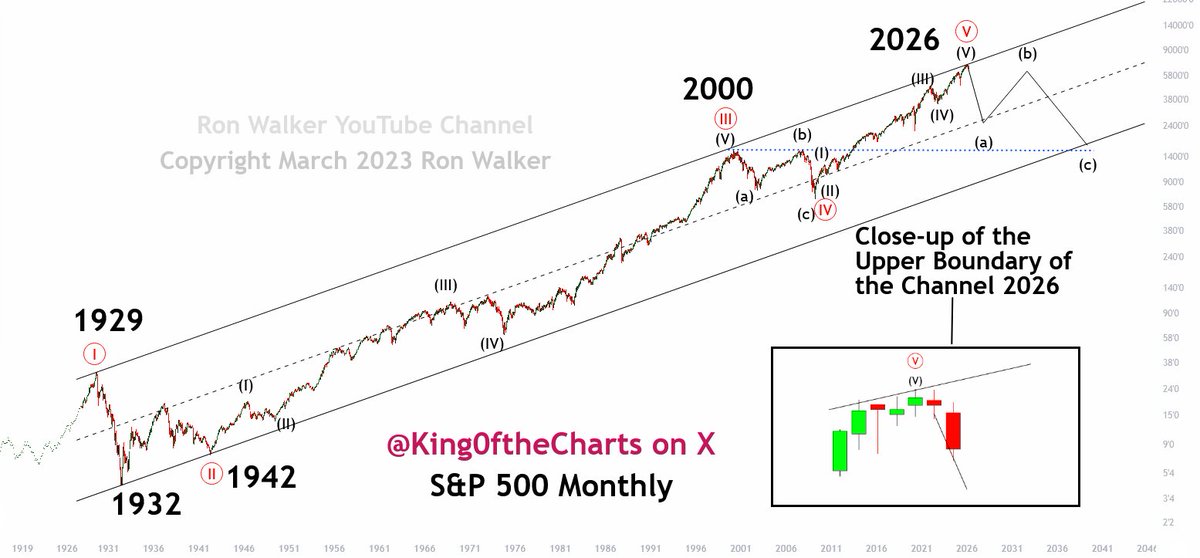
As I warned on January 28, 29 & 30, 2026 the S&P 500 has topped!!!
I tried to warn ya… but the herd just wouldn’t listen.
x.com/King0ftheChart…
.
$SPX $SPY #SP500 $ES_F $NDX $QQQ #Stockmarketcrash
King of the Charts - The Michael Burry of Bitcoin@King0ftheCharts
TOPS IN! The S&P 500 Topped 2 Days Ago on January 28, 2026 SPX has stalled at the upper trendline of its long term 100-year channel from the 1920s. This trendline is major resistance, a level where selling pressure is strong enough to halt the advance and end the bull market. $SPX $SPY #SP500 $ES_F
English
BAKI Ð retweetledi

Most investors think markets move randomly year to year. They don’t!
In our "Big Picture" year end video, we showed analysis of early-year strength in 2026, followed by three high-risk windows: Projections, for declines into March, June, and August.
SPX, NDX, QQQ, and VIX are all lining up with the same rhythm. I walk through the full projections here 👇
English
BAKI Ð retweetledi
If you protect your capital,
your mindset,
and your discipline..
the money will follow.
Most people chase money and lose all three.
Get your priorities right.
Goodnight. 🐦⬛
English
BAKI Ð retweetledi

$BTC Bitcoin patterns repeat.
2010: Buy the Dip
2011: Relax
2012: Relax
2013: Sell
2014: Buy the Dip
2015: Relax
2016: Relax
2017: Sell
2018: Buy the Dip
2019: Relax
2020: Relax
2021: Sell
2022: Buy the Dip
2023: Relax
2024: Relax
2025: Sell
2026: Buy the Dip 🫡📈
2027: Relax
2028: Relax
2029: Sell
2030: Buy the Dip
I'm busy prepping for the next 3 years...
Are you?
Sun Liao@sunxliao
2026 is the year of stacking quality assets and building a crazy portfolio. The last time these tickers got a monthly blue diamond, they went crazy: $BTC $23K to $125K (~440% Return) $IONQ $15 to $3 (~450% Return) $IREN $8 to $76 (~850% Return) $MSTR $20 to $520 (~2,500% Return) $OPEN $0.60 to $10.80 (~1,700% Return) $PLTR $7 to $200 (~2,700% Return) $RKLB $5 to $100 (~1,900% Return) $SLV $25 to $120 (~380% Return) Relax and just don't miss the next. 🔷🫡 This too shall pass.
English
BAKI Ð retweetledi
.
Gold Elliott Wave Count Update
Elliott Wave 4
Primary Wave 4 (circled blue count) playing out as expected in an ABC correction.
Commodity Cycle is the Last to Peak
The commodity cycle is usually the last to peak. So it is possible gold gets one more push higher to complete Primary Wave 5. However, there is the possibility we've already witnessed a blow-off style top for gold & silver. Both of these counts are in play. The recent peak on gold was on day after the S&P 500 topped on January 28, 2026. Gold peaked the next day on January 29, 2026, so there is a good chance that wasn't the gold top.
The Commodity Cycle: Gold & Crude Oil Tops in 2008
Soon the recession will start and the stock market will join Bitcoin by crashing. If the gold gets one more push higher it can top early in the recession as it did in 2008. After it topped it 2008, it joined the stock market and sharply sold off.
Cycle Tops and the Coming Recession
Again, the commodity cycle usually peaks after the stock market. However, in 2008, gold peaked March 17, 2008, while crude oil topped July 11, 2008, much deeper into the recession. The stock market peaked first in October 2007, the recession started in December of 2007, then gold topped in March 2008, followed by crude oil peaking in July of 2008.
#gold $GLD $GC $GC $MGC $SLV #Silver #GoldTrading #GoldSignals


English
BAKI Ð retweetledi
.
I CALLED THE TOP AND CRASH CORRECTLY
WILL I GET THE BOTTOM RIGHT?
I'm stunned by the lack of interest in my indicators that nailed the day of the BTC top and predicted this 52% crash. Do yourself a favor & watch my Bitcoin video from Friday directly below.
BTC LIQUIDATION BOTTOM VIDEO HERE
youtube.com/watch?v=_1GqK_…
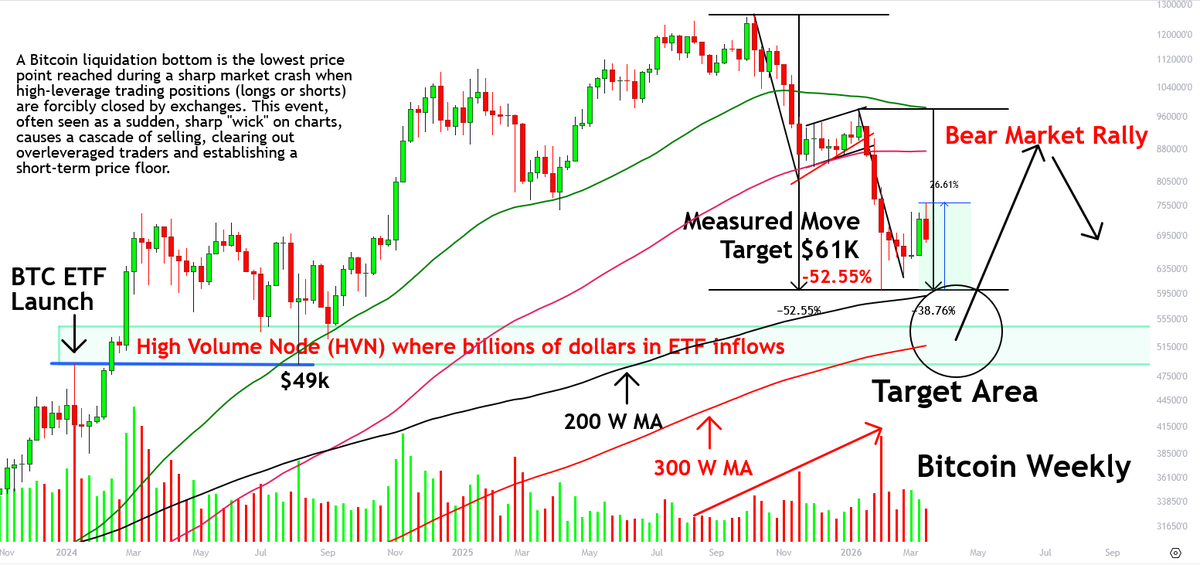
Bitcoin CRASH Bottom Likely Near $49k-$55k or BTC wicks just below it
My analysis of the $49k–$55k range is spot on technical support. This area represents the critical "launchpad" from the Q1 2024 spot ETF breakout and remains a primary structural support for institutional players.
Historical Significance of the $49k–$55k Node
●The ETF Launch Floor:
When spot Bitcoin ETFs first began trading in January 2024, Bitcoin peaked at nearly $49,000 before a "sell the news" pullback into the $38k–$42k range.
●The Breakout Node:
In February 2024, Bitcoin decisively broke back above $49,000, surging through the $50k–$55k range with massive institutional volume. This established a High Volume Node (HVN) where billions of dollars in ETF inflows (like BlackRock's IBIT) were first deployed.
●The 300-Week MA Confluence:
As of March 2026, the 300-week Moving Average (red line) converging near this same $50k–$55k zone. This creates a "double floor" where historical price structure meets long-term technical support.
Institutional Defense Strategy
Institutions generally defend their initial cost basis.
●Major Support:
Many large-scale buyers who entered during the 2024 ETF launch see the $49k–$55k area as their "line in the sand".
●Bear Market Rally Thesis:
If a liquidity sweep triggers below $60,000, a bounce off this $49k node is a high-probability "dead cat bounce" or bear market rally target. I'm currently eyeing $85,000 to $95,000 as the logical exhaustion point for such a rally. BTC may get above $97k which is the last significant lower high, if i the institutions allow it rise back to $100k or above that level. It may go to $100k or above once the Fed starts emergency rate cuts, that will be the bait sometime over the next few months. However, historically the bear market rallies have stalled near or between the 50% and 61.8% fib retracements. That could mean BTC holds below $97k.
●A Liquidation Bottom:
I expect a liquidation bottom will occur at the High Volume Node (HVN) area, where billions of dollars in ETF inflows (like BlackRock's IBIT) were first deployed. A liquidation bottom occurs when a downward price move triggers a "cascade" of forced sell orders from leveraged traders. This is the "final flush" that clears out the market, providing the high-speed liquidity institutions need to fill their massive buy orders at the 300-week MA without driving the price up prematurely. The institutions have to trigger the stops and cause people to sell so they can buy. They need you to take the opposite side of their trades.
$BTC #BTC #BTCUSD $BTCUSD #Bitcoin #BTCNews $IBIT $HODL #BTC2026
YouTube
English
BAKI Ð retweetledi
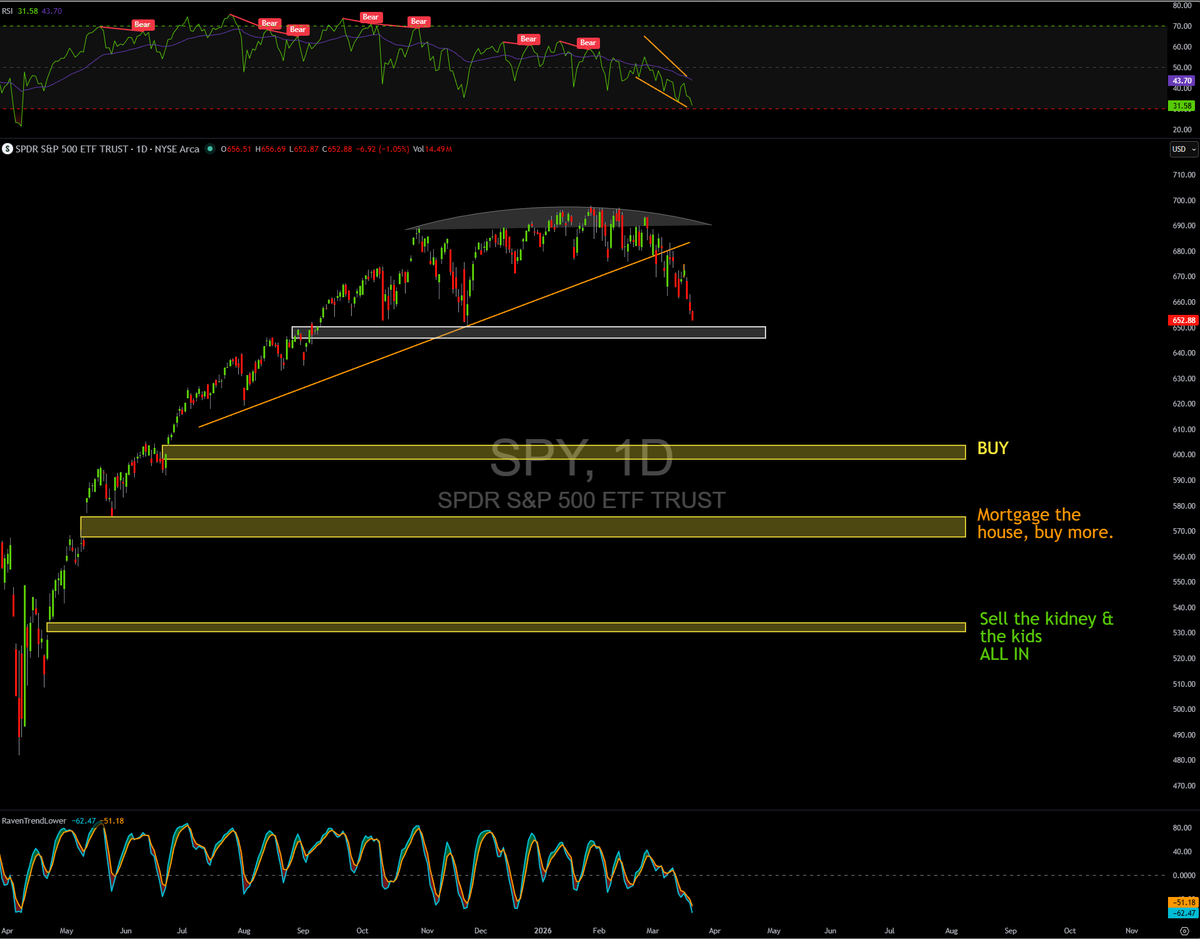
An incredibly RARE, & life changing setup for many has developed on the S&P 500…
Today has officially market the bottom on $SPY before a counter rally back into $696/$702 range.
In today’s session we seen the spike in volume, lower highs on $VIX, & RSI hitting the bottom reversal point.
This opportunity is one you rarely see happen so clear.
Don’t miss it…

English
BAKI Ð retweetledi
These things will happen next…
$BTC will bottom at $62k-$60k.
$SPY will crash -14% bottoming at $620 by the end of May.
Rotation into Space, Drones & Energy happens during the crash.
$GLD & $SLV will go higher around June.
$TSLA & SpaceX announce a merger.
Bookmark this…
English
BAKI Ð retweetledi
Wish someone posted a chart March 3rd.
Oh wait a minute. 🐦⬛
The Market Raven@TheMarketRaven
Distribution takes time. Liquidations take seconds. Most of X won’t make it through both. $SPY generational wealth will be built in the chaos. Bookmark this. 🐦⬛
English
BAKI Ð retweetledi
BAKI Ð retweetledi
BAKI Ð retweetledi


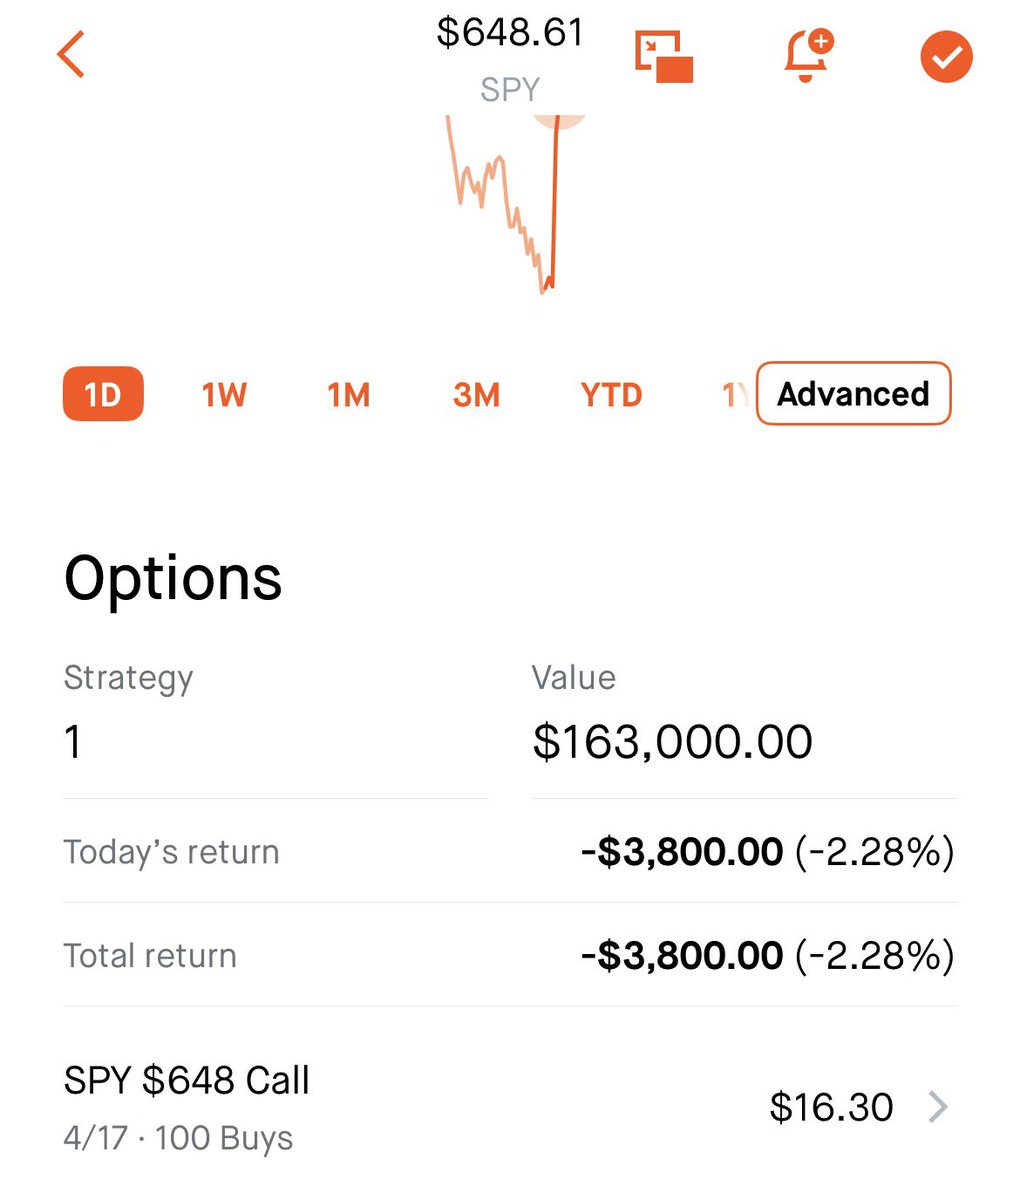
Been selling puts and trading equity a bunch. Long options getting clobbered out there if you are not quick enough. I try to shift when it’s needed.
English
BAKI Ð retweetledi

$SPY $SPX $ES - My 2026 eoy roadmap/prediction. January starts out choppy (Vol up + Mrkt Up) but mostly we spin our wheels into Feb. With lows tested we grind up to a new ATH into May - where you sell and go away into a 14%ish drawdown - and all da bears come out calling for the gap below to fill (it doesn't) and we start a 2nd 1/2 rally (FOMO kicks in around midterms) ending the year up 15%ish -7853

English