Here's a Pandas cheatsheet for interviews.
👋 Let's explore together ↓
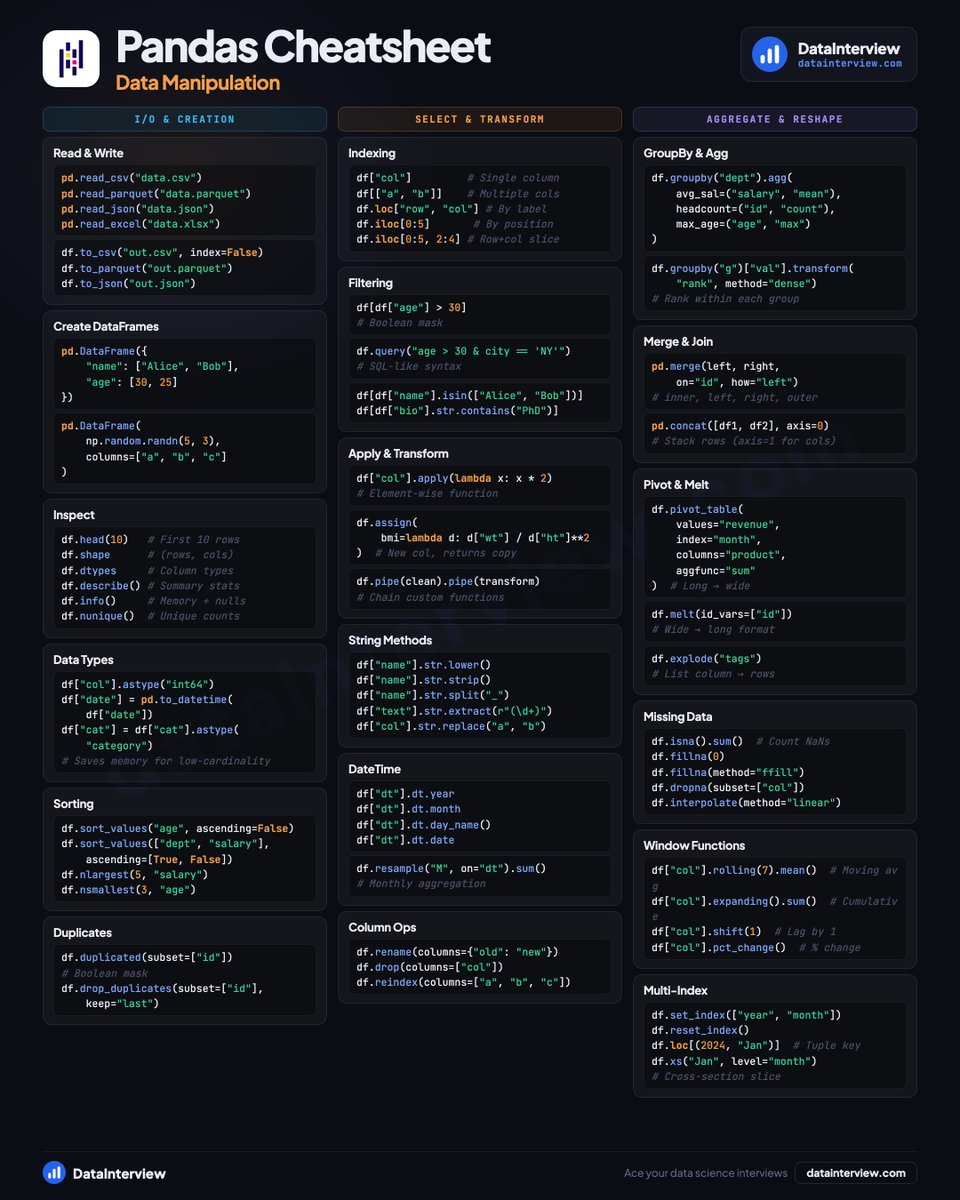
📥 𝗜/𝗢 & 𝗖𝗿𝗲𝗮𝘁𝗶𝗼𝗻
• Read CSV, Parquet, JSON, Excel
• Build DataFrames from dicts or NumPy
• Inspect with .shape, .dtypes, .describe()
• Cast types, sort values, drop duplicates
🔀 𝗦𝗲𝗹𝗲𝗰𝘁 & 𝗧𝗿𝗮𝗻𝘀𝗳𝗼𝗿𝗺
• loc vs iloc indexing
• Boolean masks and .query() filtering
• .apply(), .assign(), .pipe() chains
• String methods, DateTime accessors
• Rename, drop, reindex columns
📊 𝗔𝗴𝗴𝗿𝗲𝗴𝗮𝘁𝗲 & 𝗥𝗲𝘀𝗵𝗮𝗽𝗲
• GroupBy with named agg
• Merge, concat, join
• Pivot tables and melt
• Handle missing data (fillna, interpolate)
• Rolling windows and pct_change()
• Multi-index slicing with .xs()
Save this for your next interview.
👉 Land Data, Quant, AI jobs on datainterview.com
English