AIms
63 posts

INTRADAY NOTE
Quick intraday thoughts, no fin adv:
How to use greeks and distribution and implied PnL...?
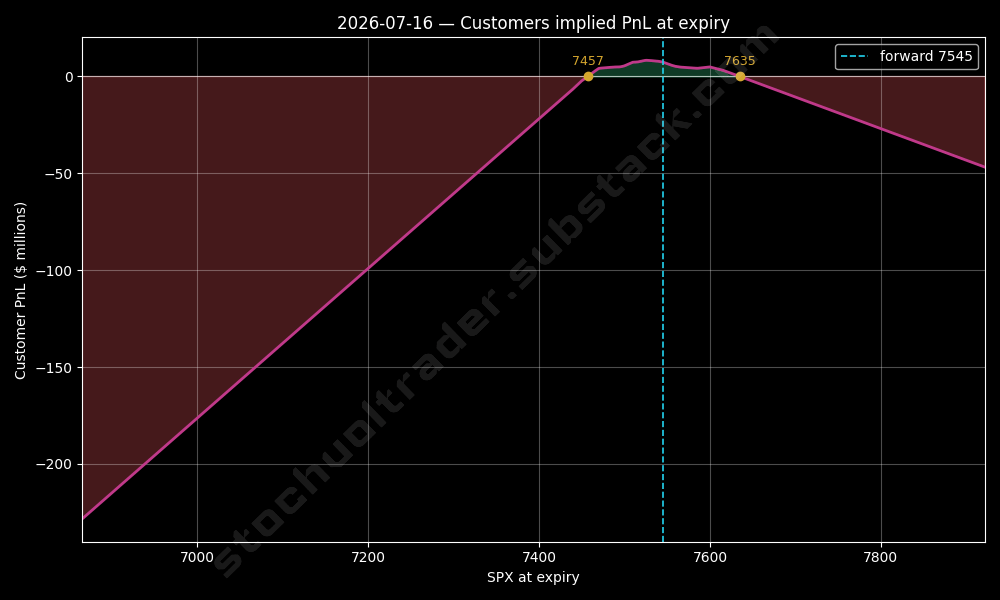
Customers implied PnL forms a strangle positioning between 7457 - 7635 $SPX, with max gain at 7530/35 $SPX
The priced in range is ±~89 pts, ATM IV is at 18.67%, meaning a 1.18% daily sigma range, that coincides with the implied PnL’s breakevens. The daily mean, mode, forward is expected at 7545 $SPX
(The implied distribution tolerates ±99 pts range, due to the fat put wing)
Dealer gamma is within the whole range, it’s peak is at 7420/50 $SPX zone, that is exactly the June FOMC lows that is structurally and sentiment-wise very important (see, my weekly post). Market is about to defend it, shadow gamma is even a stronger downside momentum absorber there. Market is going against the left -tail.
Market is expecting a calm, low RV day around 7545 $SPX within the range (coincidencing with the implied opening), and heavily selling vol beyond 7500 $SPX
$ES $ES_F fair basis is +42.61
$SPX downside protection is very expensive thats why they short it.
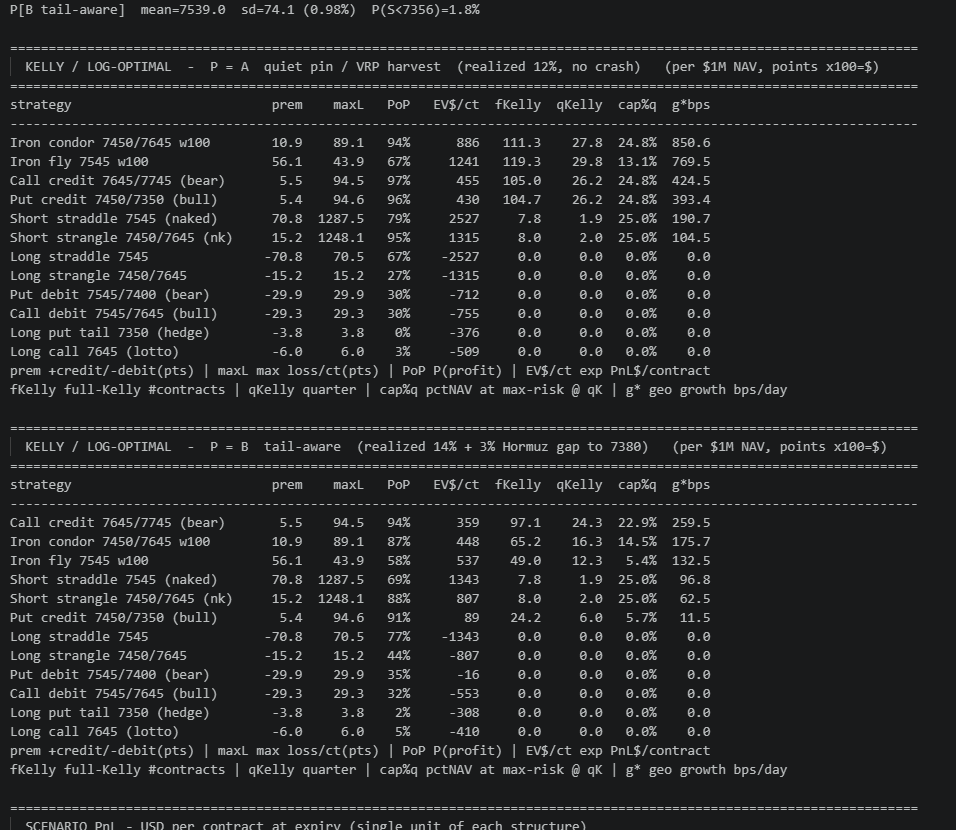
Based on my code, for me the main trade is to sell 0DTE SPXW 7645/7745 call credit spread Max risk 94.5 pts, b reakeven 7650, sizing is ~12 spread / $1M ≈ 11% NAV at max risk. (I have OTM $TLT puts, as you know, for vomma and vega trades)
Or: sell 0DTE SPXW iron condor 7450/7645 $SPX, 100-wide, credit ~10.9 pt, sizing: ~14/$1M (~13% NAV max-risk)
Pivot for $ES $ES_F stays 7600 as said in the weekly. First upside resistance is at 7630 and above this reversion can be expected. To the downside 7570/60 is the downside pivot, where I’m still a buyer, but if it breaks, market will go to 7510/20
have fun😘

English
Why does it seem like oil hit an upside resistance while the war is sharply re-escalating, just as I forecasted?
This is because both oil RV and IV (OVX) are rising alongside vol-of-vol. And vol-target sizing models dictate that as volatility rises, managers don't need to hold as large a position to hit their return targets, meaning they mechanically sell. And since OVX remains above pre-February 25 levels, this re-escalation rally hasn't received as much buying support as it would have in a lower vol environment. This is what I call a VaR squeeze. It only snaps if vol gaps faster than the price trends, which requires a major catalyst that currently isn't present.
However, the selling will necessarily push volatility down mechanically, which in turn will thicken the right tail for the post-midterm period. Factor into this that oil, being a commodity, always reacts to immediate developments. Buyers don't care what happens 8 months from now; they care about what price they can get their hands on it for today.
That's why the price of oil isn't going up yet. But I emphasize this often: even though I am heavily long oil, this is not a mid-term trade; it's a long-term trade. Things will really kick off after November, when the first wave of the negative supply shock generated in February finally hits us. The first breezes of this will show up in the CPI as early as September. In the PPI, maybe even in August.
The latest PPI print didn't come in low because disinflation is happening, but because energy prices plummeted in recent months. It's similar to what I wrote yesterday about wage inflation and shelter regarding the CPI, except you guys can't be bothered to read what I write.
Core PPI was +0.2 MoM, meaning the headline ex-energy would have been positive; the entire negative sign was dragged down by a single component: energy. That's why I wrote to my paid subscribers in my daily post that the implied daily left-tail oddly increased after the PPI print, because they are hedging Warsh.
Warsh sees it too—look at Core PPI in recent months: Jan-26 +0.831 (hot), Apr-26 +0.704 (hot), May-26 +0.087 (soft), Jun-26 +0.200 (back to firm). Services in June were +0.141, flipping positive from May's -0.057. The teal bars in the chart have been the large, stable positive backbone all along — this is the persistent, wage-driven services inflation that just won't quit. In other words, disinflation is a mirage: it's energy-driven headline noise, not a softening of the core.
The core-string is not uniformly soft, meaning the 'transitory look-through' risk I outlined is smaller than I thought, because the PPI-core is holding up. What's more: PPI-core feeds into PCE (through health-care and portfolio-management channels) — a firm PPI-core is more hawkish for the Fed's preferred gauge than the headline suggests. And this reinforces the trade I shared with you guys here yesterday, only you're too lazy to read it amidst all the scrolling.
You'll grok it eventually right?...
#oil #stockmarket #volatility $SPX $OVX $GLD

Alma@alma271828
📍Mark this! While the market waits for context—namely, #Warsh—here is a word on the #CPI and my yields trade... The energy sector shaved −0.437 points off the headline index, with gasoline alone accounting for −0.394 points (despite having a weighting of only 4.25%). If we exclude energy (and food), core inflation (ex-energy) was bang on 0.0%. The heaviest-weighted component is housing. Shelter sits at 35%, with OER making up 25.7% of that. Due to the autumn 2025 government shutdown, the BLS did not collect data in October and simply rolled previous figures forward—this is known as carry-forward imputation. (Note: Since mid-2025, due to funding shortages, the BLS suspended data collection in entire cities like Buffalo, Lincoln, and Provo. This data is now estimated via models (imputed), which has increased both the noise in the data and the margin of error, with the standard error at 0.04%.)Consequently, the April 2026 data collection yielded an atypical average—annualized to a single month but actually covering a much longer period. This mechanically and artificially suppressed rent inflation to a historic low. Similarly, the −7.4% YoY drop in health insurance is the byproduct of a backward-looking, technical calculation (the retained-earnings method). It does not reflect actual, current insurance premiums, yet it will continue to drag down core services inflation for months. The market is currently lulled into a false sense of security by the "disinflation" narrative, having fully priced in the June data. However, oil prices have already bounced back, and the distortion in the housing data will soon correct itself for technical reasons, potentially leading to a "hotter" inflation read once again. When the July data is released (on August 12), the market may be forced to confront the reality that inflation hasn't cooled nearly as much as believed, which could trigger significant market turbulence. Quick calculation Because gasoline prices were still low in early July, the monthly average for July is expected to come in lower than June's. As a result, despite the spot price rally, the gasoline component will remain a negative (downward-pulling) contributor in July (by roughly −6% in the base case). My expectation is a bifurcated picture for the July CPI on August 12: 1) Due to the downward pull of gasoline's base effect, headline inflation will largely stagnate (between −0.04% and +0.05% MoM), and the annual rate could slip to ~3.4%. On the surface, this will paint a reassuring, dovish picture. 2) Beneath the surface, however, core inflation—which provides a cleaner signal—could re-accelerate (hitting ~+0.22% MoM, and potentially rising from 2.6% to 2.7% YoY). This is because the factors that skewed the June data to the downside (such as the statistical anomalies in housing data and the drop in auto insurance) will normalize. The deceptively low headline inflation will lull the market to sleep, sustaining the complacent narrative of "ongoing disinflation." Then comes August OpEx (options expiration). The market's order books will be thin and vulnerable, with low liquidity. By this point, the late-July and August oil price rebound will be fully baked into the monthly averages. The base effect will flip, as the August average price will heavily exceed the low July average. The Result: The market receives a hot inflation report that confirms the flare-up in energy prices. This will deliver a shock to the system. But the real warning sign will be the spike in core inflation lurking beneath the calm surface on August 12—just 9 days before a highly vulnerable OpEx. I wrote about this back in May. THE TRADE As you know, I'm long $TLT puts at 10-20 deltas, and buying more. But for what tenor? The best way to play the rise in bond yields is through deep out-of-the-money (OTM) put options. The MOVE index is currently very low, sitting at the bottom of its range, meaning vol is cheap. When yields spike, MOVE will go to the 150s. My deep OTM put profits from the drop in bond prices, but it pays out massively from the expansion in volatility and the vol of vol. Since it is difficult to pinpoint the exact day yields will spike, short-dated options will just get eaten alive by theta. Therefore, I am executing a ladder strategy: 1) Core position is a 4-6 month exposure: This covers the August vulnerability, the September inflation bounce, and the year-end deluge of US Treasury issuance. When the option has only 6-8 weeks left to expiration and theta decay starts to accelerate exponentially, I roll it: I sell it and buy a fresh 4-6 month option. 2) Vega trade at 9-12 month exposures: This is a bet on an upside mean-reversion in the MOVE index. This trade can be executed at the retail level via the $TLT ETF, or at an advanced level using $ZB / $UB futures options or even OTC swaptions. With $TLT currently trading around $84.50, a 100-basis-point (1%) spike in yields would trigger a roughly 15% drop in $TLT (down to the $72 neighborhood). Buy $TLT put options with a $70–$75 strike (deep OTM) and a 4-6 month expiration. THE RISK The risk is the "benign grind-down." If the economy slows down—triggering a growth scare—a flight-to-quality will drive capital into bonds. Yields will fall, the Fed will cut rates, and the MOVE index will remain suppressed. However, as I've previously mapped out regarding rhogamma and the rho premium embedded in rate expectations: The market is operating in an inflationary/fiscal regime. The primary fear is that inflation reignites (driven by an energy catalyst), the Fed's hands are tied, and the Treasury market revolts (yields up). In this regime, the equity and bond markets sell off hand-in-hand. "Good news" for the economy is actually "bad news" for the market because it guarantees higher interest rates. This holds true above 7008 on the $SPX. Below that level, however, the flight-to-quality kicks in. In that scenario, your Bond Put bleeds to zero, while your equity put would print big returns.
English
☝️Listen...
When analyzing the liquidity structure, it is not enough to simply define the vwap, poc, etc. ranges.
We must also understand what sentiment/narrative was behind the locally established successful auction. Then, we need to look at what the forward-looking positioning, which can be read from the options, assigns to these ranges.
Currently, the most important short-term sentiment barometer is the 'peacdeal lows to June FOMC lows' range, which is 7265 - 7400 $SPX, and its geometric mean is 7332
Since 7-10% of the current rally was born out of inflation and dollar weakening, the market needs to know whether it can count on the erosion of real interest rates in the near future or not, as inflationary pressure is increasing, and alongside this, due to the Iranian situation, the Chinese administrative blockade at the first island chain, the threat to Taiwan (think of $TSMC ...), and the events in the Sea of Azov, a very serious and irreversible negative supply shock is approaching the Western economy.
The market knows this, which is why it wants to accumulate increasingly more nominal dollars, as it is betting on deflation later on.
The range I have designated poses exactly this question to the market: "does it believe that monetary policy will remain supportive?"
...this is because the erosion of real interest rates is a hidden QE, and dollar weakening and inflation mechanically push equity prices higher, as I have been saying for months.
This week, we have #CPI and Warsh on Tuesday, and a #PPI report on Wednesday.
The SPX/yields beta has risen short-term compared to previous levels. It is still negative, but the decrease in its absolute value means that even a hot inflation print will not be interpreted by the algorithms as devastatingly bad as it otherwise could have been. This is supportive, this is what I call the 'Bessent put'.
On the other hand, we know that the admin cannot afford bad inflation numbers... yet. The midterm is more important than anything to Trump, because he is playing a dangerous geopolitical poker game, and his time is limited. The East knows this, therefore it will increase inflationary pressure.
- But what does the market think about this into #opex?
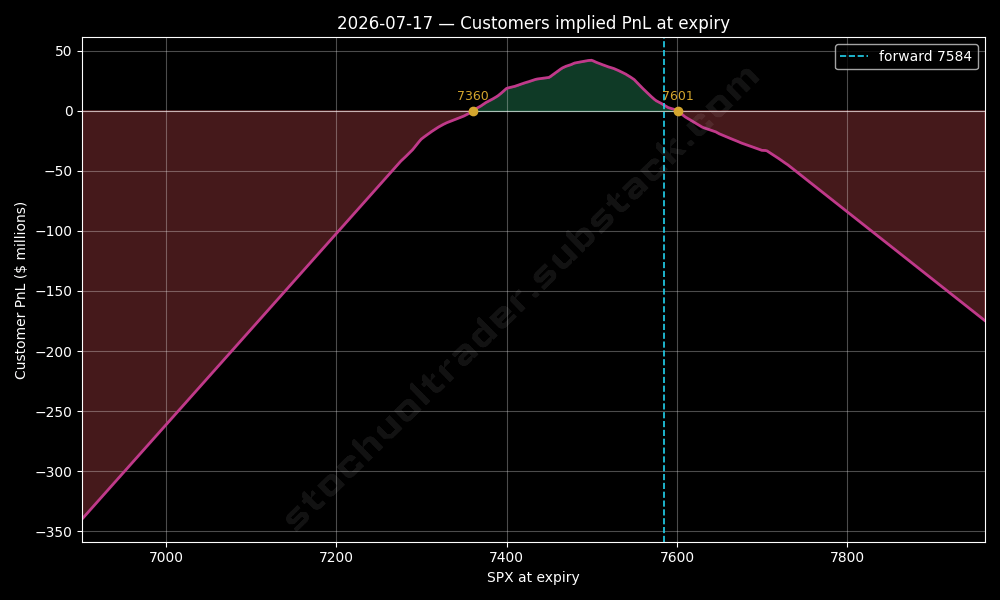
If we look at just the shadow gamma from Friday's OpEx positioning, you can see that it forms a massive wall below 7500 all the way down to 7400. And the implied PnL tolerates moves down to 7360; furthermore, it shows an asymmetric short strangle PnL, which heavily offers downside volatility. (The vomma and zomma dealer exposures also indicate downside realized vol absorbtion, and a net upside grind bet.)
Furthermore, if I project the expected SPX/vol correlation and volatility expectations forward, I can project the expected min/max index levels from this. These also asymmetrically well supply the downside relative to the upside.
So the market is saying that in the worst-case scenario we will get a good buy-the-dip opportunity in the Tuesday-Wednesday window, but they are not afraid of the structure breaking to the downside.
Everything is consistent.
As I wrote in May, June is not dangerous; rather, it was from the post-July opex period that the market started pricing in serious downside risk, but even that only moderately down to 7k (which was the first successful auction point after the short squeeze following the oil panic, when I indicated long SPX and short oil backwardation here), while upside targets are placed at 7700/800 $SPX into September.
Until the midterm is over, no structural break is expected. The admin will do everything in its power to hold last August's levels, which was also the bottom of the selloff following the outbreak of the Iranian war.
This level is the meassure of confidence that the admin is able to handle the negative supply shock.
I described everything in much more detail in my post, with levels and trading ideas.
Link in bio😘



English

AIms retweetledi

AIms retweetledi



AIms retweetledi

Just had a 10-minute walk in the sun, and now I’m just sitting on my balcony with a warm cup of tea—today’s small, quiet joy hits different.

English

AIms retweetledi


AIms retweetledi

Lost in the soft piano notes, let the melodies wrap your tired heart in warmth—this is the kind of music that turns a quiet evening into a gentle escape.

English
AIms retweetledi