
Army Brat 🇮🇳
2.7K posts

Army Brat 🇮🇳
@devs1165
Army Brat | Computer Science Engineer, believes in console.log || print | Interested in Geo Politics
Katılım Mayıs 2015
235 Takip Edilen97 Takipçiler

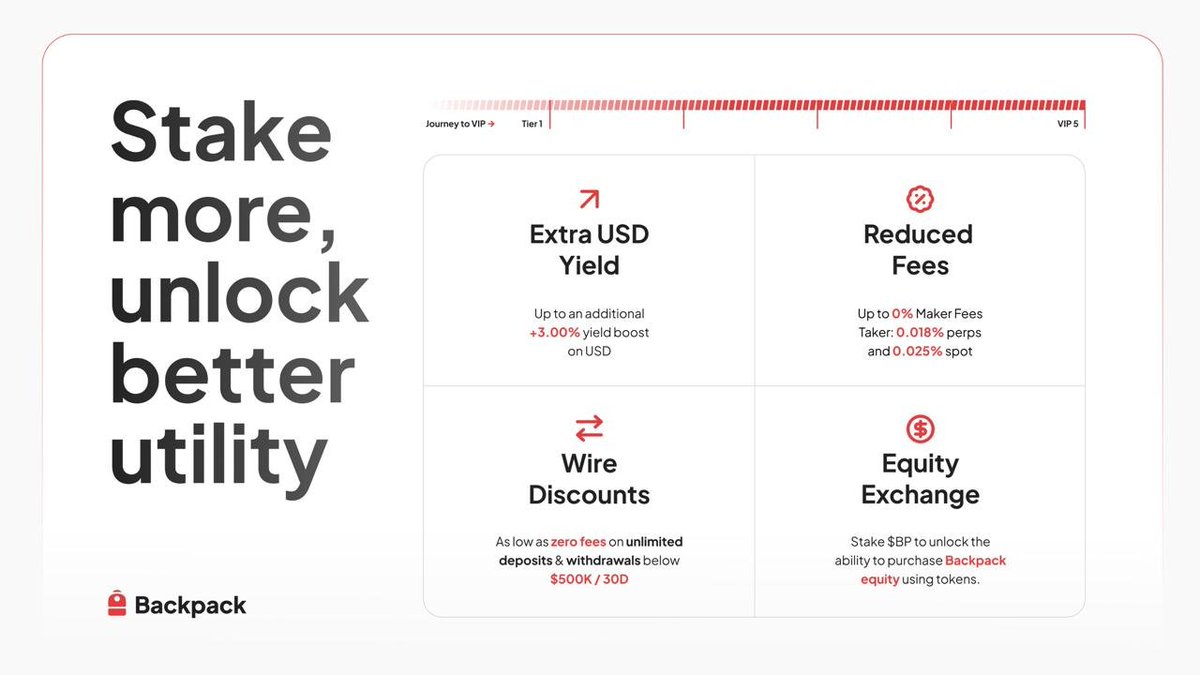
@edgeX_exchange @USDC $EDGE Mainnet is Finally Live!
Get 1.5x Boost on your Native USDC Rewards Program
edgexpro.app

English

Native USDC. Native rewards.
The Native USDC Rewards Program is live. Powered by @USDC.
Deposit. Hold. Earn.
Details on page: pro.edgex.exchange/native-usdc

English
Army Brat 🇮🇳 retweetledi

@edgeX_exchange EDGE Mainnet is Finally Live!
Register and get 1.5x boost on your allocation
Learn more: edgex-mainnet.app

English


English


Army Brat 🇮🇳 retweetledi

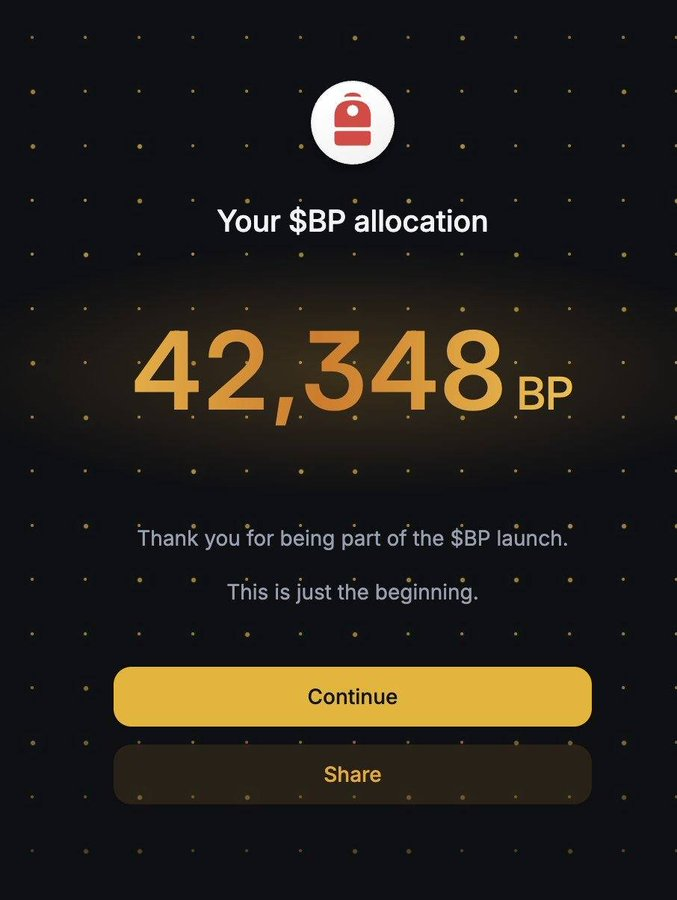
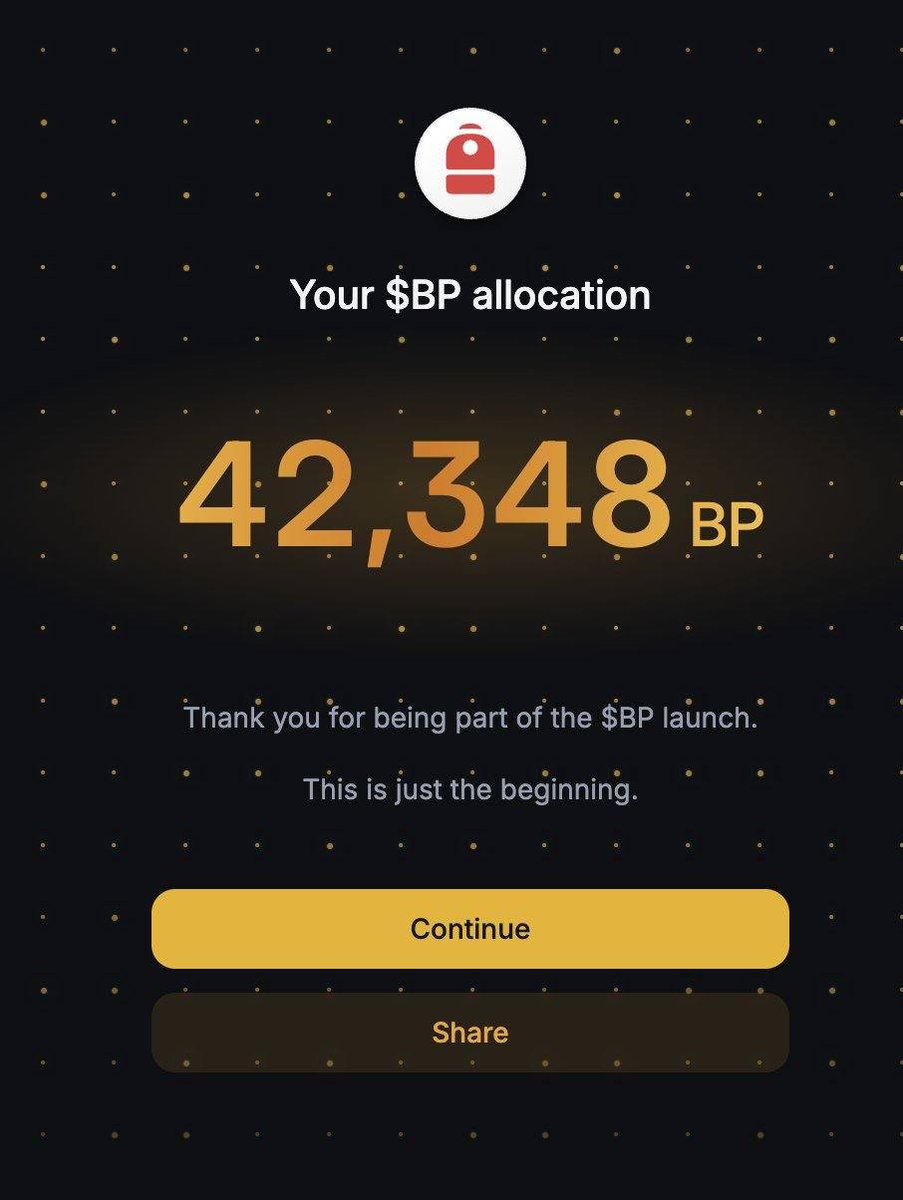
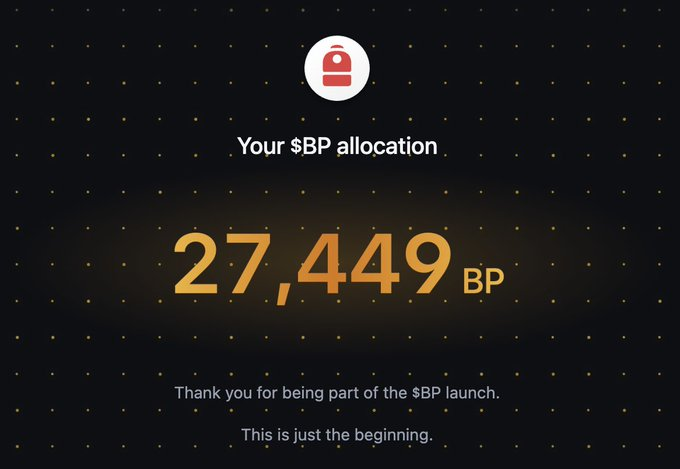
@Backpack Was eligible for 27449 $BP!
Will #Backpack launch at $4? We will see
backpacks-mainnet.app
English
The $BP market opens at 12pm UTC.
Withdrawals live shortly after.

English
As we know this from a while 😄 also in the list combodia is missing tho
Mossad Commentary@MOSSADil
MADE IN CHINA CHINESE WEAPONS ARE UNDER FIRE — AND NOT JUST IN BATTLE China became one of the world’s top arms suppliers by offering cheaper, no-strings-attached systems. Now those systems are being tested in real war. And the results are raising serious questions. • Iran, Pakistan, Venezuela: Air defenses reportedly breached in multiple conflicts • Radar failures: Systems struggled to detect incoming aircraft under real combat conditions • Electronic warfare exposure: Jamming and cyber disruption appear to neutralize key capabilities • Integration problems: Mixed Western, Russian, and Chinese systems don’t work seamlessly together • Maintenance issues: Spare parts and long-term reliability remain a recurring concern Stay connected, follow @MOSSADil
English
Oh! So now they are getting this way 😀 😂
Shashank Mattoo@MattooShashank
Breaking: America should sanction RSS and the Research and Analysis Wing, recommends US Commission on International Religious Freedom
English
@TheNavroopSingh But west and alies can take energy from west countries like canada, USA, venezuela etc ?
English

Interesting Facts & Analysis on Strait of Hormuz Closure :
A) Global oil production shut-ins could surge to 12 million barrels per day next week as shipping disruptions continue, according to JPMorgan.
B) SPR release by G7 Would cover a 12 million bpd shortfall for about 33 days (400,000,000 ÷ 12,000,000 ≈ 33.33 days, or roughly 1 month).
C) Iran allowing China and India oil through the Strait, that's more than half of normal oil traffic already (7mmb/d). Throw in the Saudi East-West pipeline for redirection (another 7mb/d).
D) This is now selective targeting by Iran, Asian economies like China & India part of BRICS+ are being insulated by Iran from Hormuz and Russia by way of Oil, LNG & Fertilisers.
E) China has added roughly 400–430 million barrels to its crude oil stockpiles over the last 12 months (March 2025–March 2026), averaging 0.9–1.1 million bpd.
F) This aggressive buildup has pushed China’s total onshore inventories (strategic + commercial) to ~1.2–1.3 billion barrels, providing 90–120+ days of import cover. Meanwhile Russia & Iran continue to add to China’s buffer.
G) Japan relies on the Middle East for ~95% of its oil imports, with around 70% of those (or ~65-70% overall) passing through the Strait of Hormuz.
H) South Korea sources ~70% of its crude oil imports from the Middle East, with nearly all (~65-70% overall) transiting the Strait of Hormuz.
I) US Fertilisers and chemicals face indirect global price impacts as nearly 50% Urea comes from Qatar while helium sees surges from Qatar’s ~30-36% global supply disruption that could impact US Chip manufacturing.
J) Europe faces sharp price spikes and indirect risks; fertilizers are highly exposed 30-49% global urea/ammonia from Gulf, one-third of trade via Hormuz while 15% Gas is sourced from Qatar. Russian one is already closes tightening Natural Gas prices in Europe !
Analysis:
1) The Hormuz closure is impacting the G7+ US Allies countries more i.e. Japan, South Korea, Europe & US (in few sectors the most).
2) BRICS (Russia, India & China) countries are being allowed to use Hormuz by Iran while Russia insulates India & China will alternative Oil, Gas & Fertilisers supplies.
3) G7 will import more inflation due to elevated costs of Oil, Gas, Fertilisers, Manufacturing which will indirectly flow into US Economy & Consumers.
4) If Hormuz crisis lasts for few more weeks which it could, then Inflationary pressure would mean rate hike by Fed & not cut. The rate cut cycle should end in natural course of things putting Western economies into Stagflation risks heading into a recession.
5) The thesis that Hormuz closure would impact Asian giants like China & India more is a western fantasy. China & India have aggressively built reserves, de-carbonised its sources of energy from Solar to Nuclear and even Coal fired plants.
6) In the last 4-5 years (roughly 2021–2025), China commissioned a massive amount of new coal-fired power capacity, peaking in 2025 with a record ~78 GW added (equivalent to dozens of large plants, including over 50 units of 1 GW+ each).
7) By early 2026, China has added 15-20 new Nuclear Reactors from 2021-25 & operational reactors reached ~59–61 with ~62 GW total capacity.
8) China has added massive solar capacity in recent years, installing a record ~217 GW in 2024 alone and ~120–150 GW in 2025, pushing total installed solar photovoltaic capacity to over 900 GW by early 2026.
9) Solar is China’s fastest-growing power source, with generation now exceeding 10–12% of total electricity and continuing to grow at 30–50% annually.
10) India’s nuclear capacity grew modestly to about 8.8 GW from 24 reactors over the period 2021 to 2026. Coal capacity reached roughly 221 GW by January 2026 while adding 8 to 10 GW annually.
11) Solar power in India exploded to 140–144 GW installed capacity by early 2026 from 40 GW in 2021. Record additions of 35–38 GW in 2025 made solar India’s fastest-growing power source.
English

What's about the tariff which @POTUS had put on India for the same act that you're preaching now, that time it was biden this time its Trump
Now you tell us, what you're doing to fight terrorism emerging from porkistan ?
Ambassador Sergio Gor@USAmbIndia
India has been a great partner in maintaining stable oil prices around the world. The United States recognizes ongoing purchases of Russian oil are a part of this effort. India is one of the largest consumers and refiners of oil and it is essential for the United States and India to work hand in hand for market stability for Americans and Indians.
English
