

Dorte Jelstrup
1.8K posts
Dorte Jelstrup
@dortejelstrup
On this profile I share beautiful charts just for the fun of it.
Copenhagen Katılım Temmuz 2015
56 Takip Edilen67 Takipçiler

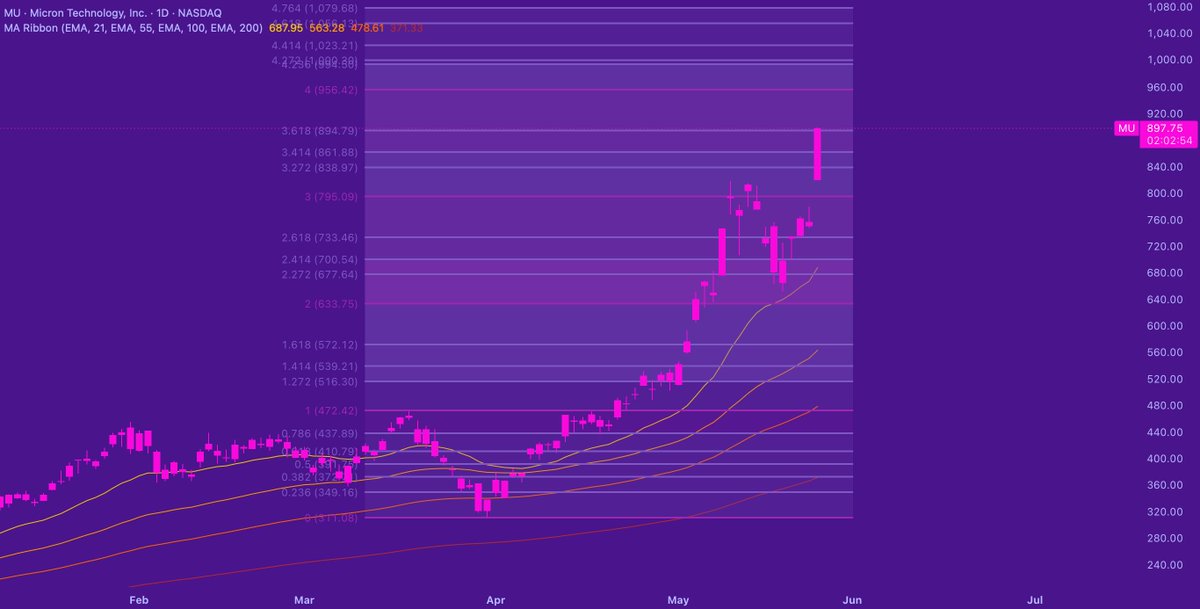
$MU visited the gap today and is now up +4,03 %...
No retest of the 21-day EMA (at least not yet)...
English
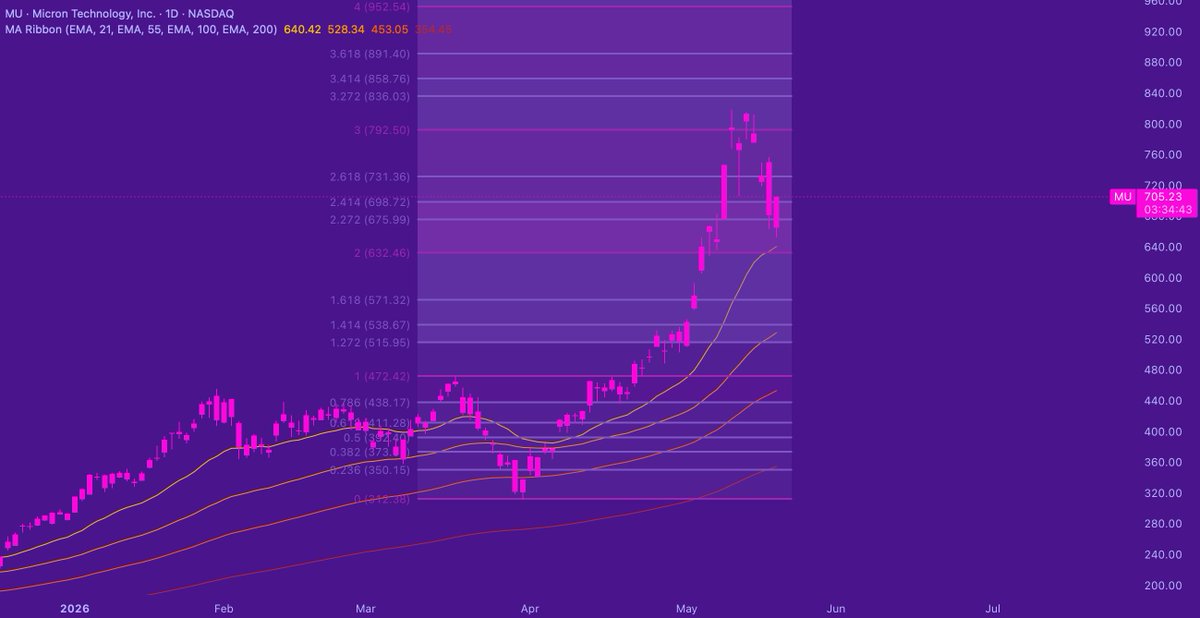
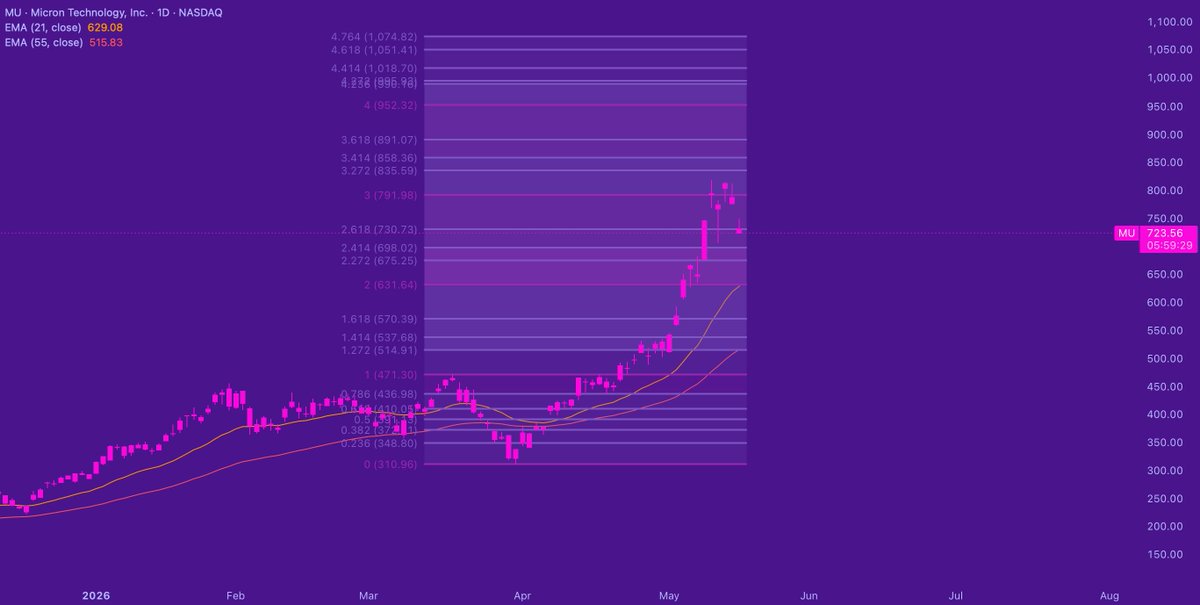
The thing one has to remember is that even though the chart of $MU looks super extended, $MU is still relatively cheap as an AI play...
It will be interesting to see whether this one retests the 21-day EMA and maybe even also the 55-day EMA...
English
Crude is getting hammered; $CL_F is down -5,82%.
Brent is getting hammered; $BRN_F is down -8,63%.
And the Dixie is also dropping; $DXY is down -0,33%.
Obviously, this is beneficial for European equities...
English
This is Europe...
And today, Europe is breaking out... ✨
$EXIE, iShares STOXX Europe 600 UCITS ETF, trades above the Fibonacci level 1 of the Fibonacci retracement from the February 27 '26 high.
As a European, I love to see it!
Right now and today, $EXIE is up +1,70%.

English
Europe, mon amour! ✨
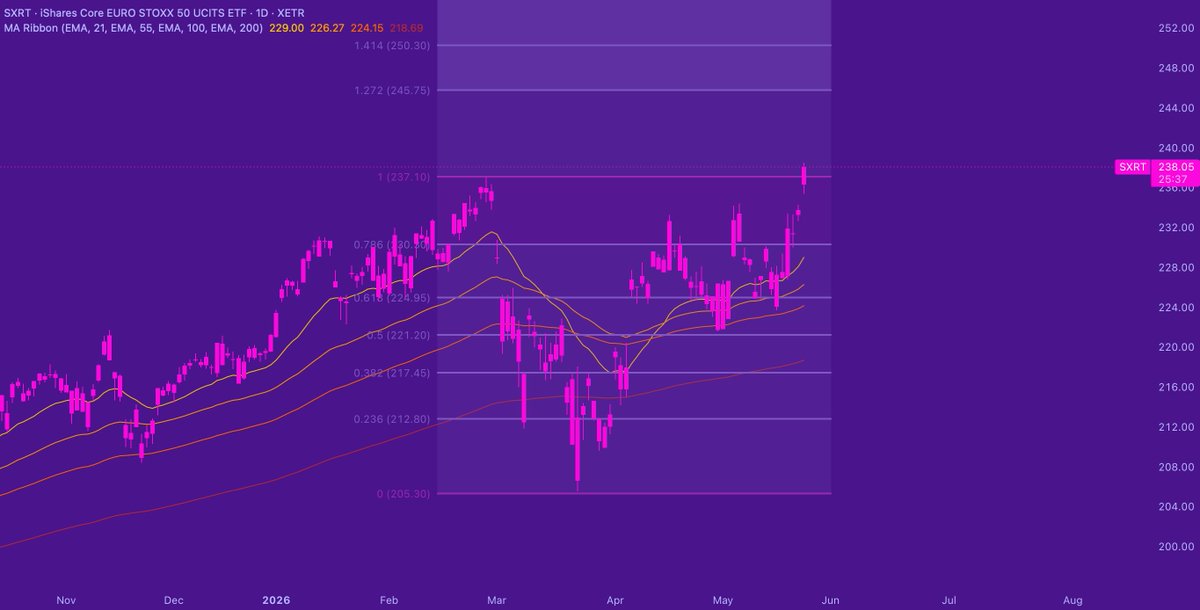
Finally, Europe is breaking out...
Today, $SXRT, that is iShares Core EURO STOXX 50 UCITS ETF, trades above the Fibonacci level 1 of the Fibonacci retracement from the February 27 '26 high.
A new all-time high in this one; it's up +1,78% for today.
English
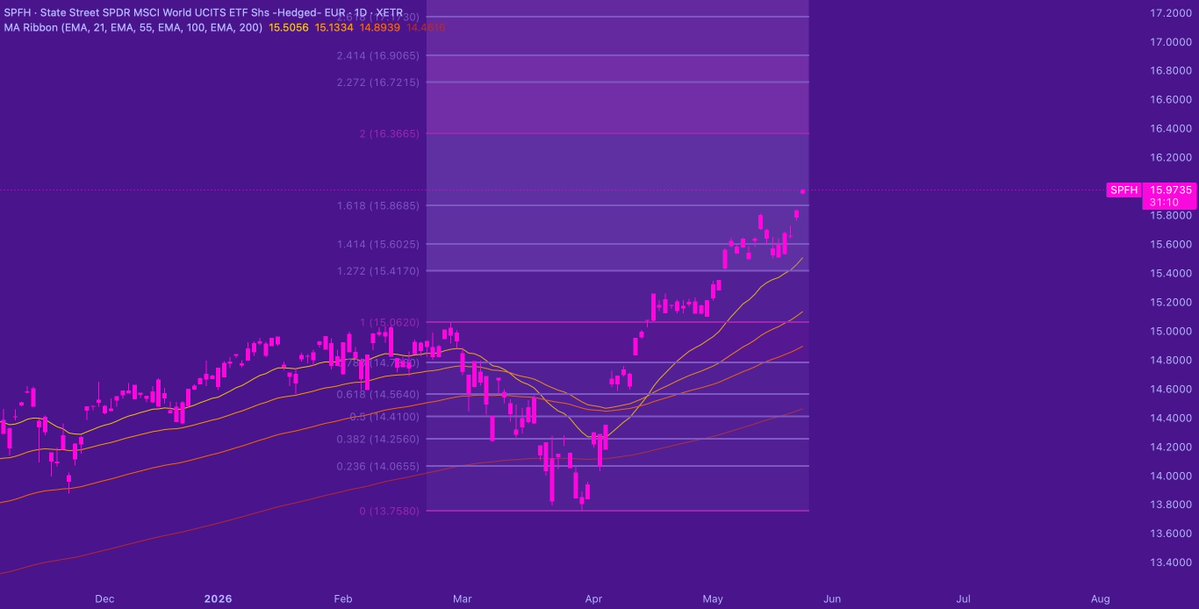
Today, $SPFH, that is State Street SPDR MSCI World UCITS ETF (Euro hedged) is proudly trading above the Fibonacci level 1,618 of the Fibonacci retracement from the February 26 '26 high.
It's up +0,87%.
We are seeing a new all-time high in this one.
The world 🌍 is simply on its way up! 😊
English
The world belongs to the bulls! 🌍
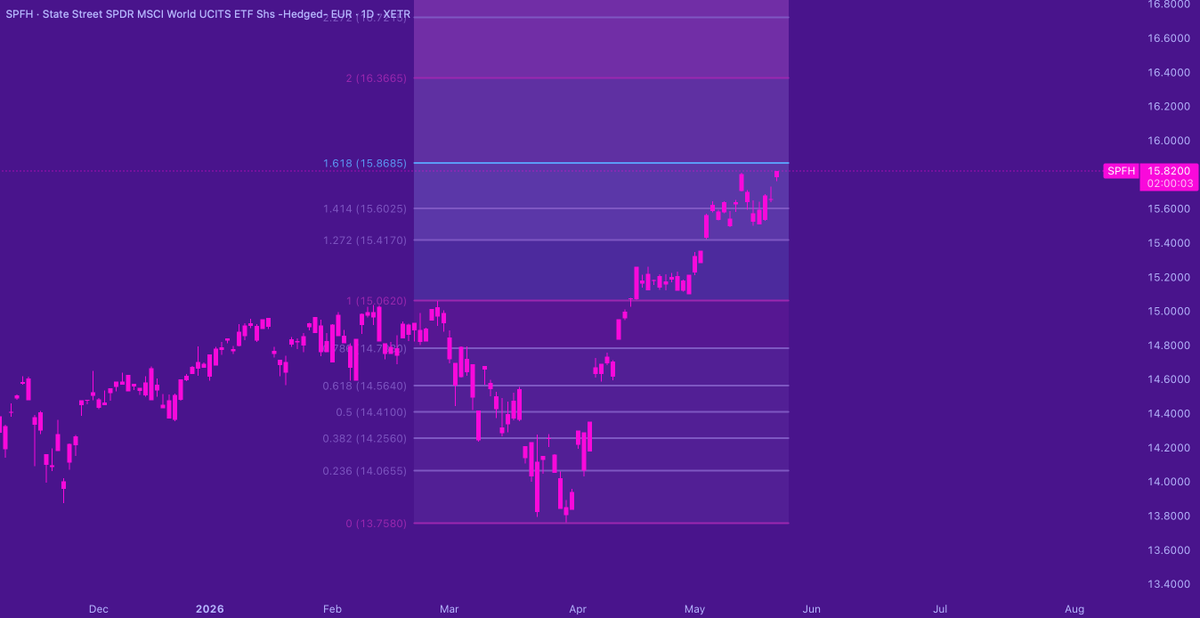
This is $SPFH, that is State Street SPDR MSCI World UCITS ETF (Euro hedged).
Today, we are seeing a new all-time high in this one.
And it's confidently and optimistically approaching the Fibonacci level 1,618 of the Fibonacci retracement of the February 26 '26 high,
It's beautiful, isn't it?
Have a great weekend! ✨
English
$NVDA
Stellar earnings.
However, today it dropped -1,77%; it found support at the VWAP anchored at the April 27 '26 high.
It could potentially retest the 21-day EMA in conjunction with the Fibonacci level 1 of the Fibonacci retracement from the October 29 '25 high.
It has a very strong support at the area delineated by the VWAPs anchored at the February 25 '26 high and the October 29 '25 high in conjunction with the Fibonacci level 0,618.
Pt is still found around the Fibonacci level 1,618 and maybe even higher.

English
$XLE
It has been rejected at the Fibonacci level 0,786 of the Fibonacci retracement from the March 30 '26 high.
However, it still trades above
- the 21-day EMA,
- the VWAPs anchored at the March 30 '26 high and the April 30 '26 high, and
- the Fibonacci level 0,5.
Today, it's down -1,12%.

English
$TSM
Might be in the process of building a base between the Fibonacci levels 1 and 1,414 of the Fibonacci retracement from the February 25 '26 high.
It could potentially retest the 55-day EMA in conjunction with the VWAP anchored at the February 25 '26 high and the Fibonacci level 0,786.
Pt is still found around the Fibonacci level 1,618.
Today, it's up +1,38%.

English
$SMH
Back above the Fibonacci level 3 of the Fibonacci retracement from the February 25 '26 high.
Still, it looks pretty extended.
Up +0,51% for today.

English
Still, $SMH comes across as pretty extended...
And in general, there is nothing wrong with proper risk management...
English
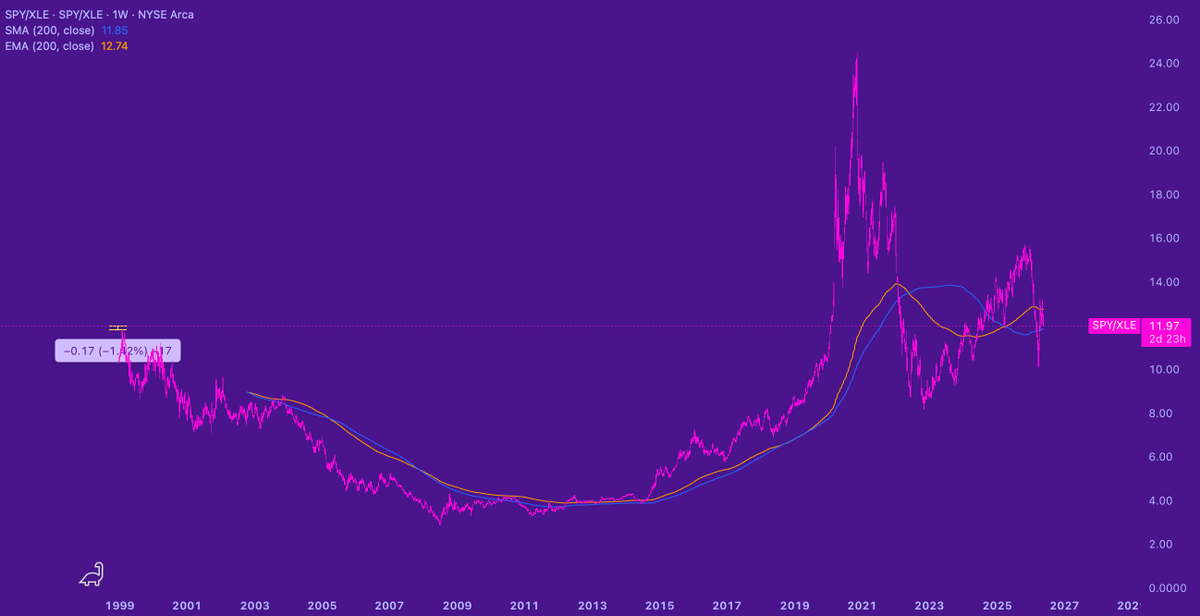
But of course, one might say, that the spike in $SPY relative to $XLE in 2020 was related to the drop in oil prices during the Covid crisis; however, that doesn't change the fact that currently, $SPY relative to $XLE trades at roughly the same level as it did in 1999...
English
Now, let's take a look at $SPY relative to $XLE once again.
This is $SPY relative to $XLE on a weekly chart.
In May 2026 we have seen several new all time highs in $SPY.
However, with today's close, $SPY relative to $XLE is roughly around -1,50% away from trading at the price level of February 1999...
And we are more than an increase of +100% away from a new all time high in $SPY relative to $XLE.
Food for thought...
English
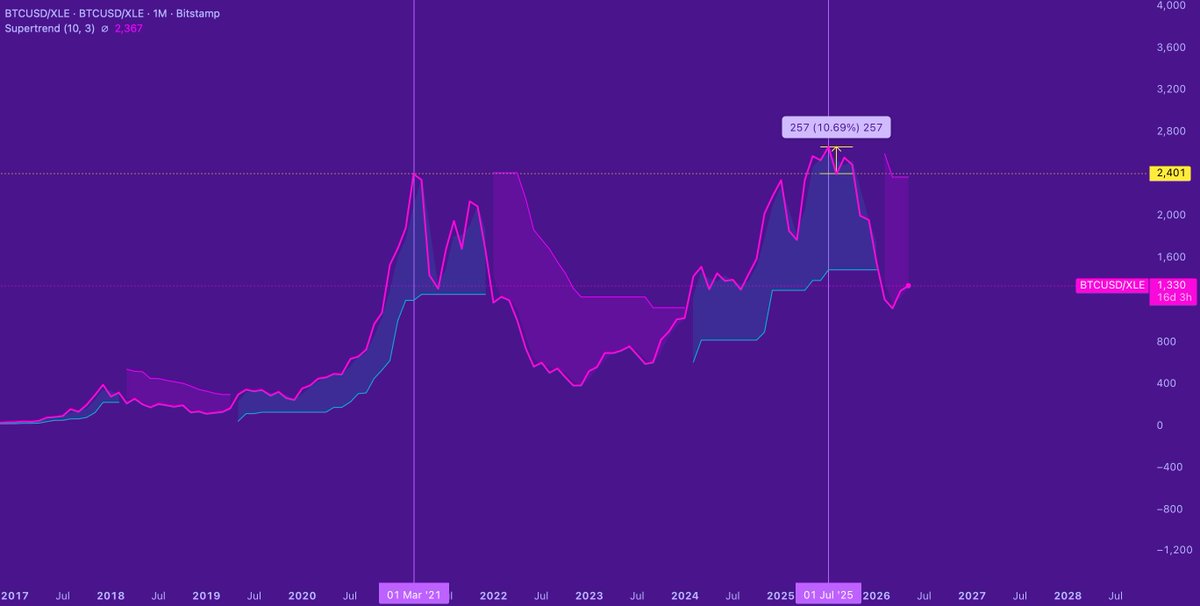
This is $BTCUSD relative to $XLE on a monthly line chart.
Obviously, and to no one's surprise, $BTCUSD is in a downtrend relative to $XLE on the Supertrend indicator.
However, what is a surprise -- at least for me -- is the following:
From the top of March '21 to the top of July '25 the passionate Bitcoin investor has only gained around +11,00 % relative to $XLE.
Food for thought...
Have a nice weekend! 😊
English