Sabitlenmiş Tweet
Dr. Thad
559 posts


Dr. Thad
@drthadblog
I write about topics that interest me, but focus on econ and finance
Katılım Şubat 2023
908 Takip Edilen87 Takipçiler
@jeffspross How exactly was this achieved, when capital gains tax rate was 25% and ~90% of taxable income of top 0.1% consisted of capital gains?
English

A 91% tax rate on high income brackets is a pigouvian tax on inequality. It’s meant to discourage plutocracy the way a carbon tax discourages CO2 emissions. That few people actually paid that rate was a feature, not a bug.
Jessica Riedl 🧀 🇺🇦@JessicaBRiedl
As other economists have shown, Gabriel Zucman's tax and inequality data is wildly misleading. He turns seemingly every methodological dial to claim that inequality has soared and high-earner taxes have collapsed. In his own data, virtually the ENTIRE drop in high-income taxes come from Zucman's highly unorthodox assumptions about the incidence of the corporate tax - which he claims cost the top 1% of earners 29% (!) of their income in 1951, and yet now costs them 6%. And this questionable data accounts for his ENTIRE claimed "drop" in higher-earner taxes. You see - on the income tax side - Zucman's own data shows that the average individual income tax paid by the rich has RISEN - not fallen - since the 1950s. See gabriel-zucman.eu/usdina/ then click on "Table 2: Distributional series," and navigate to tab TG2b, column T for income taxes (and column U for corporate taxes) As much as Zucman builds up 1950s income tax rates, almost no one actually paid 91% tax rates - or even touched a tax bracket over 50%. And that's why actual income tax revenues - including income tax rates paid by the rich - were *lower* in the 1950s than today. Zucman's rhetoric is peddling a "tax the rich" utopia of the 1940s-1960s that his own data shows did not exist.
English
Dr. Thad retweetledi

It’s hard to take “summaries of the debate” like this seriously when they don’t note that PSZ have, for years, simply ignored AS’s counter-replies to their criticism. Also when they characterize the underreported income debate in such a PSZ-friendly way. (more)
Arin Dube@arindube
Since I see Piketty-Saez-Zucman vs Auten-Splinter (on the rise of inequality) again on my TL, let me share two items. First, here is what I (very briefly) say about the exchange in my book. Then in the next post, I'll link to my lecture notes on this, doing a deep dive.
English
@MaxJerneck Nope, there were a lot of people with incomes several times higher than top marginal tax rate cutoff, and their effective tax rates were nowhere near that high. They just diverted "labor income" into other forms of income/consumption
x.com/i/status/20556…
Dr. Thad@drthadblog
Some people might believe the reason for this was that very few people were rich during that time, counting it as a success of post-war tax policy. But that's not really true. Many people with incomes well above $200,000 weren't subjected to this tax rate. Tax Policy Center calculated effective tax rates for different income groups using IRS data. Based on their calculations, in 1955 people earning over $1 million — far above the $200,000 top marginal rate threshold, equivalent to around $11 million today — faced an effective tax rate of only 35.81%.
English

”almost no one actually paid 91% tax rates”
That means the tax worked! Sin taxes should abolish themselves
Jessica Riedl 🧀 🇺🇦@JessicaBRiedl
As other economists have shown, Gabriel Zucman's tax and inequality data is wildly misleading. He turns seemingly every methodological dial to claim that inequality has soared and high-earner taxes have collapsed. In his own data, virtually the ENTIRE drop in high-income taxes come from Zucman's highly unorthodox assumptions about the incidence of the corporate tax - which he claims cost the top 1% of earners 29% (!) of their income in 1951, and yet now costs them 6%. And this questionable data accounts for his ENTIRE claimed "drop" in higher-earner taxes. You see - on the income tax side - Zucman's own data shows that the average individual income tax paid by the rich has RISEN - not fallen - since the 1950s. See gabriel-zucman.eu/usdina/ then click on "Table 2: Distributional series," and navigate to tab TG2b, column T for income taxes (and column U for corporate taxes) As much as Zucman builds up 1950s income tax rates, almost no one actually paid 91% tax rates - or even touched a tax bracket over 50%. And that's why actual income tax revenues - including income tax rates paid by the rich - were *lower* in the 1950s than today. Zucman's rhetoric is peddling a "tax the rich" utopia of the 1940s-1960s that his own data shows did not exist.
English

@Lefty_Kitty @FarmGirlCarrie If you make $100 one year and then $400 the next year, what percentage did your income increase? If you make $100 the next year after that, what percentage did your income decrease? RETARĎ
English

Prison violence dropped 300%
all because of cats 🐱
English
These rates are completely wrong, and even Pikkety-Saez-Zucman's work shows that. Let's start with the "top 1%". PSZ 2018 shows that the average effective tax rate paid by this group in post-war period (1945-1973) fluctuated between 35-45%, with an average of approximately 40%. Although this rate is slightly higher than that of the post-1980s era (which ranged from 30-40%, with an average of around 35%), it's not a drastic difference. Yet in the graphic being referenced, the figure appears to oscillate around just 25–30%.
Simon Kuestenmacher@simongerman600
If you have this weird gut feeling that the rich pay little tax in the US, your gut is spot on... Source: nytimes.com/interactive/20…
English
Dr. Thad retweetledi

Reminder that among the many issues with this graph, the silliest methodological one is that many social transfers register as increasing the tax rate at the lower end of the income distribution.
This is why nowadays the same methodology gives a tax rate above 100% for the poor in France.
In the case of the US, programs like the earned income tax credit (EITC) and child tax credit (CTC), which reduce the tax bill of the poor, register as doing the opposite under this methodology.
Why? Essentially because the credits are not netted out of the tax bill, while the sales tax on the increased consumption they fund is added to it. The denominator, meanwhile, is pre-tax, pre-transfer income.
The more you receive transfers from the government, the highest will be the cost of sales tax relative to your pre-transfer income.
If you apply this methodology to retirees, their tax rate can also be extremely high since they pay income tax and sales taxes on their social security benefits, which is not part of their pre-transfer income at the denominator.
A more complicated issue is the inclusion of payroll taxes that fund Social Security and represent the biggest chunk of taxes on the lower half of the distribution.
When workers (employer share is allocated to workers on this graph) pay Social Security taxes, they accumulate individualized claims to future Social Security benefits. The true tax is the differential between the actuarial value of the claim obtained and the tax paid to obtain it. Here the entire tax is counted without regard for the claim.
If you take these graphs seriously, you'd therefore conclude that privatizing Social Security, Medicare and Medicaid would make the fiscal system much more progressive since it would massively lower taxes in the bottom 80%.
Of course, that's a silly conclusion. But at the end of the day, this is what this graph is about: welfare state denialism.
Simon Kuestenmacher@simongerman600
If you have this weird gut feeling that the rich pay little tax in the US, your gut is spot on... Source: nytimes.com/interactive/20…
English
How did 90%+ labor income tax rates achieve that, when capital gains taxes were only 25%?
As we know, many people at the time earned incomes several times above the threshold where the top marginal rate began, yet their effective tax rates were much lower.
x.com/i/status/20556…
English

As I’ve said many times, the goal of the 90%+ top tax rates wasn’t to raise a lot of revenue, as they applied to very few people. It was to curb the power of the plutocrats. It was to reduce inequality by disincentivizing large corporate pay packets.
Jessica Riedl 🧀 🇺🇦@JessicaBRiedl
As other economists have shown, Gabriel Zucman's tax and inequality data is wildly misleading. He turns seemingly every methodological dial to claim that inequality has soared and high-earner taxes have collapsed. In his own data, virtually the ENTIRE drop in high-income taxes come from Zucman's highly unorthodox assumptions about the incidence of the corporate tax - which he claims cost the top 1% of earners 29% (!) of their income in 1951, and yet now costs them 6%. And this questionable data accounts for his ENTIRE claimed "drop" in higher-earner taxes. You see - on the income tax side - Zucman's own data shows that the average individual income tax paid by the rich has RISEN - not fallen - since the 1950s. See gabriel-zucman.eu/usdina/ then click on "Table 2: Distributional series," and navigate to tab TG2b, column T for income taxes (and column U for corporate taxes) As much as Zucman builds up 1950s income tax rates, almost no one actually paid 91% tax rates - or even touched a tax bracket over 50%. And that's why actual income tax revenues - including income tax rates paid by the rich - were *lower* in the 1950s than today. Zucman's rhetoric is peddling a "tax the rich" utopia of the 1940s-1960s that his own data shows did not exist.
English
Dr. Thad retweetledi

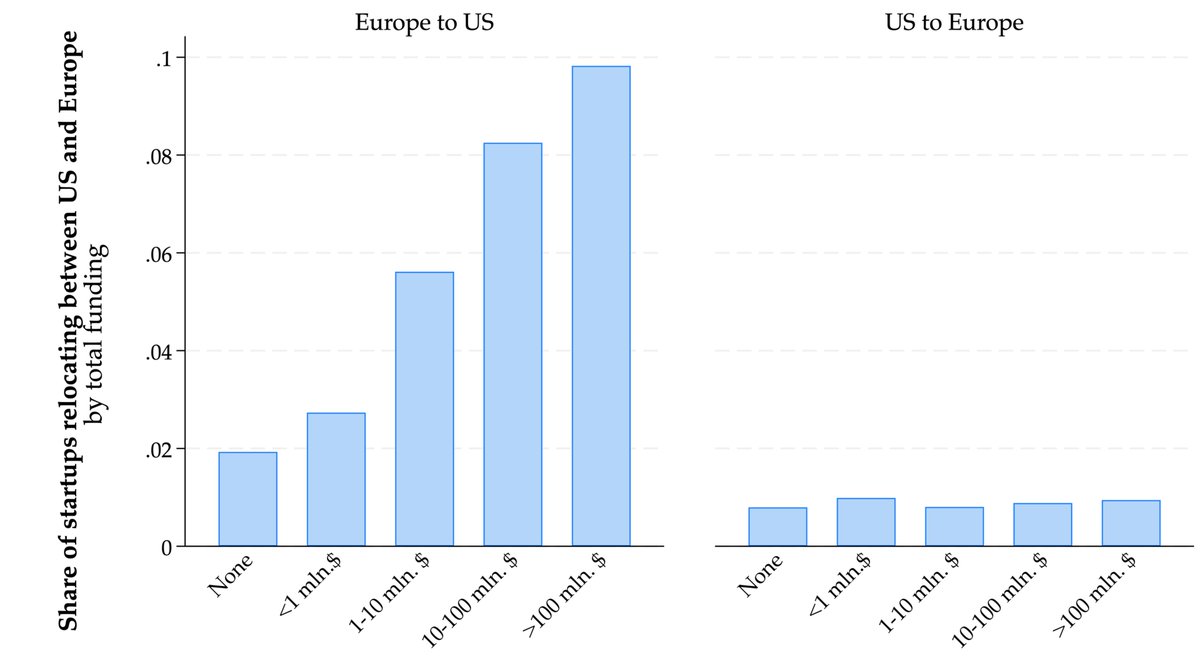
Which of the US or EU do economic agents choose to locate in?
Their choice reveals how they weigh all the factors that matter. The relevant agent for productivity and economic growth are firms. So, the migration rates of startups reveals the economy where you want to be to grow and succeed:
English
Dr. Thad retweetledi

As other economists have shown, Gabriel Zucman's tax and inequality data is wildly misleading. He turns seemingly every methodological dial to claim that inequality has soared and high-earner taxes have collapsed.
In his own data, virtually the ENTIRE drop in high-income taxes come from Zucman's highly unorthodox assumptions about the incidence of the corporate tax - which he claims cost the top 1% of earners 29% (!) of their income in 1951, and yet now costs them 6%.
And this questionable data accounts for his ENTIRE claimed "drop" in higher-earner taxes.
You see - on the income tax side - Zucman's own data shows that the average individual income tax paid by the rich has RISEN - not fallen - since the 1950s.
See gabriel-zucman.eu/usdina/ then click on "Table 2: Distributional series," and navigate to tab TG2b, column T for income taxes (and column U for corporate taxes)
As much as Zucman builds up 1950s income tax rates, almost no one actually paid 91% tax rates - or even touched a tax bracket over 50%. And that's why actual income tax revenues - including income tax rates paid by the rich - were *lower* in the 1950s than today.
Zucman's rhetoric is peddling a "tax the rich" utopia of the 1940s-1960s that his own data shows did not exist.
Simon Kuestenmacher@simongerman600
If you have this weird gut feeling that the rich pay little tax in the US, your gut is spot on... Source: nytimes.com/interactive/20…
English
@swinshi It's not even what PSZ's academic work shows!
x.com/drthadblog/sta…
Dr. Thad@drthadblog
These rates are completely wrong, and even Pikkety-Saez-Zucman's work shows that. Let's start with the "top 1%". PSZ 2018 shows that the average effective tax rate paid by this group in post-war period (1945-1973) fluctuated between 35-45%, with an average of approximately 40%. Although this rate is slightly higher than that of the post-1980s era (which ranged from 30-40%, with an average of around 35%), it's not a drastic difference. Yet in the graphic being referenced, the figure appears to oscillate around just 25–30%.
English
Piketty-Saez-Zucman have been thoroughly discredited, and if they were conservatives, claims this wrong would never have been given serious consideration.
Simon Kuestenmacher@simongerman600
If you have this weird gut feeling that the rich pay little tax in the US, your gut is spot on... Source: nytimes.com/interactive/20…
English
@simongerman600 Obviously wrong, but we knew that already, even PSZ's own work shows it. But if you tweak your assumptions just enough regarding the incidence of specific taxes, you can show whatever you want.
x.com/drthadblog/sta…
Dr. Thad@drthadblog
These rates are completely wrong, and even Pikkety-Saez-Zucman's work shows that. Let's start with the "top 1%". PSZ 2018 shows that the average effective tax rate paid by this group in post-war period (1945-1973) fluctuated between 35-45%, with an average of approximately 40%. Although this rate is slightly higher than that of the post-1980s era (which ranged from 30-40%, with an average of around 35%), it's not a drastic difference. Yet in the graphic being referenced, the figure appears to oscillate around just 25–30%.
English

If you have this weird gut feeling that the rich pay little tax in the US, your gut is spot on... Source: nytimes.com/interactive/20…
English