Elastic

10.4K posts

Elastic banner
Elastic

Elastic

@elastic

Where developers learn, build, and share. Your source for hands-on demos, cheat sheets, explainers and more.

Global Katılım Ekim 2009
183 Takip Edilen65.6K Takipçiler
Elastic
Elastic@elastic·
Search feels simple until you start getting back irrelevant results. Know which of these 3 retrieval strategies to reach for a furniture store site: - BM25 matches exact terms. Finds an ottoman from "Product ID 43926". - Vector matches meaning. Figures out what "padded stool for my feet" actually refers to. - Hybrid runs both. Exact SKUs and vague descriptions in the same query. BM25 for known items. Vector for descriptions. Hybrid when you can't predict which. There is no one-size-fits-all solution.
Elastic tweet media
English
2
3
9
1.8K
Elastic
Elastic@elastic·
The full deep dive on why Elasticsearch is going columnar, what Columnar Mode changes, and what it doesn't: go.es.io/4bf5S2O
English
0
0
8
1.1K
Elastic
Elastic@elastic·
We're introducing Elasticsearch Columnar Mode: A new index mode that stores data once, in columnar form, with no redundant copies and no indexes the workload doesn't need. Not replacing the document model. Adding a second way to organise data alongside it, for the workloads where columnar is the right shape: logs, telemetry, metrics, security events, AI retrieval. One platform for search and analytics at the same level, on the same data. Tech Preview in 9.5, GA in 9.6.
Elastic tweet media
English
7
16
104
1.3M
Elastic
Elastic@elastic·
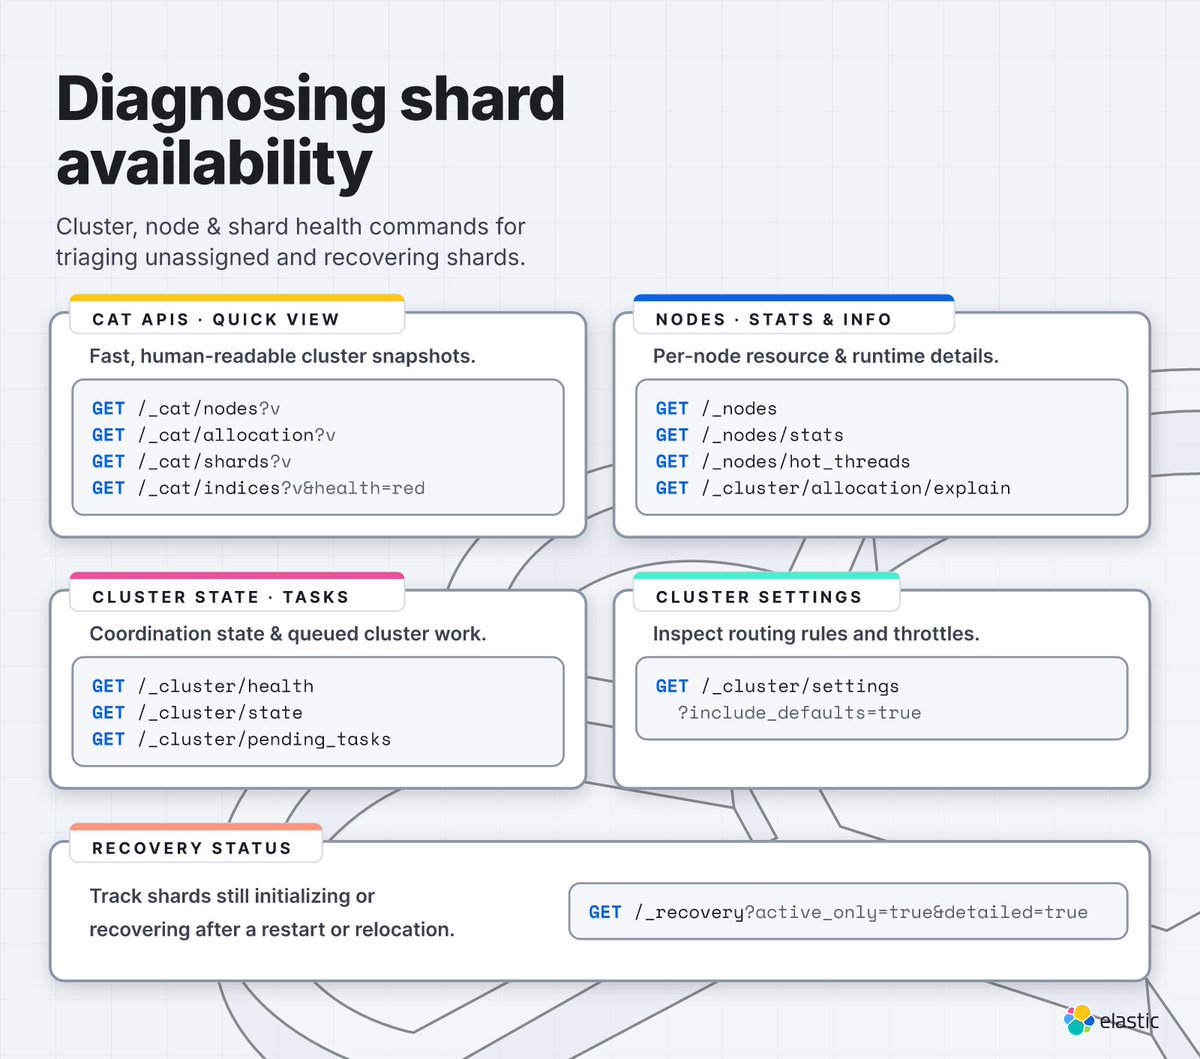
A red cluster is a decision tree, not one magic command. Bookmark these common commands to help you diagnose cluster, node and shard health issues
Elastic tweet media
English
2
2
21
2.2K
Elastic
Elastic@elastic·
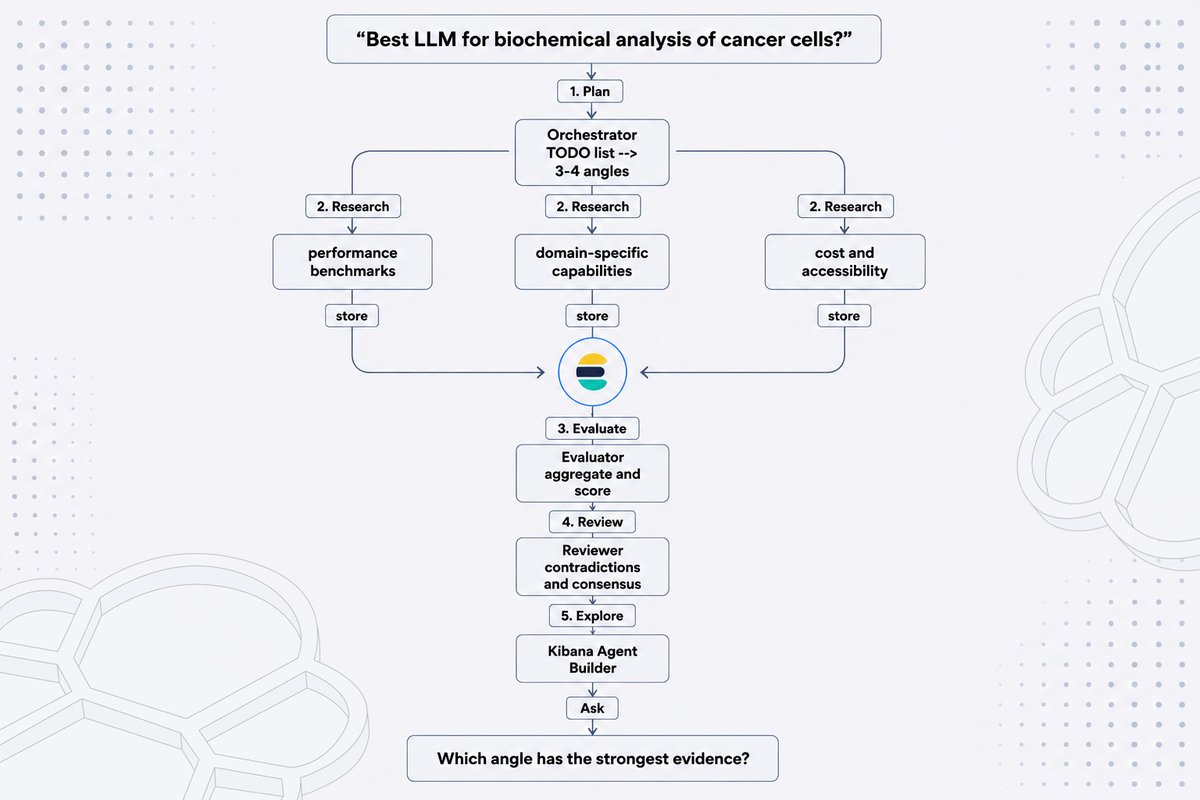
Your research agent returns confident answers from a single source. That's not research. That's a summary with extra steps. Cross-checking needs structure: multiple angles, independent findings, a way to compare them. @LangChain Deep Agents with Elasticsearch give you that pipeline: 1. Plan: orchestrator writes 3-4 research angles 2. Research: one sub-agent per angle, findings indexed with structured metadata 3. Evaluate: aggregator scores evidence quality by angle 4. Review: cross-reviewer flags contradictions and consensus 5. Explore: Elastic Agent Builder agent for plain-language queries over indexed findings Each finding carries evidence_type, relevance_score, and source_credibility as metadata fields used alongside the semantic_text field combining query, title, and content fields. One query filters, aggregates, and searches semantically. Without the storage layer, steps 3-5 don't exist. That's the difference between a research agent and a summariser. Full walkthrough with the notebook: go.es.io/4p2sqJW
Elastic tweet media
English
2
6
27
2.6K
Elastic retweetledi
Elastic Security Labs
Elastic Security Labs@elasticseclabs·
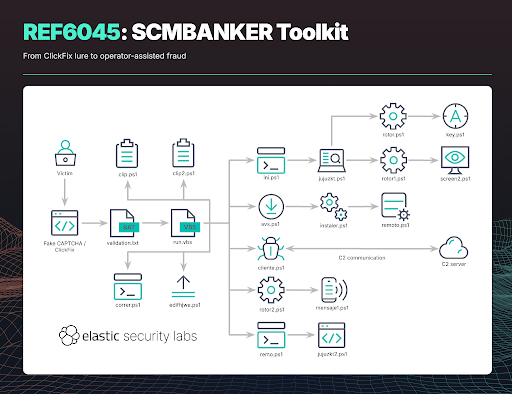
We tracked a new activity cluster targeting Mexican banking customers. Elastic Security Labs discovered REF6045, an operator-assisted banking fraud campaign targeting customers of Mexican banks, fintechs, and cryptocurrency platforms through ClickFix fake-CAPTCHA lures. The operation exhibits a reliance on AI-generated code and suffers from significant operational security (OPSEC) failures that exposed their infrastructure and their toolkit. The toolkit gives operators a full fraud workflow from: •Vishing overlay: lock the screen behind a fake bank warning •Browser redirect: paste a phishing URL via automated keystrokes •Clipboard swap: replace CLABE or card numbers mid-transfer •Remote access: install Remote Utilities for hands-on takeover Research by @k33b0i and @soolidsnakee. Full analysis from Elastic Security Labs: go.es.io/4eP6VZF
Elastic Security Labs tweet media
English
3
25
69
5.6K
Elastic
Elastic@elastic·
Your Claude API bill shouldn't be a monthly surprise. The Elastic Anthropic Metrics integration polls Anthropic's Admin API and routes org-wide usage, cost, and rate limit data into Elasticsearch. One Admin API key. Zero application code changes. 6 alert templates out of the box. Monitor Anthropic API usage, cost, and rate limits in Elastic: go.es.io/4eS2jk3
English
5
7
22
4.3K
Elastic
Elastic@elastic·
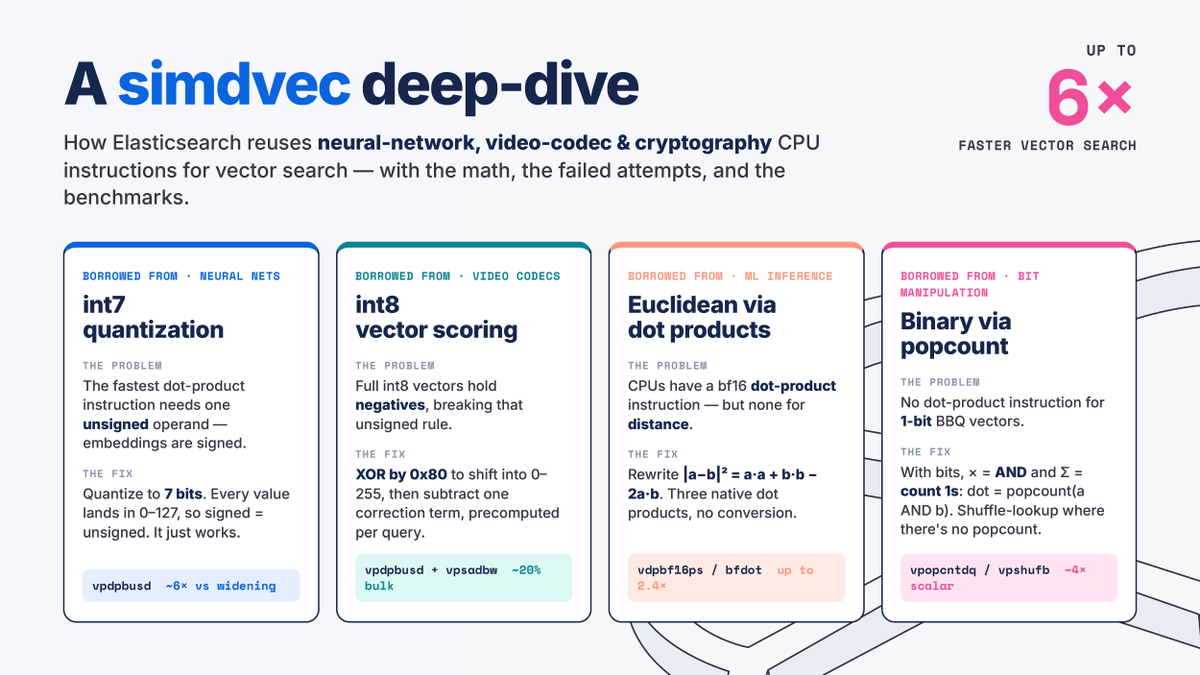
Four ways Elasticsearch's vector search engine reuses neural-network, video-codec and cryptography CPU instructions for up to 6x speedups; with the math, the failed attempts and the benchmarks. go.es.io/4fisDoQ
English
0
0
1
648
Elastic
Elastic@elastic·
CPUs don't have vector search instructions. You borrow from neural nets and video codecs instead. Elasticsearch's simdvec engine reformulates vector math to fit whatever the CPU already runs fast. Four recent examples: - int7 quantization: fit unsigned-only multiply-accumulate by trading 1 bit of precision. ~6x faster. - int8 bias rewrite: algebraic shift + precomputed correction. ~20% bulk gain. - bf16 Euclidean distance as 3 dot products instead of a float32 conversion. Up to 2.4x. - Binary dot product via popcount: AND the bits, count the 1s. ~4x over scalar. A compiler can't make these calls. Each one requires reformulating the problem to fit an instruction the hardware was never designed to use this way.
Elastic tweet media
English
3
9
25
2.9K
Elastic
Elastic@elastic·
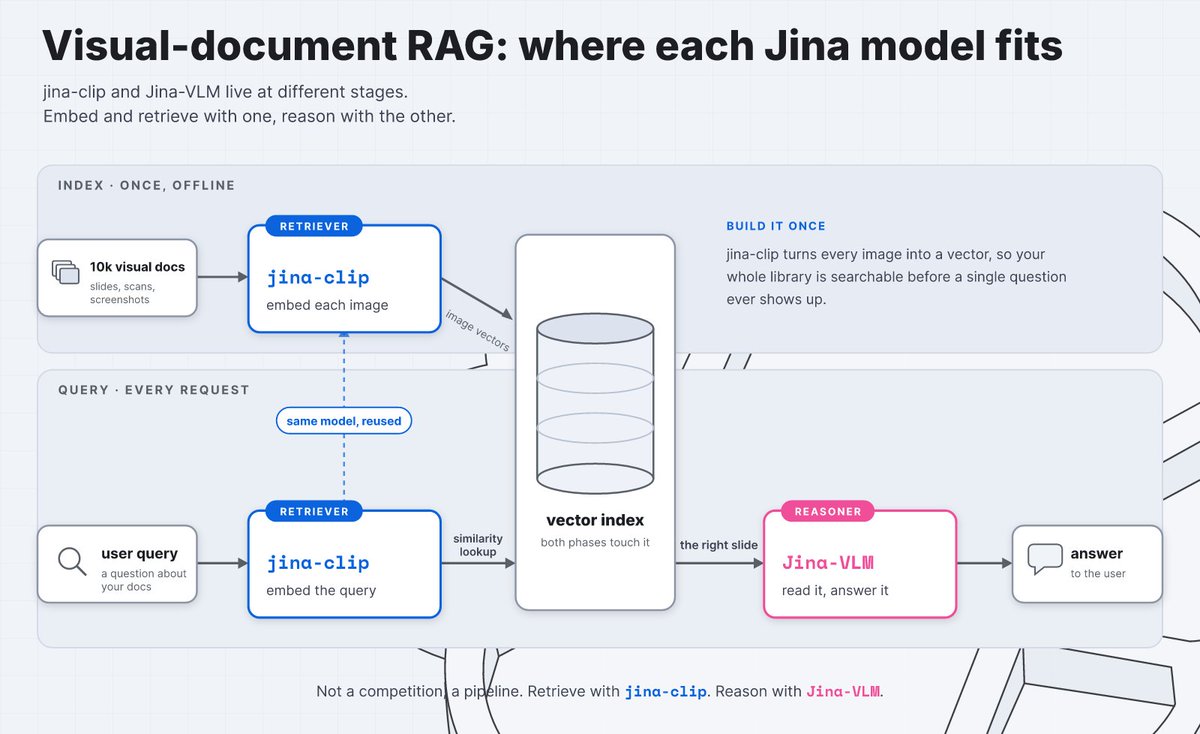
You've got 10k slides, scans, and screenshots to search. Your first instinct is to throw a VLM at it. But a VLM reads one image at a time. Running it across your whole corpus on every query doesn’t scale. Split the pipeline instead. jina-clip embeds every image into a vector once. At query time, the same model embeds your question and does a similarity lookup. Jina-VLM only touches the matched slides: a handful of images, not thousands. Build the index once, then retrieval is instant. The VLM only reasons where it matters.
Elastic tweet media
English
9
14
124
2.4M
Elastic
Elastic@elastic·
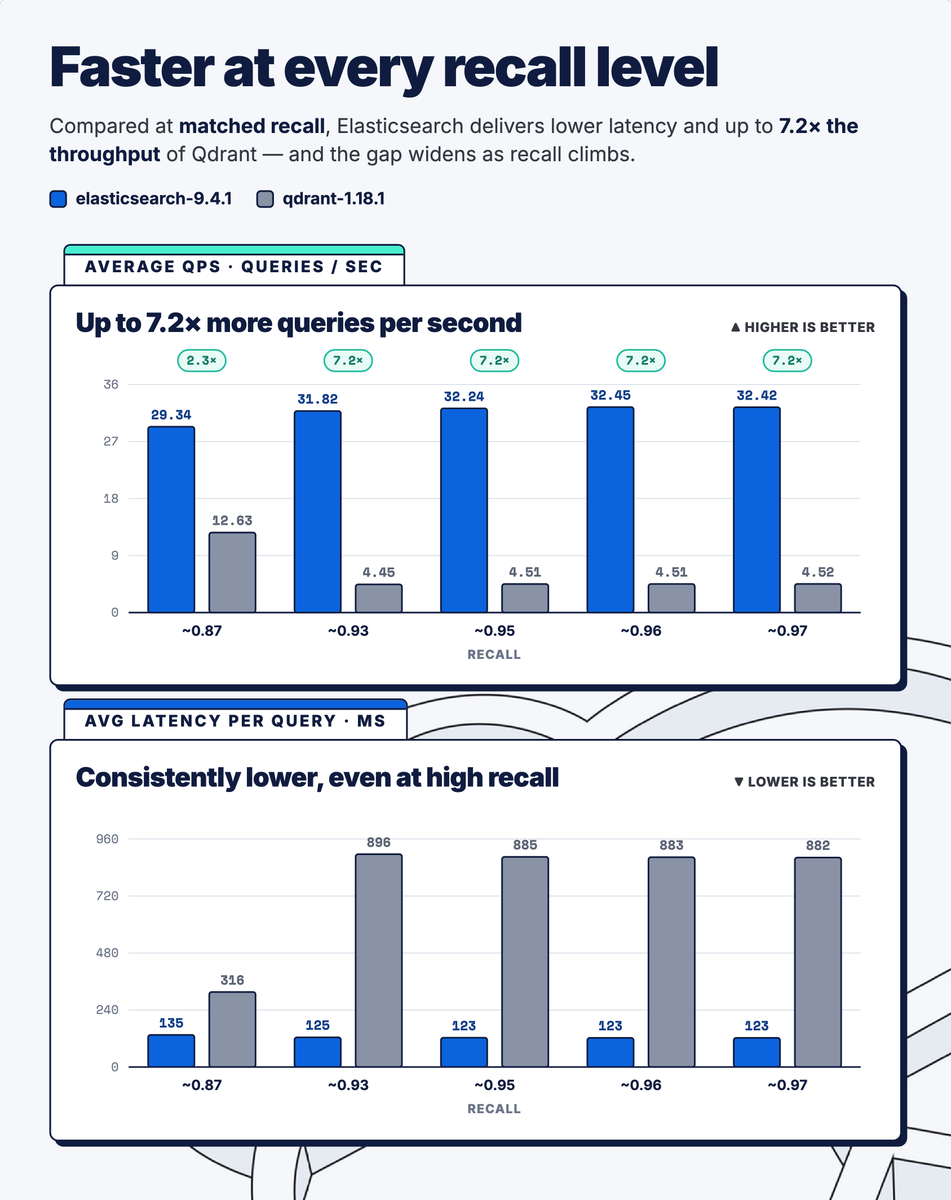
7x higher vector search throughput at comparable recall. Elasticsearch 9.4.1 DiskBBQ vs Qdrant 1.18.1, tested on network-attached persistent storage. The storage topology most K8s and managed-cloud deployments actually run on. Not local NVMe. The gap is disk access. DiskBBQ searches a compact quantized index and limits full-precision reads. Qdrant rescores against original vectors on disk. On network-attached storage, those random reads get expensive. Elasticsearch latency: 120 to 150ms across recall levels. Qdrant: 315ms to 900ms as recall increases. Benchmark tool, dataset, and configs are all published below.
Elastic tweet media
English
5
5
18
3.6K
Elastic
Elastic@elastic·
@timestamp TL;DR: - Queries: up to 160x faster - PromQL runs inside ES|QL, same engine - Storage: 6.6x more efficient for OTel metrics - One platform: metrics, logs, traces, documents Full architecture deep dive with benchmarks in the blog: go.es.io/4xZeJ2p
English
0
0
2
533
Elastic
Elastic@elastic·
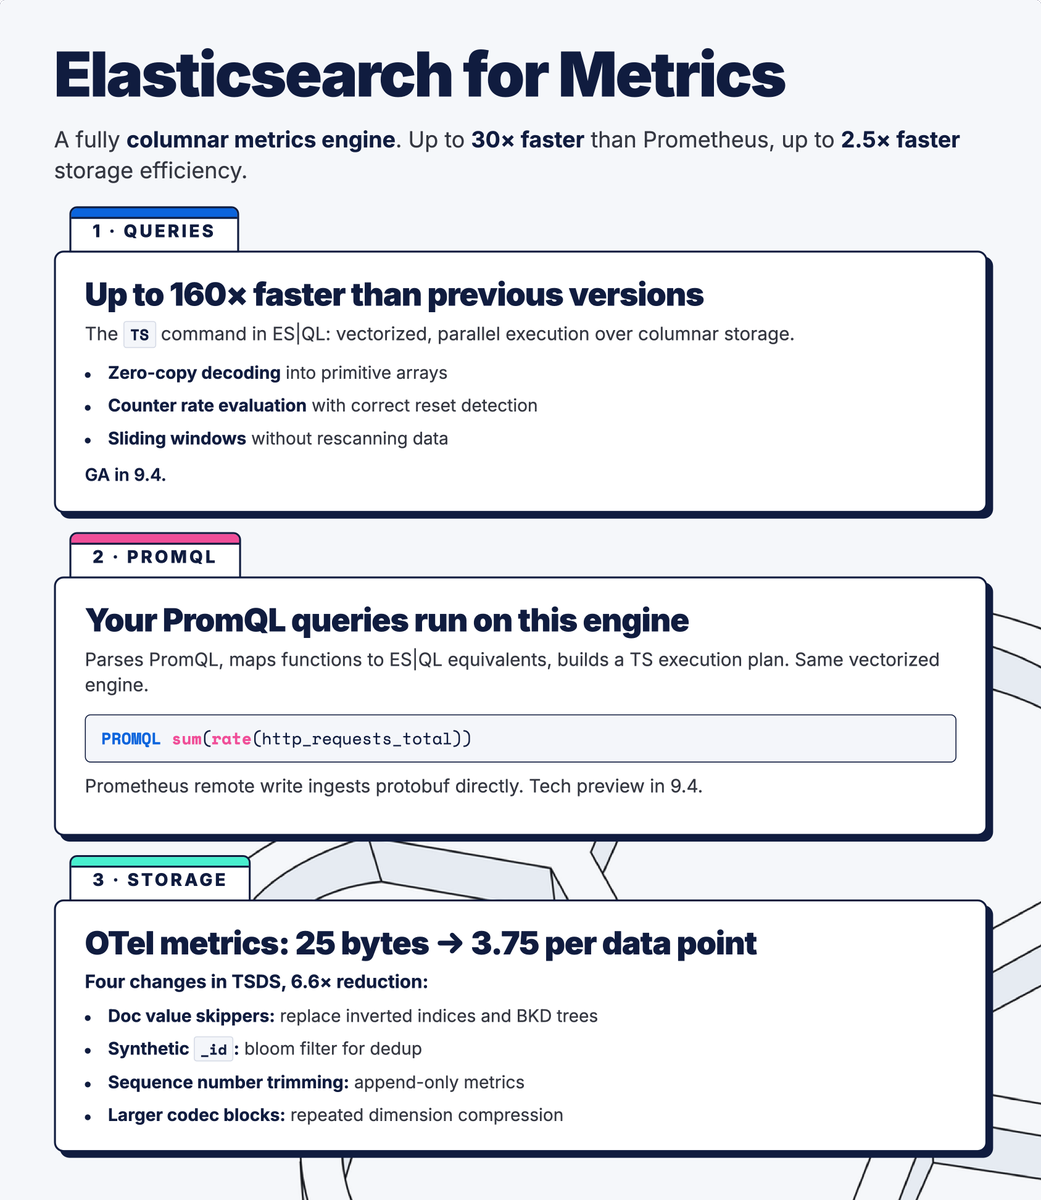
3/ Storage - OTel metrics: 25 bytes down to 3.75 per data point. Four TSDS changes cut storage by 6.6x: - Doc value skippers: replace inverted indices and BKD trees - Synthetic _id: derived from _tsid and @ timestamp, bloom filter dedup - Sequence numbers: trimmed at merge time once the global checkpoint passes - Larger codec blocks: compress repeated dimension values 21 bytes cut. Each change independent.
English
1
0
3
706
Elastic
Elastic@elastic·
🧵 Elasticsearch now queries time series metrics up to 160x faster than previous versions. TSDS and ES|QL were rebuilt over the past year. Three areas changed: storage, queries, and Prometheus compatibility. The result: - A fully columnar metrics engine. - OTel indexing throughput is up to 50% higher. - Storage for OTel metrics dropped to 3.75 bytes per data point.
Elastic tweet media
English
18
13
122
2.3M
Elastic
Elastic@elastic·
Full walkthrough of the architecture, benchmarks, and migration paths: go.es.io/443CnNv
English
0
0
3
920
Elastic
Elastic@elastic·
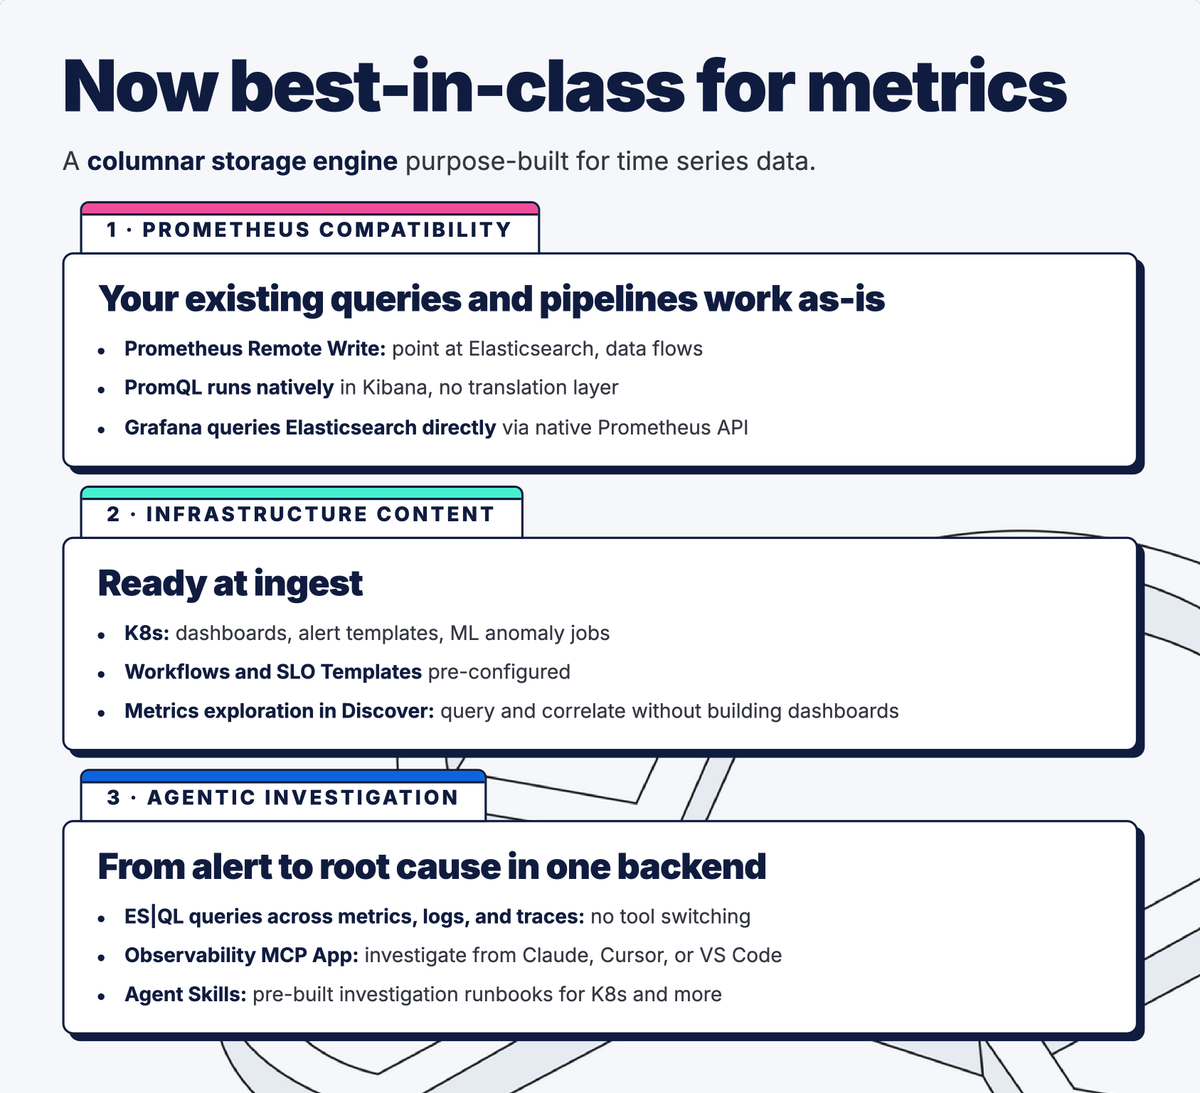
Up to 30× faster than Prometheus on gauge averages and counter rates. Up to 2.5× more storage efficient than Prometheus. That's ES|QL running on a new columnar storage engine purpose-built for time series data. Cost approximately 50% less than Datadog. No custom metric penalties. What landed: - Prometheus Remote Write and native PromQL in Kibana: existing queries, dashboards, and alert rules work as-is - OOTB K8s and AWS content at ingest: dashboards, alert templates, ML anomaly jobs, Workflows, and SLO Templates - ES|QL time series queries across metrics, logs, and traces in one backend - Agentic investigation via Observability MCP App and Agent Skills: run structured investigations from Claude, Cursor, or VS Code Every metric at full resolution. No forced rollups. No surprise invoice at the end of the month.
Elastic tweet media
English
20
9
147
3.9M