
full armored
340 posts
full armored
@elfulldearmor
polymarket enjoyer
Toronto, Ontario Katılım Ekim 2020
139 Takip Edilen52 Takipçiler
Everyone is sleeping on this absolute banger:
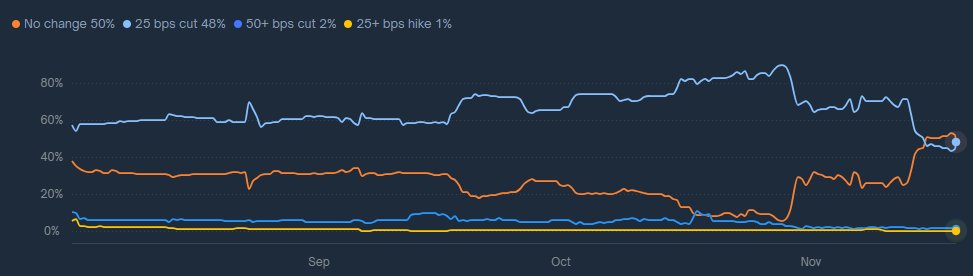
Fed December meeting — crowd just flipped to 55% NO CUT (up from 27% last week).
Inflation data hotter than expected. I’m loading No Cut shares hard
English
🚨 Polymarket alpha alert 🚨
My early play:
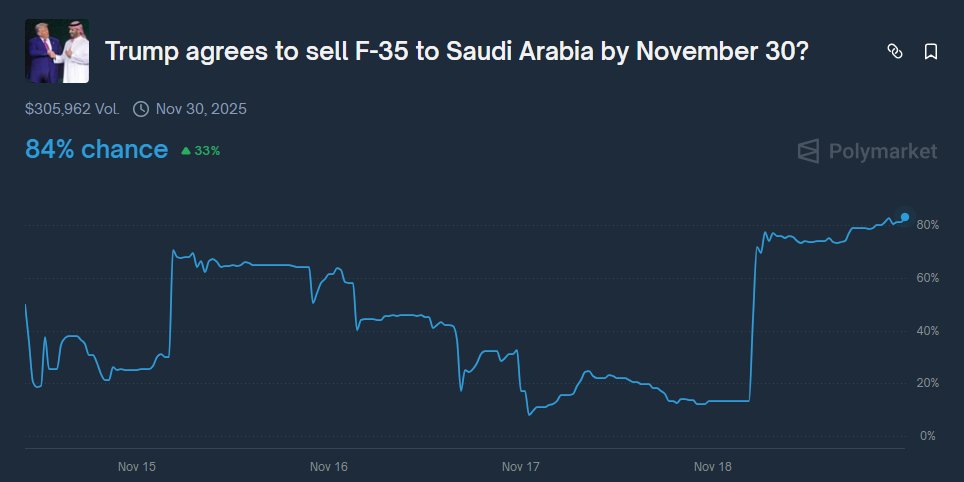
“Trump agrees F-35 sale to Saudi by Nov 30” → 81¢ Yes
Reason: Saudi delegation in DC this week + Trump already told advisors he wants the deal done before Christmas. Feels heavily undervalued
English


@sayinshallah Pls don’t forget 2b+ for community 👆 community first
English

You already raised $244M, how much more are you trying to milk your community for? It's been 3+ years lol
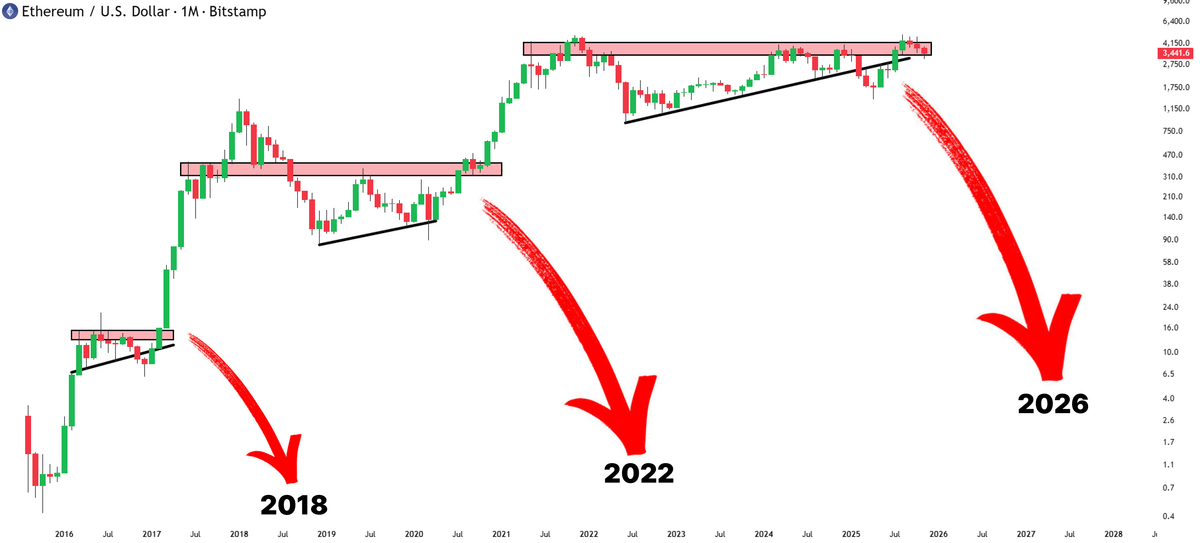
This is the most bearish thing I have ever seen for any chain
zoomer@zoomerfied
[ ZOOMER ] COINBASE TO LAUNCH PLATFORM FOR TOKEN SALES, FIRST ICO TO BE MONAD NEXT WEEK
English
full armored retweetledi

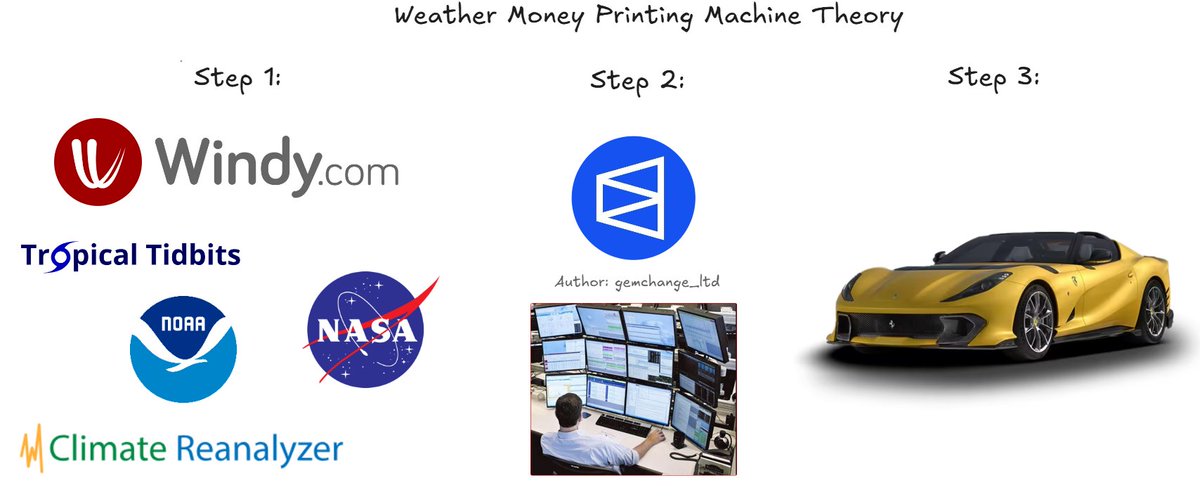
Found a Money-Printing Machine on the Weather Markets
$2.4M is being bet on weather events right now. Here’s a universal manual on how to analyze ANY weather market and profit from it.
On Polymarket, there are markets for hurricanes, temperature records, droughts, snowfalls.
Smart traders don’t guess the weather - they trade the gap between crowd emotion and real data.
Universal System for Analyzing Weather Bets
Step 1: Find the Objective Resolution Source
Open the market’s conditions. Find where the resolution data comes from.
The best markets use:
- NOAA (National Oceanic and Atmospheric Administration)
- NASA GISS (temperature indices)
National meteorological services
- WMO (World Meteorological Organization)
Government data sources = minimal manipulation.
Avoid markets that resolve based on "media consensus."
Step 2: Real-Time Core Tools
- Tropical Tidbits
tropicaltidbits.com
Not just for hurricanes. GFS and ECMWF models for any weather pattern - cold fronts, heat waves, rainfall. Updated every 6 hours.
- Climate Reanalyzer
climatereanalyzer.org
Universal tool: air and ocean temperature, rainfall anomalies, pressure - all in real time with historical context.
- Windy
windy.com
Interactive maps: wind, temperature, rain, snow, waves. Switch between 10+ models. Perfect for local events.
Step 3: Historical Data and Probabilities
- NOAA Climate Data Online
ncei.noaa.gov/cdo-web/
Web interface for historical climate data by location. Want to know how often Chicago hits >40°C in July? Over 100 years of data here.
- NOAA Climate API
ncdc.noaa.gov/cdo-web/webser…
For developers: temperature, precipitation, snow, wind - all downloadable by station. Build your own probability models.
Example:
Market: "Snow in Miami in December 2025" = 5%.
History: 0 cases in 150 years.
Real probability ≈ 0.01%.
-> Sell at 5%, hold until expiration.
Step 4: Forecast Models - Your Main Weapon
- Tropical Tidbits Models
tropicaltidbits.com/analysis/model…
Professional access:
GFS (US model)
ECMWF (European, most accurate)
CMC (Canadian)
When 3+ models agree -> high confidence.
When they diverge -> high uncertainty (and volatility).
- NOAA Weather Prediction Center
wpc.ncep.noaa.gov
Official forecasts for precipitation, temperature anomalies, extreme events (1–7 days). Perfect for short-term markets.
- Climate Prediction Center
cpc.ncep.noaa.gov
Long-term forecasts (weeks to months): ENSO, temperature anomalies, droughts. For seasonal markets.
Step 5: Specialized Tools
- For temperature markets:
OISST Database: ncei.noaa.gov/products/optim…
- Ocean temperatures drive air temperatures.
NASA GISS: data.giss.nasa.gov/gistemp/
Global temperature anomalies.
- For rainfall/drought markets:
NOAA Drought Monitor: drought.gov
Real-time drought maps.
- NOAA Precipitation Data: water.weather.gov/precip/
Accumulated rainfall data.
- For snow markets:
NOAA Snow Data: nohrsc.noaa.gov
Snow cover, analysis, and forecasts.
- For extreme events:
NOAA Storm Events Database: ncdc.noaa.gov/stormevents/
Historical records of tornadoes, hail, floods, etc.
Trading Strategy
Emotional Market Cycle:
Normal conditions -> market priced fairly
Models show a threat -> panic, odds spike
Event weakens or doesn’t happen -> odds collapse
Repeat
Weather markets are inefficient because 90% of participants trade headlines, not data.
You’re using the same tools as meteorologists and climatologists.
You’re not predicting the weather - you’re finding where the market is wrong.
Retail traders buy fear at high prices.
You sell them fear - and buy back reality cheap.
NFA. DYOR.
Trade on Polymarket
English

Just because Zcash was founded by a woman, does not mean it’s bad tech.
Zcash 🛡️@Zcash
"Privacy allows people to think freely. There's the space inside your head where you can basically think whatever you want and be fairly confident that no one is reading your mind. You can reason about the world and reason about what should happen in the world. @feministPLT #zcash $ZEC #privacyisnormal
English
@belfort_max no source proof = you are not gonna wake up tomorrow max
English

@HYPEconomist We got a 400% pump on the bald feminist coin before GTA 6
English

makes sense that the zcash founder likes privacy

English


🚨BREAKING: The crypto market added $156 BILLION in the last 7 hours.
Altcoins alone accounted for $81 BILLION.

English
@CryptoGFishere bet ur mom on this if u post such a bullshit
English