es.trapped | orderflow | ES

163 posts

es.trapped | orderflow | ES banner
es.trapped | orderflow | ES

es.trapped | orderflow | ES

@esXtrapped

TPO | AMT | orderflow | analysis | #ES_F | no financial advice

Zürich, Schweiz Katılım Nisan 2025
137 Takip Edilen457 Takipçiler
es.trapped | orderflow | ES
es.trapped | orderflow | ES@esXtrapped·
#ES_F Outlook - 18.03.2026 Today’s session was very clean and well structured, which makes the read on the market relatively straightforward. Looking at the overnight session, OVN inventory balanced itself out, meaning there was no strong directional conviction early on. This often sets the stage for a more structured move during the main session. After the open, we rejected exactly at my level, which clearly showed no acceptance in the previous value area. That rejection was important, because it signaled that the market was not interested in trading back into those prior prices. 
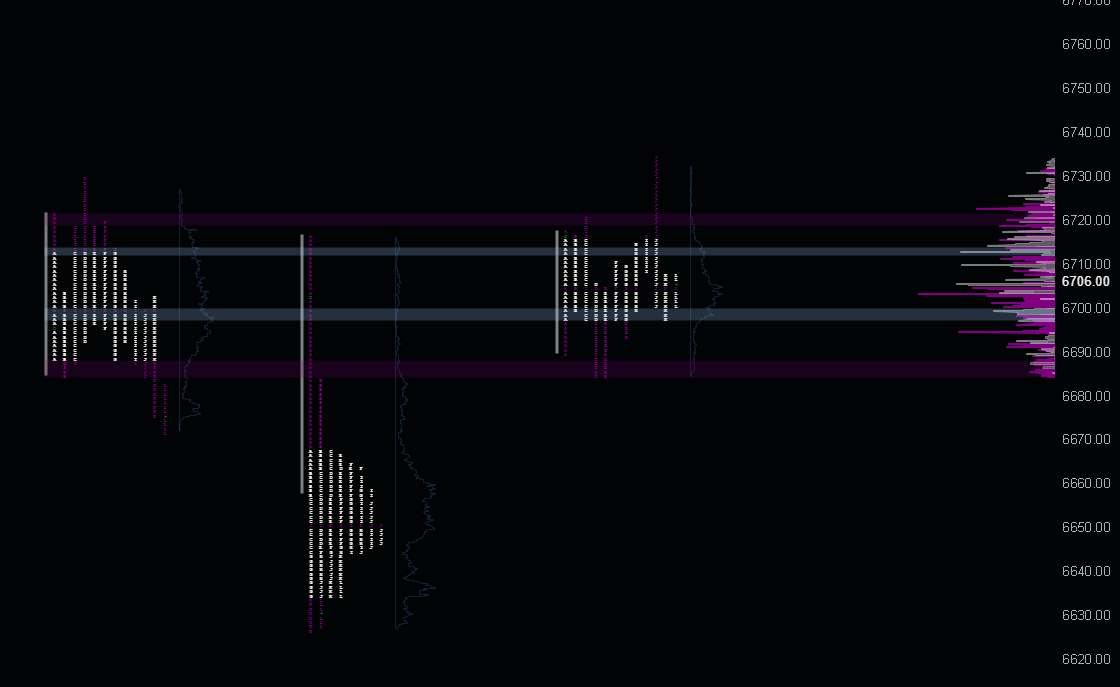
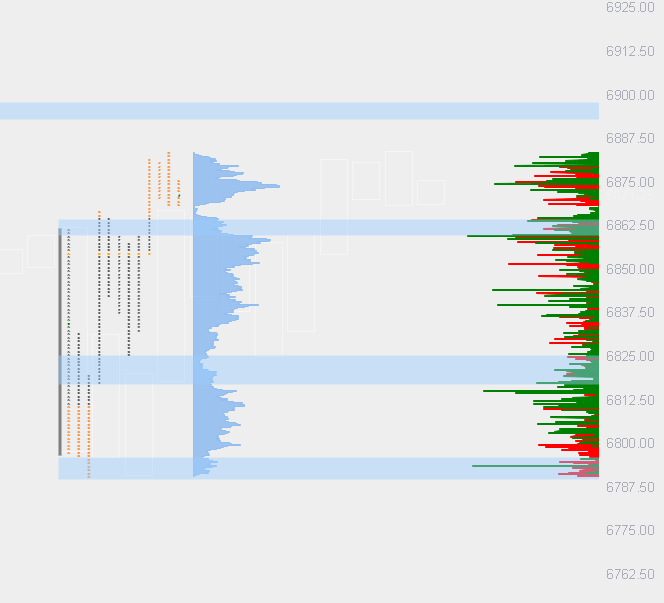
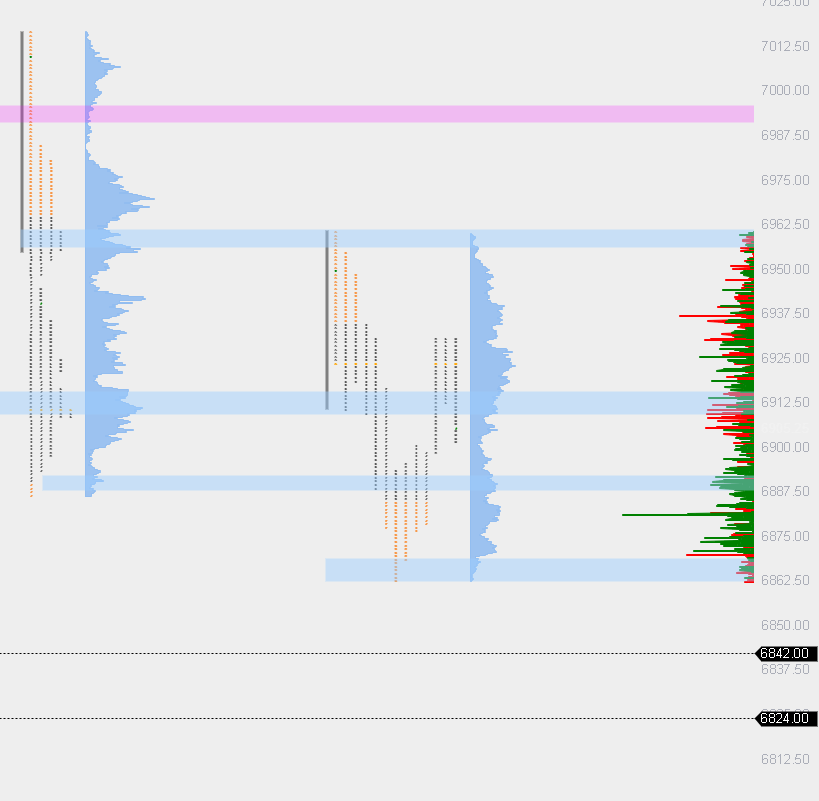
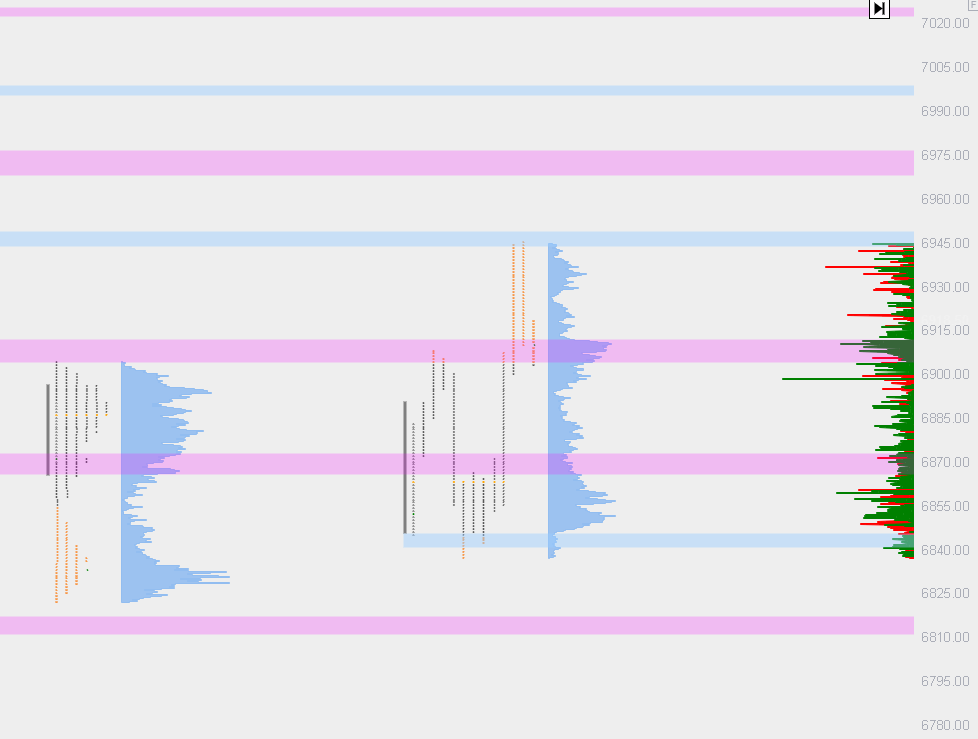
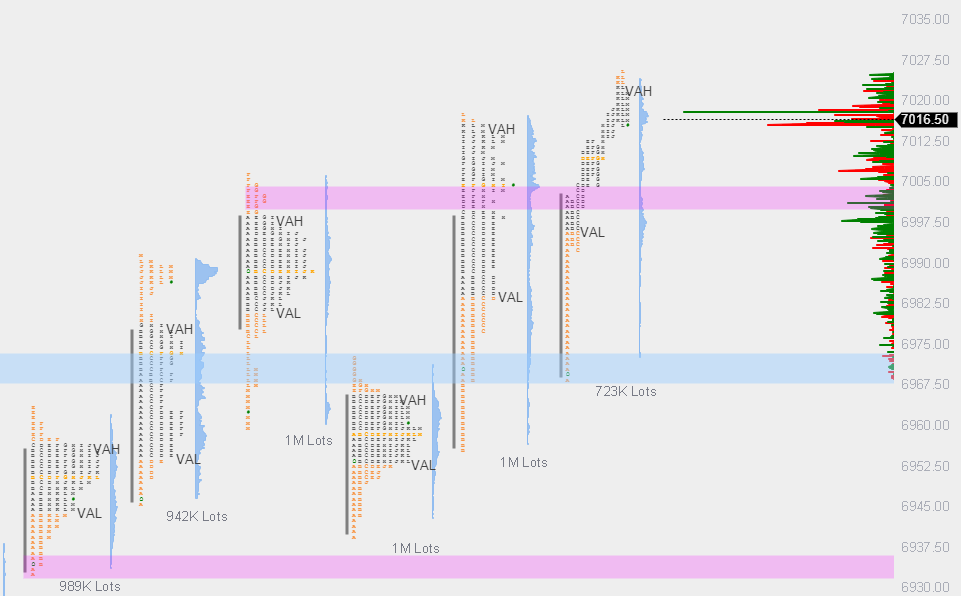
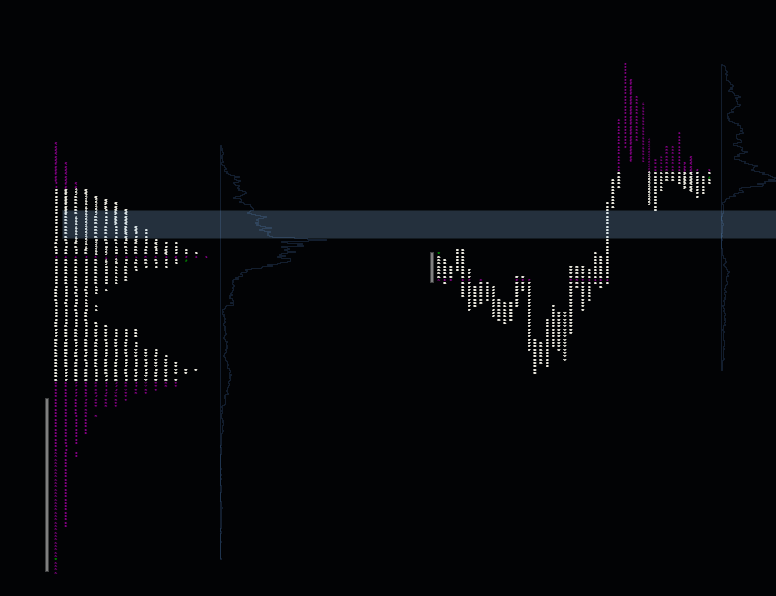
Following that, we began to establish acceptance at higher prices. This is a key observation — once the market fails to accept lower or prior value and starts holding higher prices, it indicates a shift in value. This shift is also very clearly visible on the daily TPOs (see image 1), confirming that the market is attempting to build a new area of agreement. Outlook for the Next Session Going into tomorrow’s session, the situation remains relatively simple and structured, but still requires attention to detail. 
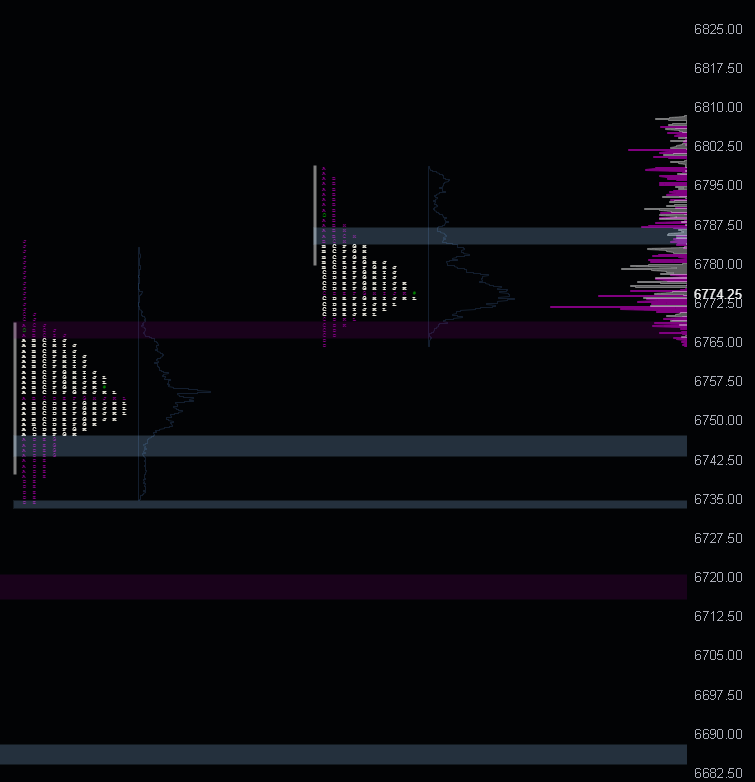
The most important level to watch is the zone around 6790–6764. This area represents the point where prior value was rejected, making it a key reference for future price action. If price returns to this level and we see a break with acceptance below, meaning time and volume building in lower prices, then the likelihood increases that the market will continue to rotate lower and establish value down there. In that case, lower prices become the new area of interest. On the other hand, if the market continues to trade higher, it becomes crucial to observe the behavior of buyers. Specifically, we need to see stronger, more aggressive, and committed buying activity above ~6787. It’s not enough for price to just trade above that level — we need to see: initiative buying continuation and clear reward Only then can higher prices be sustained and accepted. What to Focus On The reaction at 6790–6764 will be decisive A break and acceptance below → increased probability of lower prices Holding above and continuation → requires clear buyer strength above ~6787 Watch for acceptance vs. rejection, not just price touches At the end of the day, it comes down to one thing: Where is the market willing to accept price, and where does it reject it? Everything else builds on that.
es.trapped | orderflow | ES tweet mediaes.trapped | orderflow | ES tweet media
English
0
0
6
211
es.trapped | orderflow | ES
es.trapped | orderflow | ES@esXtrapped·
#ES_F Outlook 17.03.2026 After having to take care of some private matters, I’m now fully back. Let’s not waste any time and jump straight into the market outlook. As usual, we’ll leave the geopolitical and economic situation aside, because what matters here is what WE actually see in the market. Overall Market Context On the high-timeframe, the structure remains bearish. This means that the broader market bias is tilted to the downside. However, this does not mean that we can’t trade longs when the price action and orderflow give us the right conditions. Understanding the broader context allows us to recognize opportunities on both sides, rather than blindly assuming direction. Today, price spent most of the session within Thursday’s value area, which shows that the market respected that zone. Meanwhile, Friday’s prices were strongly rejected, demonstrating that higher levels did not hold and that sellers showed clear dominance at those points. During the NY POM session, we observed a massive spike, which signals that there is still presence at higher prices. Even though the HTF bias is bearish, buyers remain active and continue to defend key areas, which adds important context for short-term trading. Monitoring how the market reacts around these zones will be crucial for identifying potential continuation or reversal opportunities. Key Levels The main focus is on the violet levels, which represent the edge of value from Monday’s session. These levels are highly relevant because they indicate areas where price previously found agreement and where market participants showed strong conviction. The simplest play here is a break-and-retest of these violet edges. However, it’s not enough to just see price touch or break the level — what matters is what happens after the break. Value Discovery If a break-and-retest occurs, value discovery begins. This is a crucial concept for understanding the next moves in the market: For longs: we must see initiative buying with reward, meaning buyers actively push the price higher with conviction. For shorts: we must see initiative selling with reward, meaning sellers take control and push the market lower. Without initiative, a break or retest is meaningless. The market’s response at these levels is what defines the strength and sustainability of the move. Observing how buyers or sellers behave at the violet edges tells us whether price will continue higher, rotate back lower, or establish a new balance. How to Approach Trades Watch how price reacts within Thursday’s value area, because it sets the context for intraday balance. Observe Friday’s rejection for clues on where higher prices were not accepted. Focus on initiative activity at the violet edges, as this signals where new value is being discovered. The rest is straightforward: trade only when initiative confirms entries, stay aligned with HTF bias, and manage risk based on reaction and orderflow, not assumptions. Summary HTF is bearish, but tactical longs are possible. Price traded mostly in Thursday’s value area; Friday’s prices were rejected. NY POM spike indicates buyer presence at higher prices. Key levels: violet edges of Monday’s session, representing the edge of value. Trade logic: break → retest → initiative → reward. Watch reactions carefully, and only act when the market shows conviction. Keep it logical, simple, and disciplined. Let the market show where value is accepted or rejected, and wait for initiative with reward before taking any trades.
es.trapped | orderflow | ES tweet media
English
0
0
9
309
es.trapped | orderflow | ES
es.trapped | orderflow | ES@esXtrapped·
#ES_F Outlook - 25.02.2026 Levels were once again precise — bottom tick reaction. Buyers regained strength exactly where they needed to, and we are now rotating back into a short-term balance. After the downside move, the market found responsive buying and immediately showed follow-through, which shifts the short-term tone back to neutral-to-bullish. The key level for longs sits around 6870, which marks the edge of balance. This area now acts as the structural decision point. As long as: 6870 holds, we continue to see buying pressure, and that buying is rewarded with continuation, I remain bullish within this short-term structure. The logical upside objective inside balance is the opposite edge of value, around 6925. That is where the market will need to prove acceptance if buyers want further continuation. If 6870 fails with acceptance below and fresh initiative selling, then the short-term balance shifts and the bullish scenario is invalidated. Until then, the plan is simple: Defend the edge, trade rotation to the opposite side.
es.trapped | orderflow | ES tweet media
English
1
1
5
524
es.trapped | orderflow | ES
es.trapped | orderflow | ES@esXtrapped·
#ES_F Outlook - 24.02.2026 What we saw today was very interesting and, more importantly, very telling. The area where the market built most of its value last week was aggressively rejected. Once price rotated into that region, we saw a massive selloff. That alone already gives us important information: those higher prices were not accepted. What makes it even more interesting is the massive buying delta in the highs. There was significant aggressive buying — yet price did not continue higher. Now the real question is: Were large sellers passively absorbing all that buying and pressing the market lower? Or was it aggressive selling hitting into weak, late buyers and trapping them? Either way, the outcome is what matters: Those prices were rejected. And in Auction Market Theory, rejection at highs is never random. It tells us that the market does not currently perceive those prices as fair value. Current Structure Today we are building value inside the distribution from 17.02. That means the market is not in discovery mode — it is auctioning inside a previously established area of agreement. Because of that, the most important reference now becomes the 6870 area. This level is critical. If 6870 is protected, meaning buyers step in responsively and we see clear defense with absorption and buying strength, then the market can attempt to rotate higher within this distribution again. However — and this is important — if we see fresh initiative selling coming in at today’s lows, and 6870 fails to hold, the probability of a breakout into lower prices increases significantly. Acceptance below that level would signal that the market is no longer comfortable auctioning inside the 17.02 distribution. In that case, lower prices will need to be explored in order to find new value. Long Scenario If 6870 is broken to the downside but buyers want to step back in, we will need to see clear, convicted direction from buyers. Not small responsive bounces. Not weak short covering. But real initiative buying with follow-through and acceptance. Only then would long setups be valid. Without conviction from buyers, any bounce risks being sold again. Key Takeaways Last week’s value area was clearly rejected Massive buying delta at highs failed → strong indication of absorption or trapped buyers We are currently building value inside the 17.02 distribution 6870 is the key decision level Hold → rotation possible Break with fresh selling → continuation lower Keep it simple. The market already told us higher prices were rejected. Now we wait to see whether lower prices will be accepted — or defended.
es.trapped | orderflow | ES tweet media
English
1
1
12
523
es.trapped | orderflow | ES
es.trapped | orderflow | ES@esXtrapped·
#ES_F Outlook - 20.02.2026 Topticked today... levels precise again. View on market hasnt changed since monday, levels stay the same
es.trapped | orderflow | ES tweet media
English
0
0
7
376
es.trapped | orderflow | ES
es.trapped | orderflow | ES@esXtrapped·
#ES_F Outlook 19.02.2026 Levels stay the same, one more added, same logic as yesterday, payed out perfectly... level bottomticked today
es.trapped | orderflow | ES tweet media
English
0
0
11
403
es.trapped | orderflow | ES
es.trapped | orderflow | ES@esXtrapped·
#ES_F Outlook – 18.02.2026 After the selloff at the open, we saw a strong reclaim, and the market is now attempting to build value at higher prices. Right at the open, we rejected / exhausted at the previous day high. That rejection led to an initial push lower, but what’s important is what happened after. Instead of continuation selling, we found fresh buying strength at lower prices. Sellers failed to press the move, and buyers stepped in aggressively. That shift in orderflow changed the short-term structure. Since then, price has been holding in higher territory, which indicates renewed buying interest. When lower prices are rejected and the market quickly reclaims prior levels, that’s often a sign that the selloff was more about positioning than true initiative selling. Now the focus shifts to the most important reference points — and they all come from today’s session: VAL (Value Area Low) As long as we hold above it, buyers maintain control. A break and acceptance below would shift the tone back to neutral or even bearish. VAH (Value Area High) This is the immediate upside acceptance test. If we continue to build time and volume above it, it confirms that higher prices are being accepted. 6895 zone This becomes the upside target if buying strength persists. If buyers continue to defend dips and we see initiative activity pushing higher, this level is the logical next reference. The key question going forward is simple: Are buyers willing to continue defending higher prices and build value above today’s range? If yes, continuation is likely. If not, and we rotate back into value with acceptance lower, expect balance behavior. As always — watch acceptance, not emotion.
es.trapped | orderflow | ES tweet media
English
2
0
14
571
es.trapped | orderflow | ES
es.trapped | orderflow | ES@esXtrapped·
#ES_F Outlook – 11.02.2026 Once again, today’s levels played out perfectly. From the open, we saw a clean move of roughly 130 ticks directly from my reference, which is another reminder why the key is to keep the process logical, simple, and repeatable. No prediction, no overthinking — just structure and execution. Coming into the new outlook, the bigger picture is fairly straightforward. Throughout today’s session, we traded predominantly within the previous day’s value, while at the same time continuing to show acceptance at higher prices, at least for now. There was no meaningful initiative selling, and pullbacks remained controlled, which tells us that buyers are still willing to defend elevated prices. What stands out structurally is that we now have clear brackets on both sides of value. This puts the market back into a classic AMT decision state: we are no longer in guessing mode — we simply observe where acceptance develops. If acceptance builds above value, the play is continuation to the upside, following the auction into higher prices. Buyers have already proven they are active, so as long as value migrates higher, fading that strength makes little sense. If, on the other hand, price fails to hold above value and acceptance forms back inside or below it, then the focus shifts to rotating through the range and trading back toward the opposite edge of value. In that case, patience and confirmation are key, as rotations tend to be cleaner and more balanced. The plan remains unchanged: Identify where the market accepts Align with the direction of value Trade continuation, not opinion No bias, no prediction — just follow the auction.
es.trapped | orderflow | ES tweet media
English
1
0
6
339
es.trapped | orderflow | ES
es.trapped | orderflow | ES@esXtrapped·
#ES_F Outlook – 10.02.2026 With today’s session, we are once again moving into higher prices and clearly showing signs of acceptance. The auction is rotating upward in a controlled manner, and buyers continue to show initiative. However, because the overall HTF structure currently does not offer clean, untouched levels, it becomes even more important to work with references from the previous session and let the most recent auction guide us. One of the most important areas to focus on is the 6960 region. With the impulsive push through this level, the market re-entered the upper range, which immediately makes this area a key reference if price were to rotate back into it. This zone is especially relevant because it was accompanied by high activity and a significant amount of trapped sellers, which can often lead to strong reactions on a retest. If we revisit this area, the way price behaves there will be critical in determining whether buyers remain in control or if we see a deeper rotation. The next important level sits around 6972–6977. This area acts as a separator between a one-time-framing uptrend and true acceptance at higher prices. Holding above this zone would indicate that buyers are not only pushing price higher, but are also willing to defend these elevated prices, which is a key characteristic of a healthy continuation move. This is exactly what we observed today: pullbacks were either aggressively bought or selling interest was nearly non-existent, both strong signs of buyer strength and confidence. Another zone that cannot be ignored is the 6995 area. This level differentiates a range within the ATH region, an area that has historically acted as support before flipping into resistance. Because of this role change, it becomes a crucial decision point for the auction. The key question here is simple but decisive: Do we break through this area and build acceptance above it? Only if the market can sustain value above 6995 does a move into the ATHs become realistic and structurally sound. Without acceptance, any move into that zone risks turning into a rejection or a failed breakout. Summary & Expectations Bias remains bullish as long as higher prices continue to be accepted 6960 is a critical support reference on a rotation lower 6972–6977 separates continuation from hesitation 6995 is the final decision point before ATH exploration Dips continue to be aggressively bought, with little to no meaningful selling pressure As always, the focus is not on predicting outcomes, but on reading acceptance versus rejection at key references. If buyers continue to defend these levels, higher prices remain the path of least resistance.
es.trapped | orderflow | ES tweet media
English
1
0
9
344
es.trapped | orderflow | ES
es.trapped | orderflow | ES@esXtrapped·
#ES_F Outlook – 05.02.2026 Today we witnessed a breakout from a short-term HTF balance around 6895 (see image 1). On first glance, this might look like a straightforward directional move, but the market immediately rotated back into value and even closed within the initial balance. This is a very important observation — it tells us that the breakout did not find sustained acceptance, and participants are still testing the auction. Breakouts alone do not indicate direction; what matters is how the market reacts once it reaches or exceeds key edges. Because of this, tomorrow’s levels remain relatively clear and actionable, but the key is context, orderflow, and confirmation. Intraday Scenarios 1. Downside / Shorting Opportunities: If the market approaches today’s breakout area and acceptance above it fails, this could set up high-probability shorting opportunities. The first target would be today’s buying tail, which represents the earliest point where buyers aggressively stepped in to defend price. Beyond that, 6842 becomes the next logical target. This level has historically acted as a responsive support, where buyers previously absorbed selling, and it often functions as a natural intraday pivot. If price continues to rotate lower, 6824 is the subsequent downside reference, another area with strong historical relevance due to prior rejections and responsive buying. These levels are not arbitrary. They represent zones where the market has historically shown rejection of lower prices, meaning any rotation toward them often provides high-probability entries for countertrend or balance trades. 2. Upside / Long Continuation: If the market accepts today’s breakout and holds above the 6895 region: The first upside target is today’s selling tail, printed right after the open. This tail represents early aggressive buying followed by immediate seller reaction, making it a high-value reference zone for intraday continuation trades. Acceptance above the selling tail would indicate that buyers are willing and able to pay higher prices, potentially leading to exploration toward 6960 and even 6970 if initiative buying remains strong. The key here is not to chase price but to wait for confirmation. Only when acceptance and volume align do we have meaningful structure to trade from. Orderflow Observations What stands out in today’s session is the extreme aggression in both buying and selling, which is clearly visible in the delta spikes (see image 2). On the upside, buyers showed repeated willingness to step in on pullbacks, as seen in strong buying tails that repeatedly defended higher intraday levels. On the downside, aggressive selling at breakout extremes caused temporary rotations, but each push lower was quickly absorbed by responsive buyers. This kind of high-conviction delta activity is exactly what defines edges and reference points. Every spike tells a story: where buyers are confident, where sellers tried to exert pressure, and where the market may rotate next. Key Takeaways: The strategy for tomorrow is straightforward but requires discipline: Trade edges back to value: As long as price remains in today’s fair value, use extremes for intraday rotations. Watch breakout extremes carefully: The reaction at the 6895 breakout area will define tomorrow’s directional bias. Acceptance above = continuation to 6960 / 6970 Rejection = rotation to today’s buying tail → 6842 → 6824 Pay attention to delta and volume confirmation: Look for aggressive, responsive buying or selling — this is where true market conviction lies. Keep it simple: The levels themselves provide structure, but the edge comes from reading how the market behaves at those levels. Don’t guess, wait for confirmation. Summary of Key Levels: Upside Targets: Today’s selling tail → 6960 → 6970 Downside Targets: Today’s buying tail → 6842 → 6824 Critical HTF Reference: 6895 breakout zone — watch for acceptance or rejection Orderflow Note: Massive delta spikes indicate areas of strong commitment — these define the edges and give context to all trades In short: edges define opportunity, orderflow defines conviction, and confirmation defines execution. Tomorrow is all about how the market reacts at the breakout and whether buyers continue to defend higher prices or sellers regain control.
es.trapped | orderflow | ES tweet mediaes.trapped | orderflow | ES tweet media
English
0
0
6
343
es.trapped | orderflow | ES
es.trapped | orderflow | ES@esXtrapped·
#ES_F - Outlook 04.02.2026 Levels almost remain the same, if you have any questions, feel free to ask.
es.trapped | orderflow | ES tweet media
English
0
0
5
299
es.trapped | orderflow | ES
es.trapped | orderflow | ES@esXtrapped·
ES - Outlook 28.01.2026 Going into Wednesday’s session, the market is positioned at a very sensitive and important area. We are trading just below / around the ATHs, which from an AMT perspective automatically places us at a major higher-time-frame resistance and edge of value (see image 1). These areas are never about guessing direction - they are about reading the auction and understanding whether the market is accepting or rejecting higher prices. From the bigger picture, the structure remains clearly bullish. We continue to see higher value, strong initiative activity from buyers, and very little evidence of sustained seller control. However, being this close to ATHs means the market now needs to prove that it can continue higher. The next move will be defined by behavior, not by levels alone. Scenarios for Long Continuation For bullish continuation, there are two main scenarios I am watching closely: 1. Impulsive breakout with acceptance above ATHs The strongest signal would be a clean, impulsive breakout through the ATHs, driven by initiative buying. This needs to be followed by acceptance above the highs, meaning price holds above the breakout area and starts building value there. Acceptance does not require immediate continuation - even slow rotation and time spent above the highs would already be a strong indication that the market is comfortable at higher prices. This would confirm short-term acceptance and open the door for continuation in the direction of the trend. 2. Break and retest with fresh buying The second bullish scenario is a break through the ATHs followed by a pullback. What matters here is how the pullback behaves. If price pulls back slightly and we see fresh, aggressive buyers stepping in at higher prices, forming buying tails and quick rotations back up, that would confirm that former resistance has flipped into support. This type of behavior shows confidence from buyers and usually leads to further price discovery. If Rejection Occurs at the ATHs If neither of these scenarios materializes and we instead see clear rejection at the ATHs, the approach changes - but carefully. Given the current context, I would treat shorts very conservatively. The market is still structurally bullish, and fading strength at ATHs requires strong confirmation, such as failed auctions, lack of follow-through, or aggressive seller response. Any short trades in this area would be counter-trend, tactical plays, not swing ideas. Expectations should be reduced, and risk management becomes even more important. Intraday Structure and Orderflow Context Looking at intraday key levels and structure (see image 2), the bullish bias is reinforced. On both Monday and today, the market open was highly impulsive, with strong buying pressure and almost no meaningful selling response. These opens were not immediately faded - instead, price held up and rotated at higher levels. Following these impulsive opens, we saw acceptance at higher prices, forming P-shaped profiles. This is a classic sign of short covering and initiative buying, where the market does not seek lower prices to find value. Instead, it accepts higher prices and continues to build value above prior areas. Another very important observation is the behavior on pullbacks. Pullbacks are being bought aggressively and quickly, with very little time spent at lower prices. This is visible through repeated buying tails, showing that buyers are active, responsive, and willing to defend price. Summary Overall, the auction remains clearly buyer-controlled. As long as we continue to see: Impulsive opens Acceptance at higher prices Shallow pullbacks with fast buying responses …the path of least resistance remains higher. Wednesday’s session will be all about whether the market can accept price above the ATHs, or whether we see another rejection that forces rotation before the next attempt. The levels are important, but the orderflow and acceptance/rejection behavior at those levels will decide the next meaningful move.
es.trapped | orderflow | ES tweet mediaes.trapped | orderflow | ES tweet media
English
0
0
4
319
es.trapped | orderflow | ES
es.trapped | orderflow | ES@esXtrapped·
#ES_F - Outlook 22.02.2026 Levels remain largely unchanged, and for good reason. The market has clearly rejected higher prices and is once again in the process of building value at lower prices. The overall structure has not shifted materially - what we are seeing now is a continuation of the same auction, just with new information added. Today’s spike to the upside, triggered by Trump-related news, is something that needs to be properly weighted tomorrow. News can create movement, but it does not automatically create acceptance. What matters is whether the market is willing to hold and develop value around these prices once the initial reaction fades. Going into the next session, the scenario is very straightforward and binary. If we reject today’s value, meaning price fails to hold and we see initiative buying stepping in again, then new buyers may be able to position themselves. In that case, the next upside references remain 6960, followed by 6970. Acceptance through time and volume above today’s value would be a clear indication that higher prices are once again being explored. On the other hand, if today’s value fails to hold and price rotates back into the prior value area, the focus shifts back to the downside. In that scenario, the most logical targets become the previous session’s tails, with the auction potentially extending all the way down toward 6817. Acceptance back into that older value would confirm that the market is not yet ready to sustain higher prices. This is why the current environment requires patience. The levels themselves are already defined - the real edge now comes from waiting for confirmation and reading how the market behaves at these areas, rather than anticipating a direction. This is a relatively short outlook today, simply because anyone who has followed the outlook from two days ago should already understand why these levels matter and how they fit into the bigger picture. Quick reminder: If you want to learn orderflow for free and understand this type of market behavior in real time, feel free to join my Discord community. The link is in my bio.
es.trapped | orderflow | ES tweet media
English
0
0
5
353
es.trapped | orderflow | ES
es.trapped | orderflow | ES@esXtrapped·
ES - Outlook 20.01.2026 After the massive dump we saw recently, ES has started to slowly grind higher again. This recovery is not aggressive, emotional, or driven by short covering alone - it is controlled, rotational, and very telling in terms of auction behavior. That already gives us important information: the market is no longer in panic mode, but it is also not trending impulsively yet. We are currently in a decision phase. Going into tomorrow’s session, the day is actually relatively easy to evaluate - if we start with the bigger picture and don’t get lost in lower timeframe noise. Bigger Picture / HTF Context Looking at the higher timeframe structure (image 1), it becomes obvious that the market is attempting to re-enter and re-establish a higher timeframe range. After such a sharp gap-down, the auction always asks the same question: Are these lower prices being accepted as fair value, or are they being rejected? Right now, the most important reference to answer that question is the area around 6912–6907. This zone is not just a random price area - it represents a higher timeframe edge of value. Historically, this region has shown low volume, buying tails, and responsive behavior, which tells us that this is where the market previously disagreed on price. Why this Level Matters If price can hold above 6912–6907 and build acceptance, meaning we see time spent above it and volume developing rather than immediate rejection, that tells us one thing very clearly: The market is no longer comfortable auctioning in lower prices. Acceptance above this level would confirm that the recent selloff was a liquidation event rather than the start of a sustained bearish trend. In that case, the auction naturally looks higher for unfinished business. Upside Scenario If acceptance holds above the HTF level, the next logical target becomes the UFA around ~6925, marked as the blue level in image 2. This area is critical because it represents unfinished auction activity - price moved through it too quickly in the past, without proper two-sided trade. If the market rotates into this UFA and we see continued buyer initiative, this is where momentum can start to build again. Acceptance above 6925 would strongly suggest that buyers are willing to pay higher prices and defend them. From there, the next upside reference sits around 6970, which aligns perfectly with the upper edge of value. This is important: Edges of value are where the market decides direction. If we reclaim and accept above that edge, the auction shifts back into higher prices, and the path toward prior highs opens again. This is not guessing. This is pure Auction Market Theory at work. Downside Scenario On the other hand, if price fails to hold above 6912 – 6907 and we see rejection - meaning aggressive selling, lack of follow-through from buyers, or fast rotations back below - then the attempt to re-enter the range has failed. In that case, the market is clearly signaling that higher prices are still unfair. The first downside reference would then be 6892. This level is important as a prior reaction area and a short-term balance reference. If sellers remain in control and acceptance cannot be built there either, the auction likely continues lower toward 6873, which is the next major area where buyers previously showed interest. Below that, the market would once again search for balance in lower prices until sufficient demand is found. Key-Takeaway: What stands out once again is this: Everything comes down to acceptance versus rejection at the edges of value. Not indicators. Not candle patterns. Not emotions or predictions. Direction is defined by how the market behaves at these key areas - and that behavior is best understood through AMT and orderflow, not price alone. So for tomorrow, the plan is simple: Acceptance above the HTF level → rotation higher and rebuilding of value Rejection → continuation of the auction into lower prices. If you still don’t understand why these levels matter or how they are derived, I highly recommend reading through my previous outlooks where this framework is explained step by step. And as always, if you have questions, feel free to leave them in the comments.
es.trapped | orderflow | ES tweet mediaes.trapped | orderflow | ES tweet media
English
0
0
12
356
es.trapped | orderflow | ES
es.trapped | orderflow | ES@esXtrapped·
ES - Outlook 16.01.2026 What we saw today is structurally very important, even though price did not trade directly into one of my predefined levels. This is a good reminder that levels alone don’t matter - behavior does. And today, the behavior after the open told us a lot about the current auction dynamics. Right after the open, the market developed a tight, short-term range. On the surface, this looked relatively calm, but internally it was anything but. Inside that range, we saw extremely aggressive buying, clearly initiative-driven. Buyers were actively lifting offers and attempting to push price higher. However, despite the effort, there was no continuation. Price failed to expand higher, volume did not translate into acceptance, and eventually that buying pressure collapsed into a long liquidation. This sequence is critical. When aggressive buyers enter the market and still fail to move price higher, it tells us one thing very clearly: There are still large sellers positioned in the highs, absorbing demand. At the same time, this does not automatically mean that sellers are now in full control of the market. What it does mean is that higher prices remain contested, and buyers are being tested heavily whenever price attempts to move up. This brings us to the most important reference going forward: the mid purple zone around ~6977–6972. This zone represents a higher-timeframe edge of value. Historically, this area has been characterized by low volume, repeated buying tails, and sharp rejections - all classic signs of responsive buying and rejection of lower prices. In previous auctions, buyers have clearly defended this area and used it as a base to rotate higher. Now, however, context matters. The market has changed, and the question is no longer whether this level mattered in the past - the question is: Will buyers defend this level again under current conditions? If we rotate into this purple zone and see: responsive buying, absorption of sell pressure, and quick rejection of lower prices, then this level remains valid. In that case, the next upside reference becomes the blue zone around ~7000–6995. Acceptance back into this area would signal re-acceptance into daily balance, opening the door for renewed participation in the highs and another potential attempt toward the ATHs. However, acceptance here must come through time and volume, not just a quick tag. On the other hand, if the purple zone fails, meaning price spends time below it and volume builds underneath, the auction changes materially. Acceptance below this HTF edge would indicate that buyers are no longer willing to defend this area, and that higher prices are being deemed unfair. In that scenario, the auction from January 14th becomes the next logical downside reference, as the market searches for a lower area of agreement. What makes this environment especially important is that relevant information was created today without price touching obvious levels. That tells us this is a market driven by positioning and inventory, not randomness. Key takeaways going into the next session: Aggressive buying failed in the highs Long liquidation confirms heavy seller presence above Buyers are still active, but under pressure ~6977–6972 is the key HTF decision zone Holding favors rotation back into balance and higher prices Acceptance below favors continuation lower toward Jan 14 references This is not a market for anticipation or bias. It is a market for patience, context, and confirmation. Let price come to the levels, watch how participants behave, and trade the reaction — not the idea. As always: structure first, orderflow second, execution last.
es.trapped | orderflow | ES tweet media
English
0
0
14
495
es.trapped | orderflow | ES
es.trapped | orderflow | ES@esXtrapped·
ES-Outlook 15.01.2026 In today’s session, we clearly rejected higher prices and, with that, also rejected the value that was established on Monday and further developed during Tuesday’s inside day. The auction attempted to hold those higher prices, but once we tested yesterday’s low, the market failed to find responsive buyers and instead transitioned into a strong, initiative-driven selloff. This behavior is important. What we saw today was not random volatility - it was a clear shift in acceptance. The market spent time trying to operate at higher prices earlier in the week, but today it became evident that those prices were deemed unfair, at least for now. Once the lower reference failed, sellers took control and pushed price aggressively lower, with very little resistance. For a session like today, the outlook for tomorrow simplifies significantly. We now have three major reference points that matter most going forward, and everything else is secondary. 1. The selling tail formed at the open Right at the open, we formed a clear selling tail. This area represents the first strong rejection of higher prices during today’s auction. From an AMT perspective, this zone is critical because it marks where initiative selling first entered the market. Any rotation back into this area tomorrow must be observed very carefully to see whether sellers remain active or if buyers attempt to reclaim it. 2. Today’s VAH: The VAH of today’s session is especially important because it overlaps with prior support, making it a structurally relevant level. This is a zone where the market previously found agreement, and today it acted as a transition point before the selloff accelerated. How price behaves around this level tomorrow will give very clear information about whether today’s selloff was merely a liquidation move or the start of a broader acceptance lower. 3. The massive unfinished auctions at the session lows: At the lows of today’s session, we printed significant unfinished auctions, which tells us that the downside move ended with urgency rather than balance. This leaves open the question of whether the market needs to revisit these lows to complete the auction, or whether responsive buyers will step in and defend them. The key takeaway here is simple but crucial: Important information was created at both extremes of today’s auction. That means tomorrow is not about prediction - it’s about confirmation. At the upper references, we need to see whether sellers defend and maintain control. At the lower references, we need to see whether buyers are willing to step in with strength or if the auction continues lower. Rushing trades in the middle of the range makes no sense in this context. The best opportunities will come from clear reactions at the edges, with confirmation through order flow, volume, and acceptance or rejection over time. As always, let the auction do the talking.
es.trapped | orderflow | ES tweet media
English
0
1
17
461
es.trapped | orderflow | ES
es.trapped | orderflow | ES@esXtrapped·
ES - Outlook 13.01.2026 Today’s levels were once again extremely precise, and today’s session was another clear reminder of why Auction Market Theory (AMT) is such a core component of my approach. The reactions we saw today were not random, and they were not coincidence. Anyone who struggled to understand today’s price action should revisit my previous outlook, because the context was clearly laid out in advance. Let’s move directly into the structure of the session and what it means going forward. Right at the open, we saw a strong and impulsive push to the upside. Buyers came in with clear initiative, while sellers showed very little willingness to step in. This initial move was not followed by immediate rejection or heavy absorption - instead, price transitioned into a slow, controlled grind higher. This type of behavior is critical to recognize: it shows buying follow-through, not just a short-term imbalance. Throughout the session, buyers consistently defended price at higher levels. Pullbacks were shallow, brief, and quickly bought. At the same time, every attempt to push price lower was met with fast rejection, often leaving clear tails. From an AMT perspective, this tells us that lower prices are being actively rejected, while the auction is attempting to discover and build new fair value higher. This is not aggressive trend expansion - it is something much more important: value migration. The market is testing whether these higher prices can be accepted over time. Now, this leads us to the key question for the next session: Can buyers continue to hold these prices and establish balance at higher levels? The most important reference going forward is the level from yesterday around ~6700. This level now acts as a major reaction zone. From an AMT standpoint, it cleanly separates rejected lower prices from the current value area. From a psychological standpoint, it also represents the point where buyer conviction became clear and sellers failed. As long as price remains above this zone, the assumption remains that buyers are in control. A session that ranges or balances above ~6700, with time and volume building, would be a strong indication that these higher prices are being accepted and that the market is comfortable operating here. However, if price were to rotate back toward this level, the quality of the reaction becomes critical. Fast rejection and responsive buying would reinforce the bullish thesis. In contrast, acceptance back below this level - especially with volume - would be the first warning sign that the auction is failing at higher prices. In summary: Buyers showed clear initiative and follow-through Lower prices were consistently rejected The market is attempting to shift value higher ~6700 is the key structural and psychological reference Acceptance above this level favors continuation Acceptance below it would shift the context As always, avoid prediction. Focus on acceptance vs. rejection, time and volume, and let the auction reveal the next move.
es.trapped | orderflow | ES tweet media
English
0
0
19
697
es.trapped | orderflow | ES
es.trapped | orderflow | ES@esXtrapped·
ES - Outlook 12.01.2026 Last week I wasn’t very active due to personal reasons, so let’s get straight into it. ES has now decisively broken and accepted above the 7000 level, which is not only a psychological milestone but also a structurally important one. While at first glance last week may appear relatively balanced, a deeper look into the structure, volume behavior, and auction dynamics reveals a very clear directional bias. Let’s start with the behavior at the lows, because this is where the most important information was given. Throughout the entire week, every attempt to move lower resulted in clean tails forming on the TPOs. These tails are not random - they represent strong responsive buying, meaning buyers consistently stepped in and rejected lower prices. The key takeaway here is simple: lower prices are currently being perceived as unfair. This observation is further confirmed by the volume distribution across sessions. Instead of seeing volume building lower or value migrating down, most sessions showed volume either balanced or skewed toward the upper end of the range. This is a classic bullish signature. If sellers were in control, we would see acceptance lower, volume building below key references, and follow-through after selloffs. None of that happened. Sell attempts lacked continuation and were repeatedly absorbed. Another crucial element is the higher-timeframe context. Over the past days and weeks, ES had been rotating inside a clearly defined HTF balance. That balance has now been broken to the upside, and price is actively trading outside of that long-term fair value. This changes the auction entirely. The market is no longer rotating within a known value - it is now testing whether higher prices can become the new accepted fair value. This brings us to the central question for the coming sessions: Are buyers willing to continue paying higher prices, and can they sustain those prices through time and volume? So far, the answer has been yes. Buyers have consistently defended pullbacks, absorbed sell pressure, and prevented any meaningful downside acceptance. As long as this behavior continues - meaning no strong initiative selling, no aggressive volume-led breakdowns, and no acceptance back into prior balance - the overall bias remains bullish. The most important HTF reference remains the balance area that has been discussed repeatedly (see image 2). If price were to rotate back into that balance, the last major structural reference sits around ~6930. Acceptance below that level, especially with time and volume, would be the first real signal that the bullish auction is weakening and that the market may be looking for a lower long-term value again. On the upside, continuation scenarios remain valid, but with one important condition: higher prices must be accepted, not just tagged. Acceptance requires time and volume. Fast moves higher that immediately stall or get rejected would be a warning sign. However, as long as pullbacks remain shallow and are quickly bought, the path of least resistance stays to the upside. From a practical trading perspective, the most interesting opportunities remain: Pullbacks into previously defended zones Areas where price sold off briefly but was immediately reclaimed, leaving clear tails Zones where buyers have already proven willingness to step in aggressively What you want to avoid is anticipation. Let price show acceptance or rejection. The market is currently in a phase where patience and context matter more than activity. To summarize the bigger picture: Market structure is bullish Buyers are in control Lower prices continue to be rejected Volume supports higher prices HTF balance has been broken to the upside ~6930 remains the key downside reference Continuation depends on acceptance through time and volume As always, let the auction develop. The market will tell us whether higher prices are fair - our job is simply to listen and react, not to predict.
es.trapped | orderflow | ES tweet mediaes.trapped | orderflow | ES tweet media
English
0
1
23
1.2K
es.trapped | orderflow | ES
es.trapped | orderflow | ES@esXtrapped·
ES - Outlook 08.01.2026 #ES_F pushing into ATHs shows that buyer gained strengt again after consolidating in a two day range last week. Currently we aporoach this area again which makes that level verry important. Plan ist simple: If we reject: longs towards ATHs If we accept: short towards other side if that balance.
es.trapped | orderflow | ES tweet media
English
1
0
9
587
Alva
Alva@ttomasalvarez5·
@esXtrapped Did you took some trades? My bias was bearish because of the OVN single print, didnt trade anything
English
1
0
0
31
es.trapped | orderflow | ES
es.trapped | orderflow | ES@esXtrapped·
#ES_F - Outlook 06.01.2026 not much to say tbh.. back into two-day value watch if we rotate inside or break out.
es.trapped | orderflow | ES tweet media
English
1
0
11
487