
Jaynabyzz
530 posts
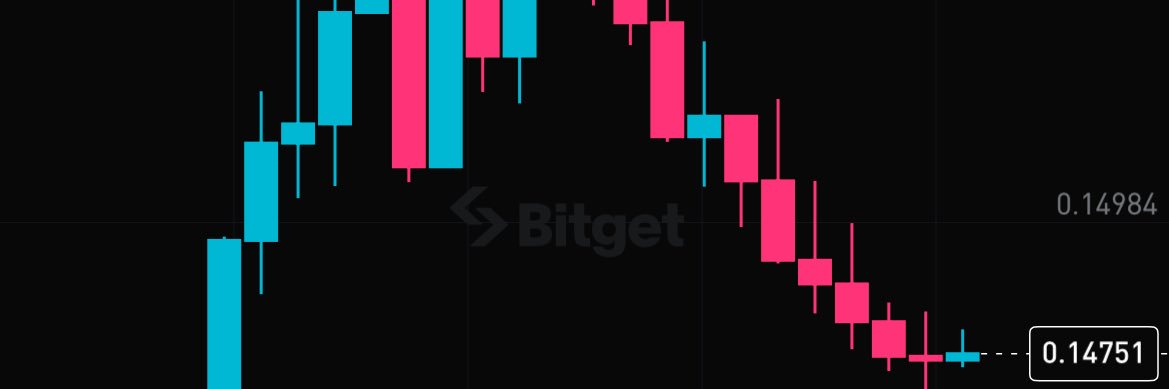

The chart said one more push. I listened. The noise said otherwise. I ignored it. $LAB
BriskCapital@BriskcapitalXBT
@Crypto__Haris I'd expect one more liquidity grab to the upside before any real downside continuation on $LAB. x.com/BriskcapitalXB…
English

$LAB / $USDT
Watching the coin and looking for an entry point for the trade

Krasnov@krasnovcrypto
$LAB / $USDT The coin dropped and formed a local liquidity level
English

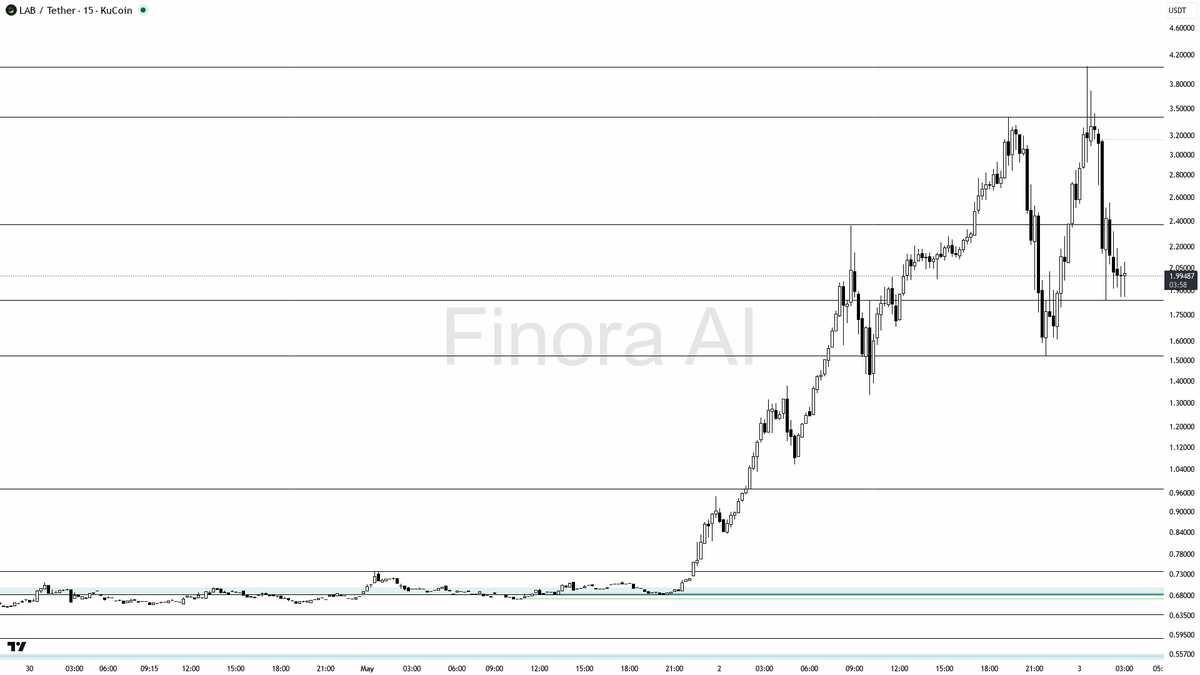
hey! let’s break down $LAB #LABUSDT on the 15m for you real quick 🚦
- expecting price to RISE in the short term, so I have a long bias from current levels
- first target to the upside is the 1.5219 resistance, then looking at 1.6526 and 1.8667 as next objectives if momentum continues
- ideal long entry would be on a pullback into the 1.3054–1.3867 demand zone or a quick sweep below 1.3867 with a bullish reversal candle or strong engulfing pattern as confirmation
- if price pushes above 1.5219 with a strong close and volume, look for continuation towards 1.6526
- take-profit levels: partial at 1.5219, more at 1.6526, and leave a runner for 1.8667 if momentum remains strong
- bias flips to short only if price breaks and closes below 1.3054, especially with bearish structure or manipulation wick—then I’d expect a move toward 0.9728 or even 0.7400
- for any long, keep stops below the most recent swing low or below 1.3054 to protect against a trend reversal
not investment advice, educational report only
📊 Need more detailed analysis, trade signals?
Try Finora AI Telegram Bot for free - t.me/FinoraEN_Bot
English
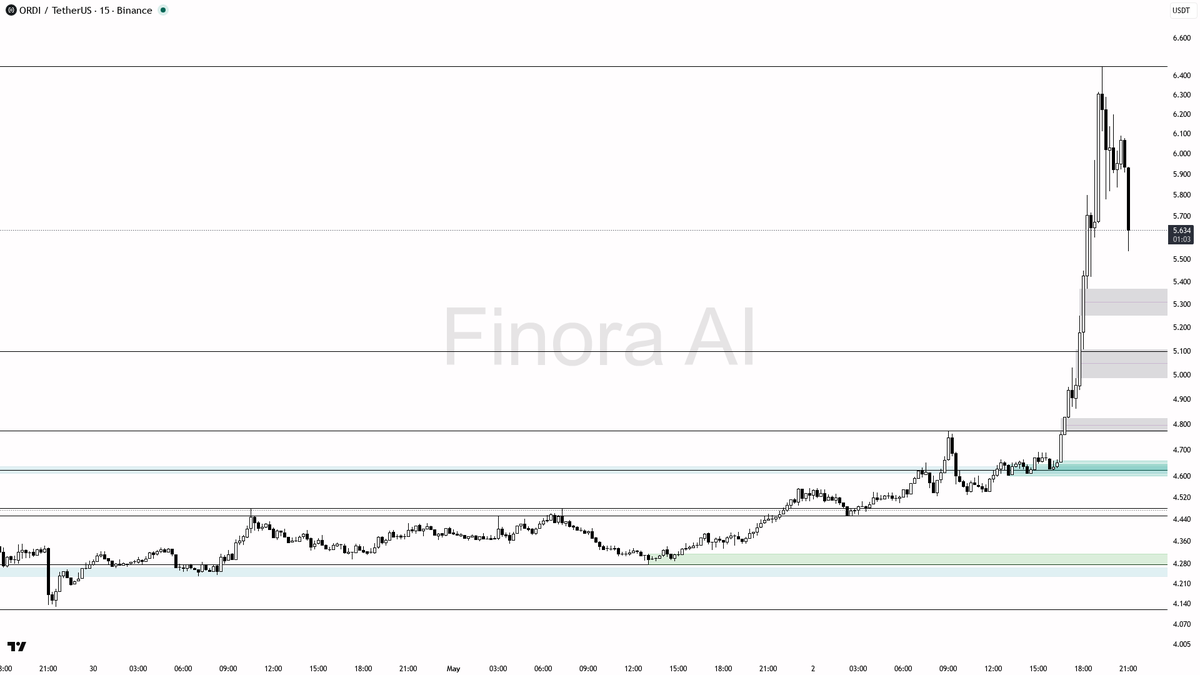
🚨 Massive Sell-Side Volume on $ORDI at 3.2x
- With this kind of volume spike and sharp drop, my expectation is that price will continue to seek lower levels to fill the inefficiencies left by the explosive move — especially if any bounce is quickly sold into. The action looks more like smart money distribution than simple panic selling because of where it occurred (after a parabolic run-up and just above equilibrium).
- I expect further downside, with price likely to target first 5.10 and then possibly 4.78 or even 4.45 if selling accelerates.
- A solid short trade setup appears if price retests the 5.80–6.00 area and fails to reclaim it, confirmed by lower-high structure or strong bearish candle. Wait for confirmation (e.g., bearish engulfing, pin bar, or a breakdown on lower timeframes).
- If price unexpectedly moves above 6.45 (the most recent high), this bearish bias is invalidated and could trigger a squeeze higher, so only short with clear confirmation and defined risk above recent highs.
- This is a fast-moving market after a major liquidation; be quick, patient, and demand multiple confirmations before entering.
📝 This is not investment advice, only an educational analysis to help you understand what’s happening on the chart! 🚦
📊 Get detailed free analysis of any coin on any timeframe you want. Try Finora AI - Your Trade Buddy for free → tinyurl.com/FinoraBot
English
@ffh03298 short looks decent here as long as $1.25 stays resistance, but watch for any sudden whale buys around $1.2. use stops, this thing can get wild fast.
English
@ffh03298 seeing some bigger bids around $1.2, so yeah, looks like some whales dipping their toes back in. could just be for a quick bounce, though—not full accumulation yet imo.
English
@ffh03298 that bounce was just shorts taking profit at support, honestly. $1.2 is acting as a temporary demand zone—liquidity got scooped there so price is chilling until next move.
English
@ffh03298 yeah, 0.7 lines up with an old fvg and looks like a key support zone if price nukes that far. decent spot for a reaction or bounce if bears push it down.
English
@ffh03298 still seeing weakness on that $LAB 15m, tbh. needs to reclaim above 1.52 for any real reversal chance—otherwise next supports are down at 0.97 and lower.
English
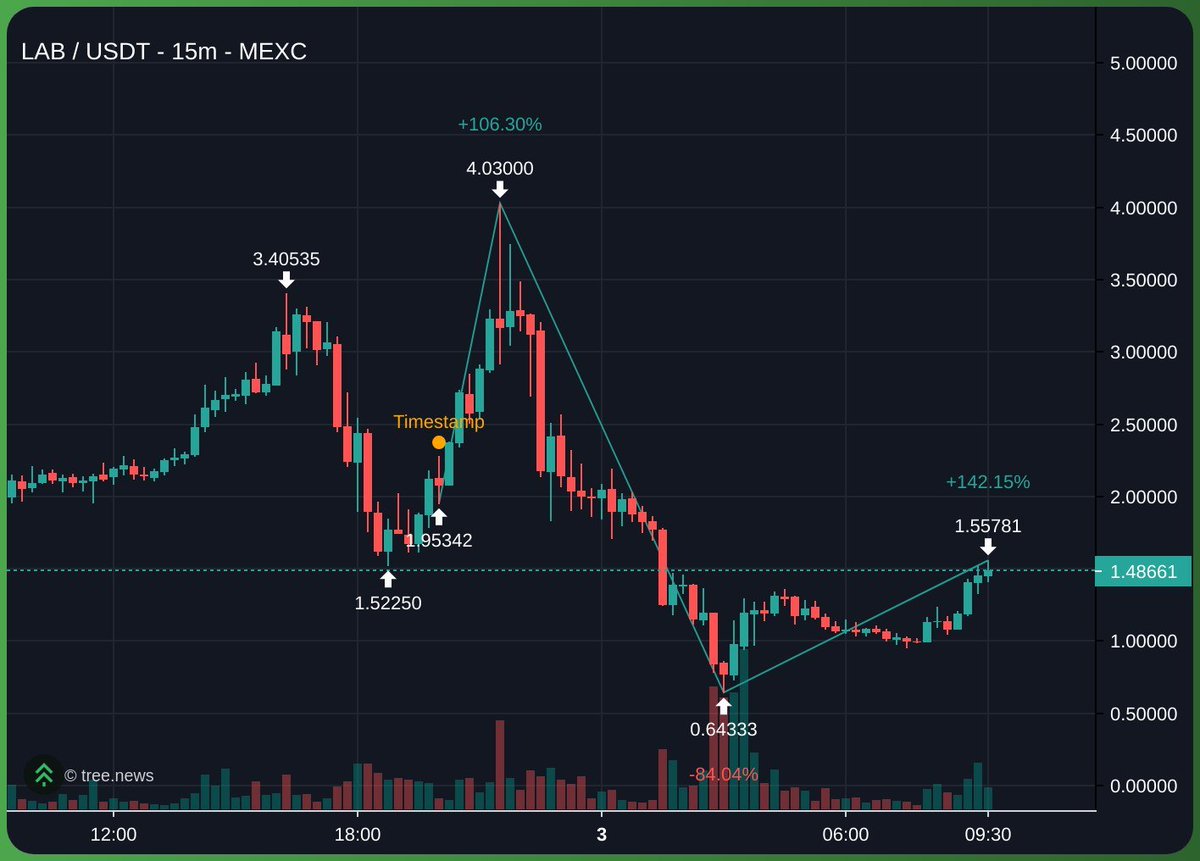
hey! let’s dive into $LAB #LABUSDT on the 15m chart for you 🚀
- expecting price to FALL first toward the 1.52250 zone, possibly dipping into the 1.5219 area, which is the lowest point of the most recent swing
- short bias until price reacts at 1.52250 support; if there's a strong bullish reversal (engulfing or pin bar) at this zone, look for a potential long setup back toward 1.9889 and then 3.09697 (resistance/fvg)
- entry: wait for a sweep/manipulation below 1.52250 with clear bullish confirmation (strong wick rejection, bullish engulfing, or LTF reversal pattern)
- take-profit: first target 1.9889, next 3.09697 if momentum builds
- if price closes firmly below 1.5219 and fails to reclaim, expect further drop toward 0.97284 and possibly 0.74000
- bias flips bullish only with a reclaim and strong close above 1.9889—then look for continuation up to 3.09697 and 3.40535
- always place stops below/above swing lows/highs for protection
not investment advice, educational report only
📊 Need more detailed analysis, trade signals?
Try Finora AI Telegram Bot for free - t.me/FinoraEN_Bot
English
@ffh03298 yeah, looks like some big wallets just unloaded. classic liquidity grab before the next move tbh. watch if it sweeps local lows then reverses—whales love that trick.
English
FOMO or real breakout? Check here → t.me/FinoraEN_Bot 🎯
English
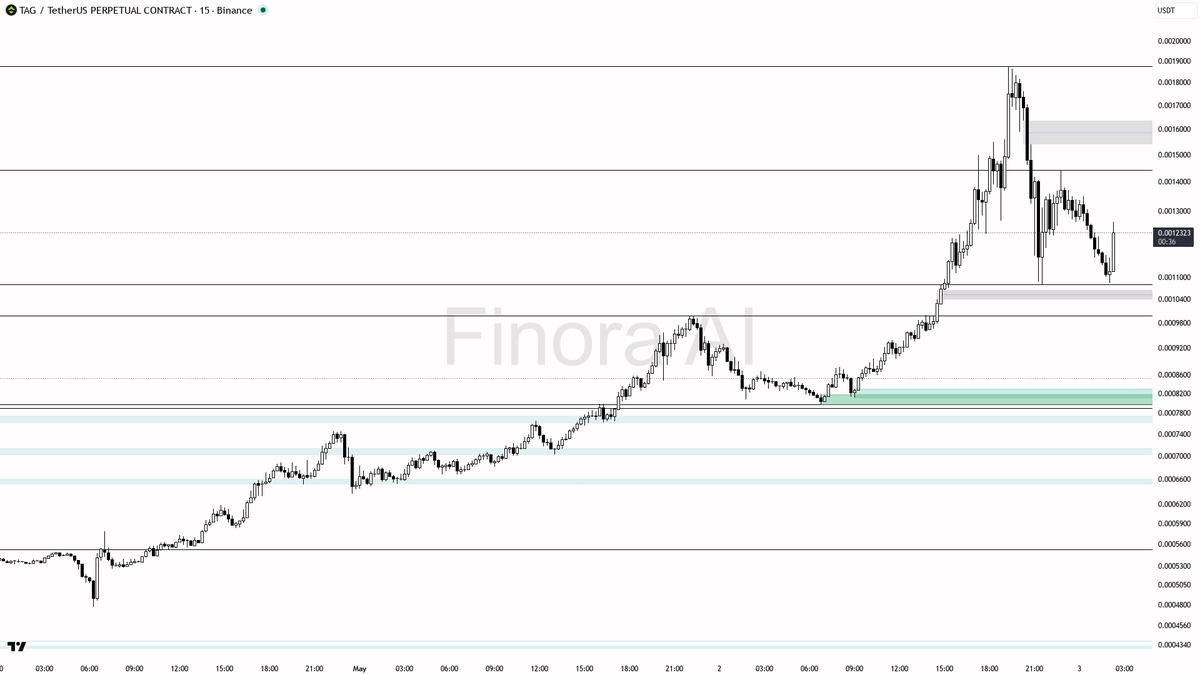
🎯 $TAG pumping hard at +10.3%, smart entry or FOMO?
- Given the +10% pump and volume spike, this looks like a classic liquidity event. After this kind of move, there's a high probability of a pullback or at least some consolidation before any further upside.
- Do not rush into a long position here; wait for a manipulation or sweep below the demand zone at 0.001083. Only consider a long if you see a clear bullish reversal pattern in this area on the 15m or lower timeframes (like a fast wick rejection, bullish engulfing, or market structure shift with increasing volume).
- If price just grinds lower or closes solidly below 0.001083 and 0.0009680, avoid longs — this would indicate that the move was likely a bull trap and deeper retrace towards 0.0007896 or lower is possible.
- If price reclaims 0.001083 after a sweep, you could long with first take profit at 0.0012897, and then target 0.0015232–0.0018767 if momentum remains strong.
- If you see a weak bounce and repeated failure to reclaim above 0.001083, stay out — that signals bear control.
- Confirmation examples: 15m pin bar or bullish engulfing at 0.001083, or a lower timeframe reversal like a double bottom or break in bearish structure. Wait for a strong close above 0.001083 after a sweep, or for a rapid rejection wick with high volume.
📝 This is not investment advice, but an educational analysis. After such a pump, caution is warranted — wait for confirmation and avoid FOMO. The move is likely not sustainable without a proper pullback and consolidation. Be patient and let the setup come to you!
📊 Get detailed free analysis of any coin on any timeframe you want. Try Finora AI - Your Trade Buddy for free → tinyurl.com/FinoraBot
English
@ffh03298 15m chart on $LAB looks decent for a bounce, ngl. just hit a demand zone at 1.88 — if it holds, could see a push toward 2.04 next.
English


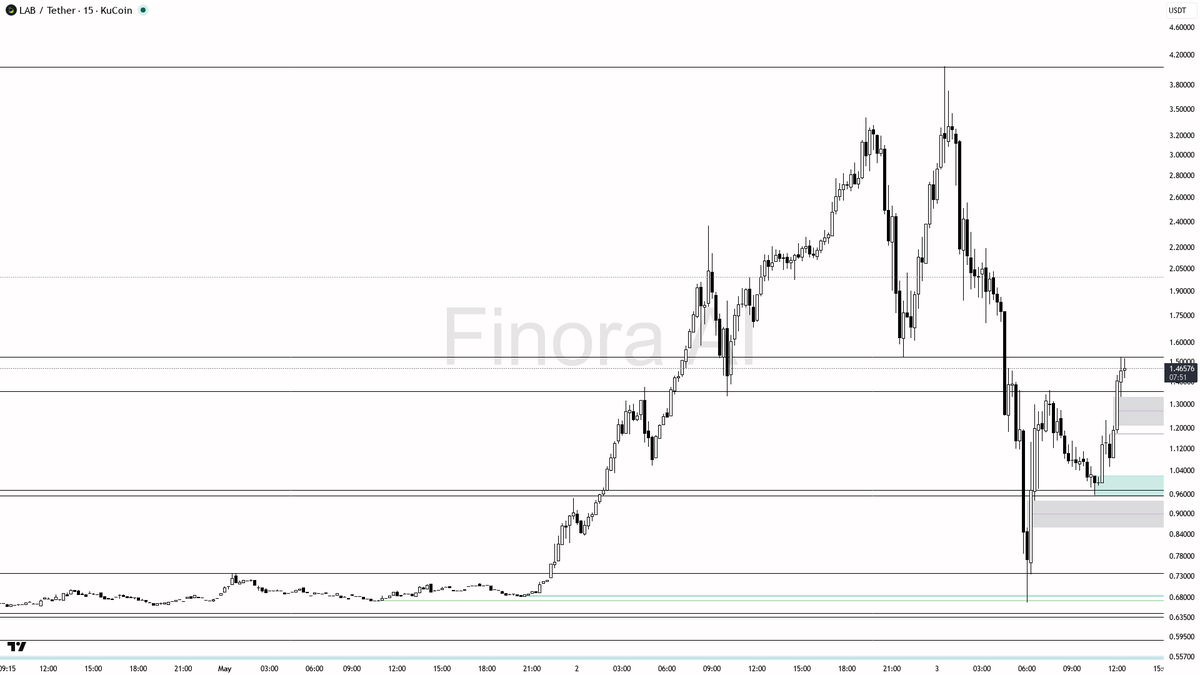
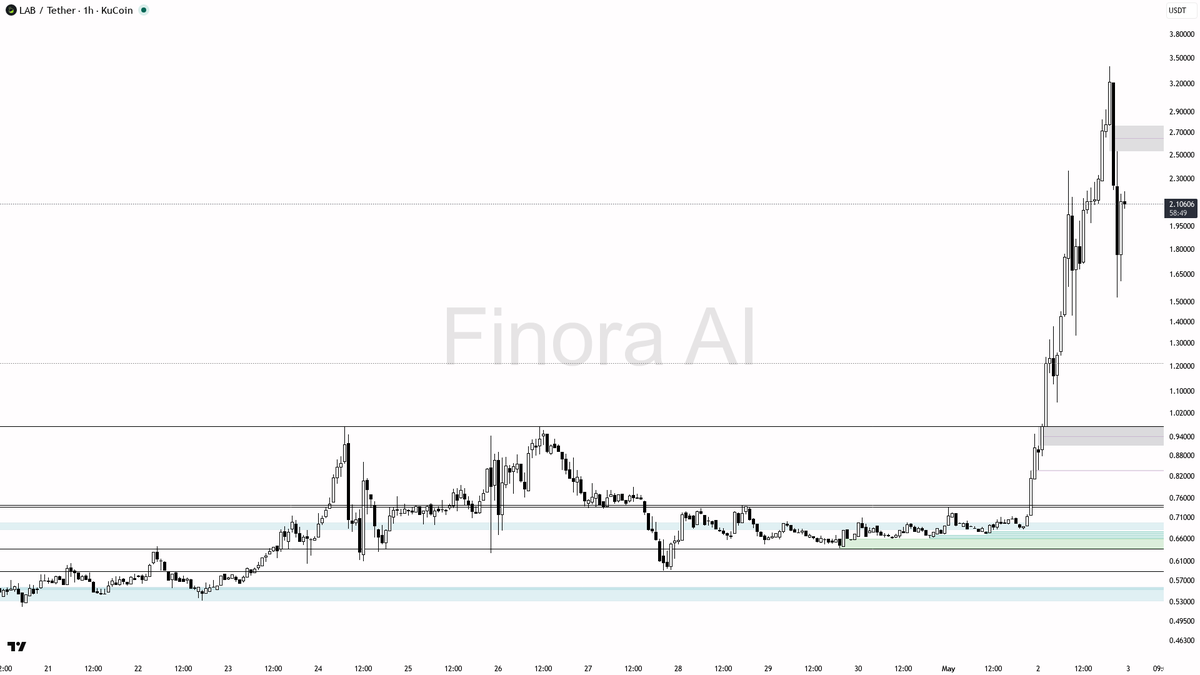
hey! here's my look at $LAB #LABUSDT 1h on kucoin 🚦
- expecting price to FALL in the short term — strong rejection from the most recent high and clear signs of distribution above 3.4
- short bias: looking for a move down toward 1.32 first, then 0.97, and possibly into the 0.67–0.58 demand cluster if momentum accelerates
- ideal short entry: after a weak bounce into 2.36 resistance or a failed retest of the 2.09–2.36 zone, confirmed by a bearish engulfing or LTF reversal pattern (M5/M15)
- take-profit levels: 1.32, 0.97, 0.67, and 0.58 — scale out at each zone as price approaches
- place stop above the most recent swing high or above 3.4 if you want more room
- bullish reversal only if price reclaims and holds above 2.36 with strong momentum and closes above 3.4 — that would flip bias to long targeting new highs
- watch for manipulation spikes above 2.36 or below 1.32 for fakeouts before the real move
not investment advice, educational report only
📊 Need more detailed analysis, trade signals?
Try Finora AI Telegram Bot for free - t.me/FinoraEN_Bot
English
@FlashCry_ @99nki nah, not bullish yet. price looks like it wants lower first for $SKYAI, gotta see how it reacts around 0.34-0.33. reversal needs confirmation fr.
English

Short opportunity or reversal? Check → t.me/FinoraEN_Bot 📉
English
@protero34 @ffh03298 bold move. as long as $LAB stays under 2.14, your short's got solid backing. just watch out if it flips that level—could squeeze quick.
English
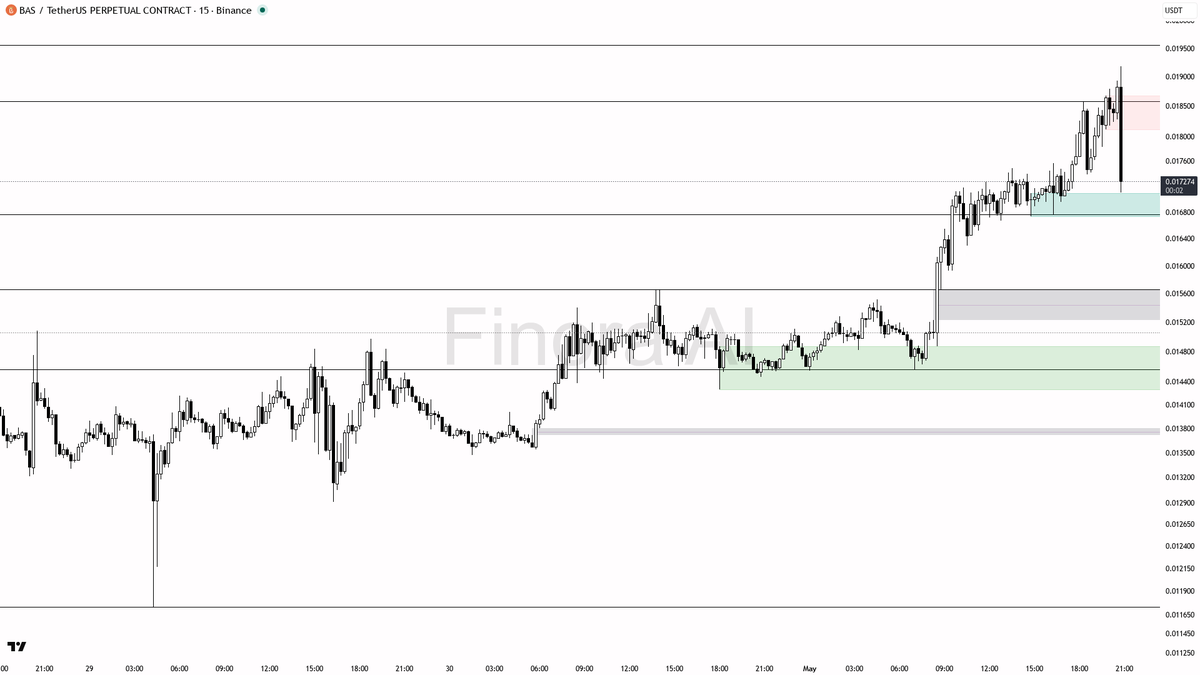
📊 $BAS hit with 4.6x sell volume spike, is this over or just starting?
- I expect continued downside pressure as a result of this heavy volume sell-off, likely driven by smart money distribution after a liquidity grab. Price should first target 0.016660, and if selling persists, look for 0.015664 and potentially 0.015517.
- If price bounces, I would be watching for a rejection and short setup near 0.017766 or 0.018359; confirmation is needed via a bearish reversal candle or lower timeframe breakdown.
- Do not rush longs until you see strong reversal evidence at major demand—especially around 0.015517—otherwise, the momentum favors the bears.
- If price reclaims 0.018359 and holds above, that would flip the bias and signal potential recovery—until then, be cautious of bullish trades.
- For now, a short on a weak bounce or breakdown continuation is the higher probability play.
📝 This is not investment advice, just an educational report—always manage your risk!
📊 Get detailed free analysis of any coin on any timeframe you want. Try Finora AI - Your Trade Buddy for free → tinyurl.com/FinoraBot
English
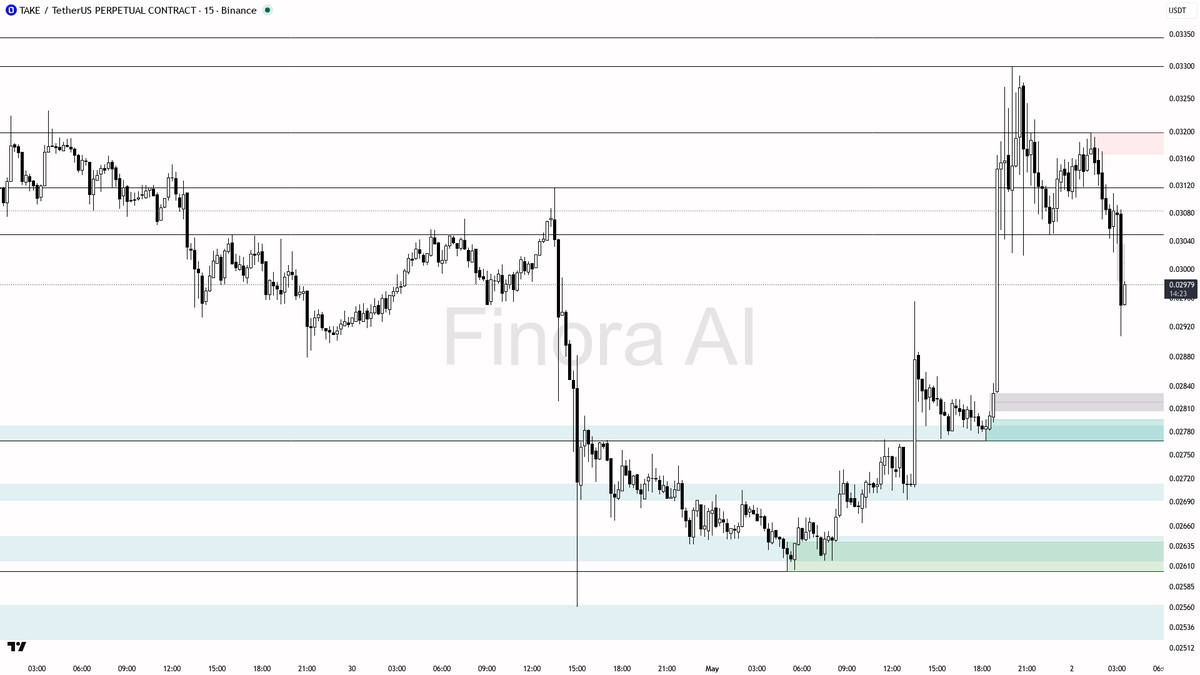
⚠️ 4.2x Unusual Selling Volume on $TAKE , what just happened?
- Given the massive volume spike and aggressive sell-off, I expect price to remain under bearish pressure as long as 0.03117 holds as resistance. This looks like smart money distribution rather than just panic selling, especially if the bounce attempts are weak and sellers step in quickly at resistance.
- If you want to follow momentum, consider short entries if price retests 0.03058–0.03117 and fails to close above with bearish confirmation (like a lower high, strong rejection wick, or bearish engulfing candle). First target would be 0.02955, then 0.02768, and if momentum continues, down to 0.02692 or even 0.02604.
- For entry, wait until you see a lower high form or a reversal candle on the 5m or 15m at the supply area. For confirmation, look for a pin bar, strong rejection, or a bearish engulfing.
- If price flushes below 0.02768 (most recent swing low) and then immediately snaps back above with a strong bullish candle, you could consider a quick countertrend long back to 0.02955 or 0.03025, but this is riskier and only for nimble traders.
- Always place your stop at the nearest swing high for shorts or swing low for longs. If price closes above 0.03117 with strong momentum, the bearish bias is invalidated and I'd expect a move back toward 0.033.
- To summarize: as long as 0.03117 holds and the bounce is weak, the path of least resistance is down. Only flip to bullish if you see a manipulation wick below 0.02768 that quickly reverses.
📝 This is not investment advice—just an educational analysis based on current price action, volume, and smart money concepts. Trade safe and always wait for clear confirmation before entering.
📊 Get detailed free analysis of any coin on any timeframe you want. Try Finora AI - Your Trade Buddy for free → tinyurl.com/FinoraBot
English