Flowly Indicators

719 posts

Flowly Indicators banner
Flowly Indicators

Flowly Indicators

@flowlytools

See through charts with SubFlow Terminal. Spot trapped traders, whales, liquidity and unusual volume. 🌱 Start free trial today
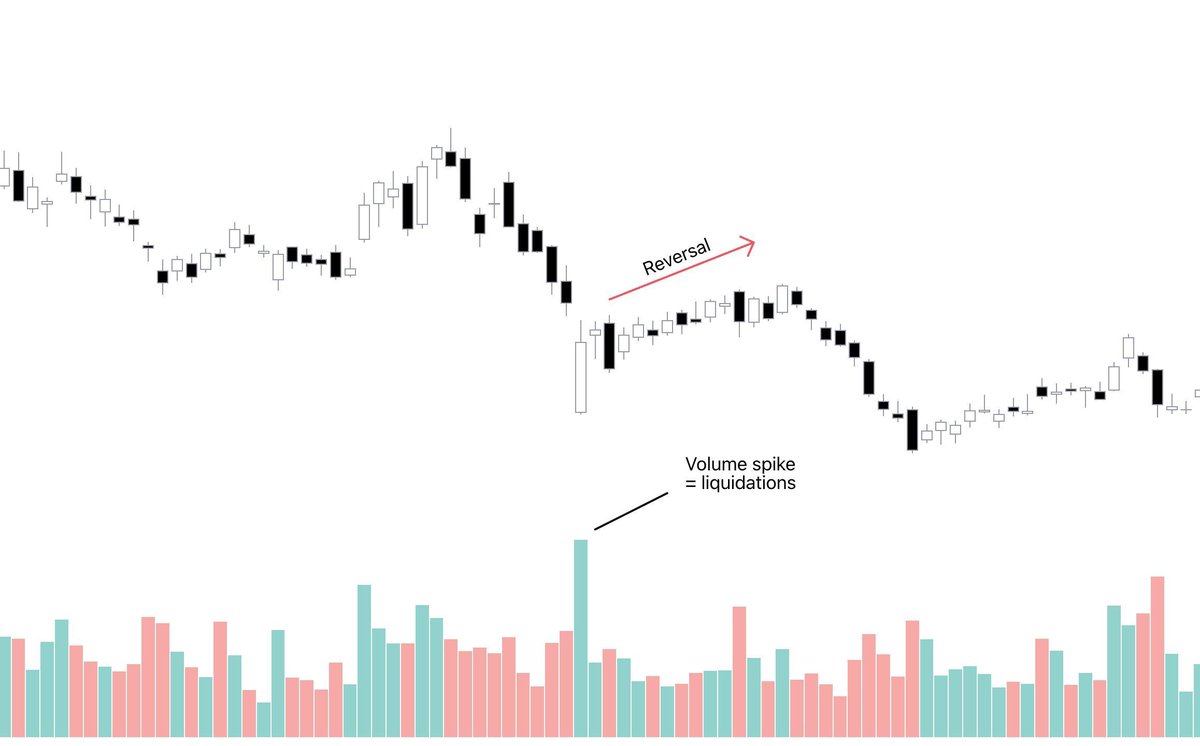
Start free trial → Katılım Aralık 2022
52 Takip Edilen777 Takipçiler
Flowly Indicators
Flowly Indicators@flowlytools·
Shape of volume matters. Growing = participation increasing Waning = participation decreasing Exploding = exuberance, fear/greed Imploding = indecision, re-evaluation Exploding and spiking volume is the easiest play. You can bet someone is going through pain when volume spikes. Sympathize with their pain, but collect what's on the table. Counter-trade them. Thanks for playing. And sorry for your losses.
Flowly Indicators tweet media
English
0
0
1
47
Flowly Indicators
Flowly Indicators@flowlytools·
Easter bunny left a bit of edge on our website. Here's Flow Dashboard. Get weekly liquidity levels, liquidations and unusual volume snapshots of all major trading charts. Powered by SubFlow Terminal. 35 stocks, ETFs and FX charts currently live. Which ones should we add next?
English
0
0
0
90
Flowly Indicators
Flowly Indicators@flowlytools·
@Leezus_sol Hey, thanks for the ping. It's most likely some data error on TradingView's end given how recent and how little flawed data there is. Other data sources seem to work just fine. We'll monitor and investigate though!
English
1
0
1
28
Leezus⚔️
Leezus⚔️@Leezus_sol·
@flowlytools i been using this indicator for months now and i absolutely love it but for some reason it is not showing anything for BTC anymore. Not sure why, if you can look into this that would be great!
Leezus⚔️ tweet media
English
1
0
0
32
Flowly Indicators
Flowly Indicators@flowlytools·
Here's how to estimate whether open interest is coming from longs or shorts. 1) Check if price is above or below moving average 2) Check if open interest is above or below moving average Use the following assumptions: Price above, OI above = longs entering Price below, OI above = shorts entering Price below, OI below = longs exiting Price below, OI below = shorts exiting This is how Open Interest Flow calculates the flows. Practical and accurate.
Flowly Indicators tweet media
English
1
0
0
105
Flowly Indicators
Flowly Indicators@flowlytools·
Don't get fooled. When a liquidity pool breaks and closes back in, participating breakout traders get trapped and squeezed out.
English
0
0
0
77
Flowly Indicators
Flowly Indicators@flowlytools·
The fairest VWAP on TradingView. Backed by statistics.
Flowly Indicators tweet media
English
0
0
2
124
Flowly Indicators
Flowly Indicators@flowlytools·
Our subscriber noticed a reversal pattern on SubFlow Terminal can actually indicate continuation, in certain context. And it makes sense. "Sometimes when price is oversold and starts to form a bottom, you see absorption at candle highs. That's my buy signal" While absorption is typically a reversal signal (trapped traders), if price is already at overextended, the meaning reverses. The absorbed flows can be read as trend initiation attempts instead. Here's an example on Walmart (WMT) demonstrating exactly that.
Flowly Indicators tweet media
English
0
0
0
64
Anthony GG
Anthony GG@anthdm·
If you are still paying for indicators you are wasting your money! Join our Discord and we will write ANY indicator for you for FREE. Don't pay for it please. We got you.
Anthony GG tweet media
English
17
13
220
19.7K
Flowly Indicators
Flowly Indicators@flowlytools·
🔍 Reading charts without nonsense Only one principle is needed. Literally, just one. Price always moves towards path of least resistance. The flip side of that? Price halts and stops at path of resistance. Path of least resistance = movement does not require effort Path of resistance = movement requires effort When price is moving through path of least resistance, it simply drifts and moves forward. No friction, like a well oiled gear churning. When price finds resistance, there's more force pushing against. Either supply needs to overwhelm demand (price reverses). Or demand needs to overwhelm supply (price continues). At resistance, bulls and bears "fight" to form a new consensus. It is an inflection point where beliefs are tested, backed by capital at risk.
English
0
0
0
85
Flowly Indicators
Flowly Indicators@flowlytools·
If you have subscribed to our old indicators, this is for you. Subscriptions are managed through Flowly Indicators website from now on. Enter order email and get 1-time login link to subscription portal. All old subscriptions will be found here. flowly.tools/manage-subscri…
English
0
0
0
78
Flowly Indicators
Flowly Indicators@flowlytools·
Backtest results can now be read in a human-friendly summary. Full breakdown of testing period, number of signals, conditions and each test result.
Flowly Indicators tweet media
English
1
0
0
71
Flowly Indicators
Flowly Indicators@flowlytools·
SubFlow Terminal update is live. Enhanced backtesting with custom date ranges, adjustable backtesting periods and summarized results. Here's what's new 🧵
Flowly Indicators tweet media
English
2
0
0
130
Flowly Indicators
Flowly Indicators@flowlytools·
How to scan 2000+ charts for volume accumulation on TradingView. Open up TradingView's stock screener and apply the following filters: 1) Marketcap above 10B 2) Relative volume above 1.2x 3) Price below 20-day moving average by 10% or more This will scan all charts that are: 1) Liquid and well traded 2) Putting up extreme volume 3) Are extremely oversold Overextended trend + stabilizing price + accelerating volume = accumulation Someone's buying up with size.
Flowly Indicators tweet media
English
0
0
1
153
Abbe Busoni
Abbe Busoni@Abbebusoni13·
@flowlytools Wish it worked on the one minute in T/V without a paid plan. Great indicator nonetheless.
English
1
0
0
15
Flowly Indicators
Flowly Indicators@flowlytools·
Spotting trapped traders with POC's is ridiculously simple. POC in the wick = trapped traders. Reverse and run. That's literally all to it.
Flowly Indicators tweet media
English
1
0
1
103