Sasi 📊📈

9.7K posts

Sasi 📊📈 banner
Sasi 📊📈

Sasi 📊📈

@freest_man

Data Analytics Consultant 🧑‍💻 Simplifying Data Science and guiding you to unlock your potential in Analytics! DM for Enquiries 📨

Join 2300+ readers: Katılım Ağustos 2022
170 Takip Edilen24K Takipçiler
Sasi 📊📈
Sasi 📊📈@freest_man·
Baidu Doubles Down: Meet the Turbo ERNIE Models – Faster, Smarter & 80% Cheaper! Just over a month after the blockbuster launch of ERNIE 4.5 and ERNIE X1, Baidu is back with an even bigger surprise:  ERNIE 4.5 Turbo and ERNIE X1 Turbo—delivering blazing speed, sharper multimodal smarts, and jaw-dropping cost savings. Why It Matters: > ERNIE 4.5 Turbo supercharges its predecessor with faster responses, stronger multimodal skills, and an 80% price drop—making top-tier AI more accessible than ever. > Cost Revolution? Input starts at just $0.11 per 1M tokens—40% of DeepSeek V3 and a mere 0.2% of GPT-4.5! > Benchmark Beast: Outperforms GPT-4o in multimodal and text tests, scoring 77.68 vs. GPT-4o’s 72.76—proof that premium AI doesn’t have to break the bank. Baidu isn’t just keeping up—it’s racing ahead.
Sasi 📊📈 tweet media
English
3
2
12
2.9K
Sasi 📊📈
Sasi 📊📈@freest_man·
ERNIE 4.5 Turbo in Action! Given a train photo, it identified the exact location using visual clues.
English
0
0
1
988
Sasi 📊📈
Sasi 📊📈@freest_man·
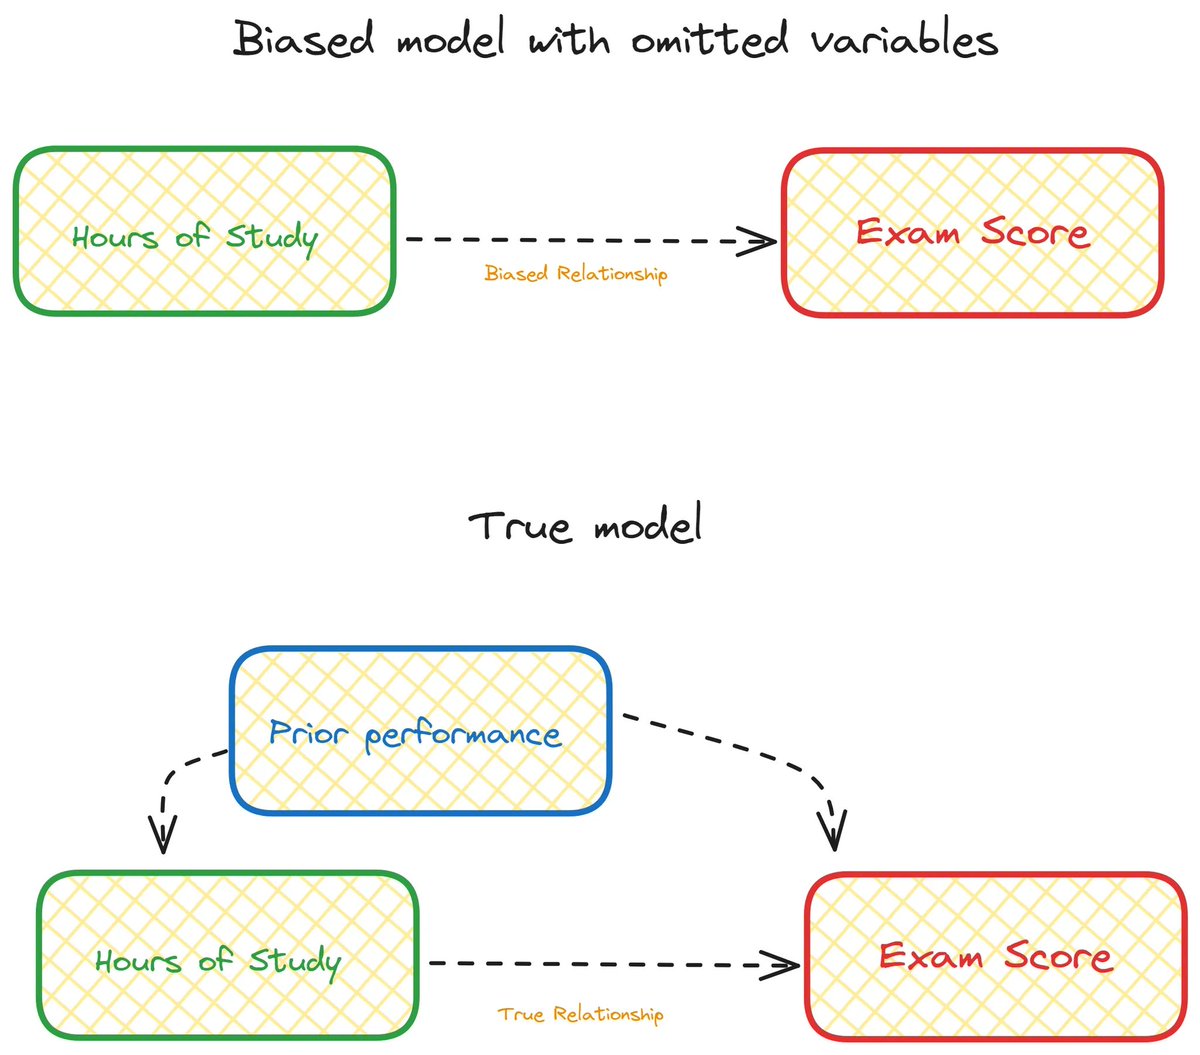
Omitted Variable Bias Explained: Leaving out a relevant variable can cause the model to have a biased or misleading result. Omitted variable bias, also known as confounding or missing variable bias, occurs when a relevant variable is not included in a statistical model, leading to a distortion of the estimated relationship between the variables that are included. Essentially, the omission of a key variable can result in a biased and misleading analysis. Let's illustrate this concept with an example: Imagine you are studying the relationship between students' hours of study and their exam performance, and you create a simple linear regression. The model with only the variable "hours of study" to predict exam scores. However, you omit an important variable, such as prior academic performance. If students who performed well in previous exams tend to study more, and their prior performance also influences their current exam scores, omitting the variable "prior academic performance" would introduce omitted variable bias. In this case, the model might mistakenly attribute the positive effect of prior academic performance to the hours of study, leading to an overestimation of the impact of study hours on exam scores. The true relationship is confounded by the omitted variable, and the model's results are biased. In the context of data science and regression analysis, it's crucial to identify and include all relevant variables that may affect the relationship you are studying. Failure to do so can lead to inaccurate conclusions and predictions. To address omitted variable bias, researchers need to carefully consider potential confounding factors and include them in their models to obtain more reliable and unbiased results. --- Leave a like! Follow for more!
Sasi 📊📈 tweet media
English
0
4
20
2.5K
vidipta fulpadia
vidipta fulpadia@VFulpadia·
@freest_man This is such a comprehensive list! a one stop solution for all behavioral questions
English
1
0
1
34
Sasi 📊📈
Sasi 📊📈@freest_man·
Financial Analyst - Excel Interview Question: Situation: You are working on a financial report in Excel that consolidates sales data from multiple regions. The report uses a large dataset where each region's sales figures are updated monthly. You need to quickly retrieve specific sales figures based on the region name and month. Problem: The dataset is dynamic, with new regions and months being added frequently. The traditional VLOOKUP function is not efficient because it requires the lookup column to be the first column, and it doesn’t handle missing values well. Question: What function would you use in Excel to solve this problem? And why? Answer: You can use XLOOKUP function as follows: =XLOOKUP(lookup_value, lookup_array, return_array, [if_not_found], [match_mode], [search_mode]) For example: =XLOOKUP("West", A2:A100, D2:D100, "Not Found", 0, 1) - Flexible Lookup Direction: XLOOKUP can search in any column (left or right), unlike VLOOKUP, which only searches left to right. - Handles Missing Values: You can specify a custom "Not Found" message instead of #N/A errors. - Dynamic Arrays: Works seamlessly with dynamic ranges and spill functionality. - Simpler Syntax: No need to count column indices, making it easier to maintain. --- Follow for more!
English
1
12
52
3.6K
Sasi 📊📈
Sasi 📊📈@freest_man·
SQL Interview Question: Situation: You are working on a complex SQL query that involves multiple subqueries to analyze sales data across different regions. The query is becoming difficult to read and maintain due to nested subqueries and repeated logic. Problem: The current query structure is inefficient and hard to debug. You need a cleaner, more modular approach to simplify the logic and improve performance. Question: How can you refactor this query to enhance readability and maintainability while avoiding redundant calculations? Answer: You can use CTEs (WITH clause) to break down the complex query into smaller, named temporary result sets. For example: WITH regional_sales AS ( SELECT region, SUM(amount) AS total_sales FROM sales GROUP BY region ), top_regions AS ( SELECT region FROM regional_sales WHERE total_sales > 1000000 ) SELECT s.* FROM sales s JOIN top_regions tr ON s.region = tr.region; >Improves readability by modularizing logic. >Avoids repeating subqueries (e.g., calculating regional sales twice). >Easier to debug and optimize individual CTEs. --- Follow for more!
English
0
49
239
13.8K
Sasi 📊📈
Sasi 📊📈@freest_man·
Power BI Associate Interview Question: You are working on a Power BI report for a retail company. The data model includes two tables: Sales and Calendar. There are two relationships between these tables: Active Relationship – Connects Sales[OrderDate] to Calendar[Date] (used by default in calculations). Inactive Relationship – Connects Sales[ShipDate] to Calendar[Date]. Problem: You need to create a measure that calculates total sales based on the Ship Date instead of the default Order Date. However, since the relationship between Sales[ShipDate] and Calendar[Date] is inactive, your calculations still use the active relationship. How do you do this? Answer: Total Sales by Ship Date = CALCULATE( SUM(Sales[Amount]), USERELATIONSHIP(Sales[ShipDate], Calendar[Date])) Explanation: The USERELATIONSHIP() function temporarily activates the inactive relationship between Sales[ShipDate] and Calendar[Date] within the CALCULATE function, ensuring that the measure evaluates sales based on the ship date rather than the order date. --- Follow for more!
English
1
17
120
7.6K
Sasi 📊📈
Sasi 📊📈@freest_man·
Frequently Asked Power BI DAX Interview Question: Situation: You are working on a Power BI report where you need to analyze year-to-date (YTD) sales performance. Your data model includes a Sales table with columns like SaleDate, Amount, and ProductID, along with a properly marked Date table. Question: How do I create a dynamic Year-to-Date (YTD) measure in DAX that automatically adjusts based on the selected date context in a Power BI report? Answer: You can use the TOTALYTD DAX function (or a manual equivalent with DATESYTD) to calculate YTD sales dynamically. Here’s an example: Sales YTD = TOTALYTD( SUM(Sales[Amount]), 'Date'[Date] ) --- Save this for future reference! Follow for more!
English
1
16
86
5.8K
Sasi 📊📈 retweetledi
Numbers Station AI is now part of Alation
The madness continues… and we’re down to the Final Four. 🏀 Florida, Auburn, Duke, and Houston are all that remain—and you know we had to ask Numbers Station to break down how this weekend might play out. Same drill: 📂 Uploaded @EvanMiya’s CSV 📓 Asked in plain English ⚡ Got bracket-ready insights instantly We’re only scratching the surface—connect your enterprise data to Numbers Station to unlock our full suite of agents. Can’t wait to see how it all unfolds. @MarchMadnessMBB Championship weekend, here we come. 👀
English
2
2
6
983
Sasi 📊📈
Sasi 📊📈@freest_man·
Excel Interview Question: If the lookup column is present on the right, how do you look up values in Excel? Answer: VLOOKUP is designed to search from left to right, so it is not ideal. 1. INDEX and MATCH: This is the most versatile and recommended method. INDEX and MATCH work together to overcome the limitations of VLOOKUP. This method is very flexible and allows you to look up values in any direction. 2. XLOOKUP It can look up values in any direction (left, right, up, down). It's more robust and less prone to errors than VLOOKUP. -- Save as you might need to refresh again Follow for more
English
0
4
57
2.5K