
📰 Front Wave Market Insights - 12th May 2026
⚠️ NIFTY downgraded to Weak – Stay Cautious!
The market structure has deteriorated rapidly.
Over the last few sessions, we’ve gone from a strong momentum setup to broad downgrades across the dashboard — and that shift is now clearly visible.
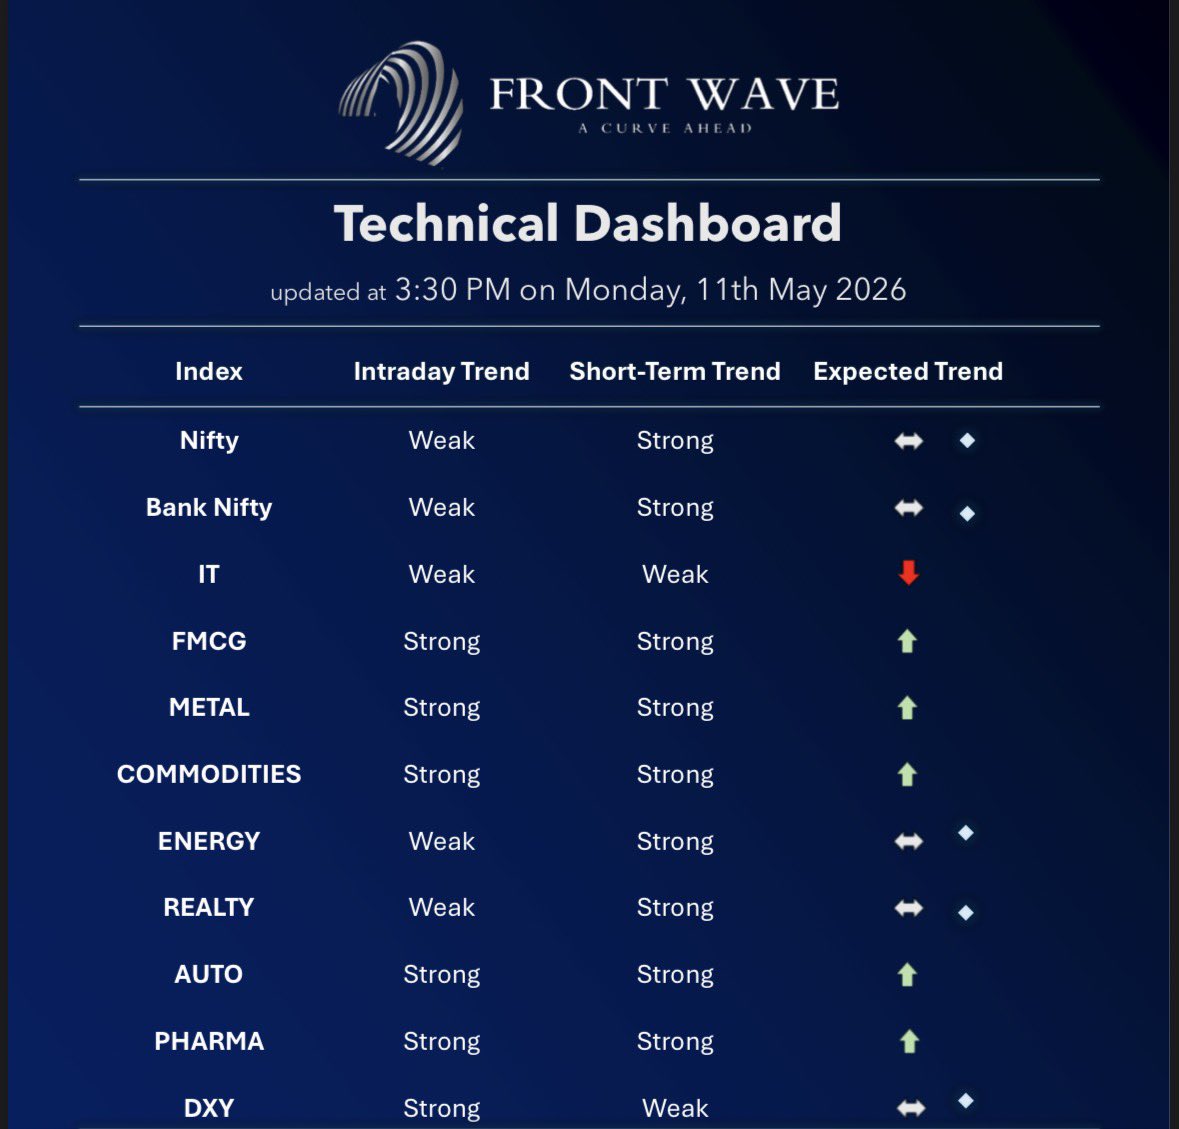
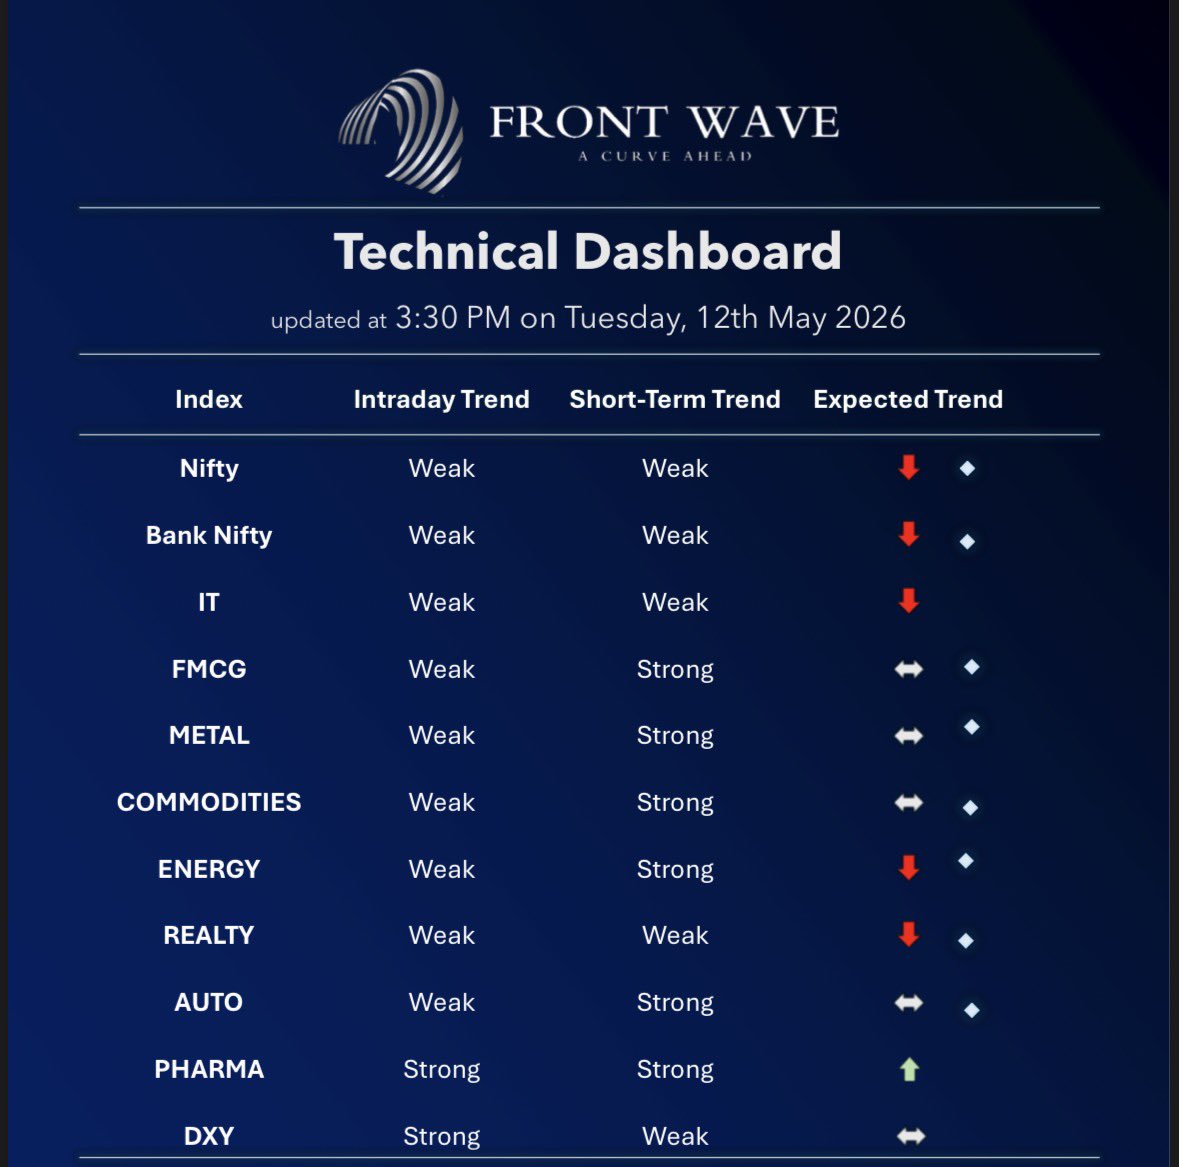
📊 Dashboard Updates:
🔻 Nifty → Weak
🔻 Bank Nifty, Realty, Energy → Weak; Most other indices → Neutral
This is no longer a “buy the dip” environment.
🌍 Macro Pressure:
🛢 Oil near $100 continues to weigh heavily on markets and sentiment.
💡 Strategy:
• Stay cautious
• Cut weak longs / respect stop losses
• Avoid aggressive dip buying
For now, the trend remains negative and we take it day by day until the dashboard turns green again.
📉 In this phase:
Sell on rises, preserve capital, wait for the next clean setup.
English