
Sabitlenmiş Tweet

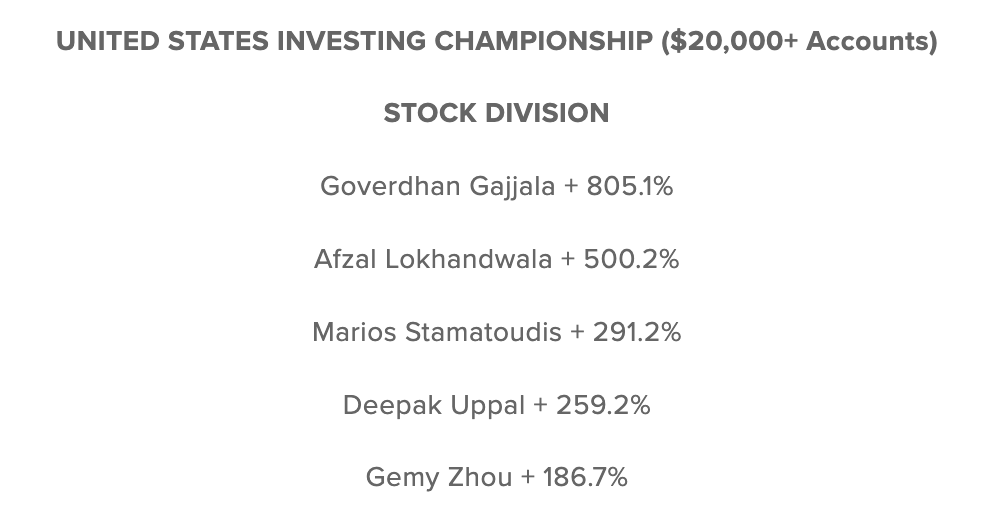
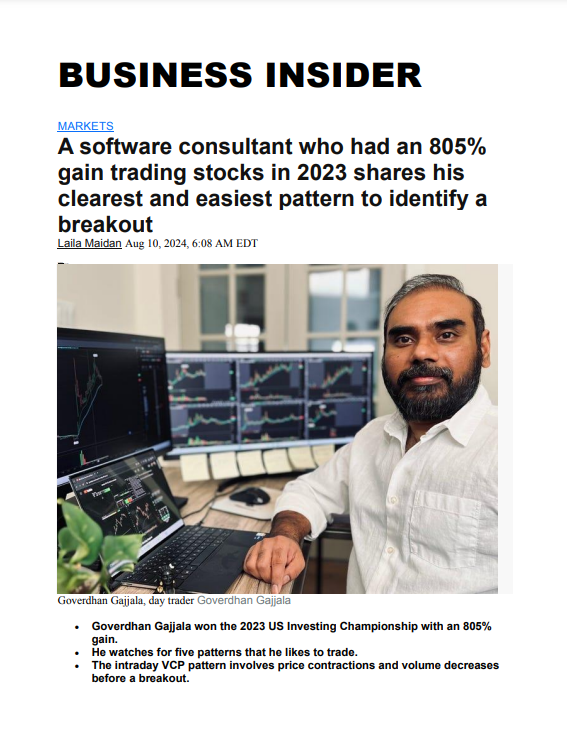
I won the 2023 US Investing Championship.
My trading account grew +805% this year.
It feels surreal!
Here is how it happened:
English
Goverdhan Gajjala
711 posts
@gov123459v
2023 US Investing Championship Winner. Beware of impersonators.








FINALE Post: To end off the series with @gov_gajjala, the winner of the US Investing Championship (@USICOfficial), there is one final post I wanted to make. After going through all of GGs material I had a few questions I wanted to ask him about his setups and ideas. Below is a snippet of the Q&A with GG. I want to give a big shout-out to GG for taking the time to answer questions I had and and making all of his material free to the public. Truly appreciate it! ------------------------------ Question and Answer: 1. How do you determine which time frame (ie. 1m, 5m, 15m, etc) to use? Is there specific criteria to determine if you are using a 5m vs 15m chart? Specifically for the Bull Flag Breakouts setups vs the EMA Kiss & Fly's setup. • 90% of trades and viewing trades are done on the 5m chart, while 10% of the time 15m charts will be used • The 10% of the time where 15m is used, will be when the 5m chart doesn’t look optimal but zooming out to 15m, the setup aligns with criteria or that there is a more optimal RR or entry point • It is also based on a level of comfortability 2. Can you talk more about finding the right stocks to trade? For example, using price, volume and % change filters may get over 100-200 stocks in certain periods of time in your scan. Would you go through each individual chart or try to filter those stocks out using more criteria? And if you are looking at each chart quickly, what are some of the aspects that you are looking for in order to go through a considerable number of charts? • Usually, ~20 tickers will show up on scans with 10 of them being watchable or noteworthy, and 5 being very good potential setups. It is always about the left side of the chart. The price needs to show strength/ momentum and have organic pullbacks in price. • GG uses multiple monitors to see 18 stocks and view them throughout the day. 3. Does market conditions (SPY or QQQ) impact your trading? In times of market downturns, are there more or less setups that you see and if so do those setups offer worse RR or higher probability of failure? • No, because the focus is small-cap stocks, in most cases, the general market won’t impact his trading routine. However, in unique situations (ie. GME and the meme stock rally) specific news events could magnify the small-cap market. 4. ... ------------------------------ The full Q&A can be read here: retailtradersrepository.substack.com/p/goverdhan-ga… And if you like this new type of content where I chat with traders, please subscribe, follow, and comment!

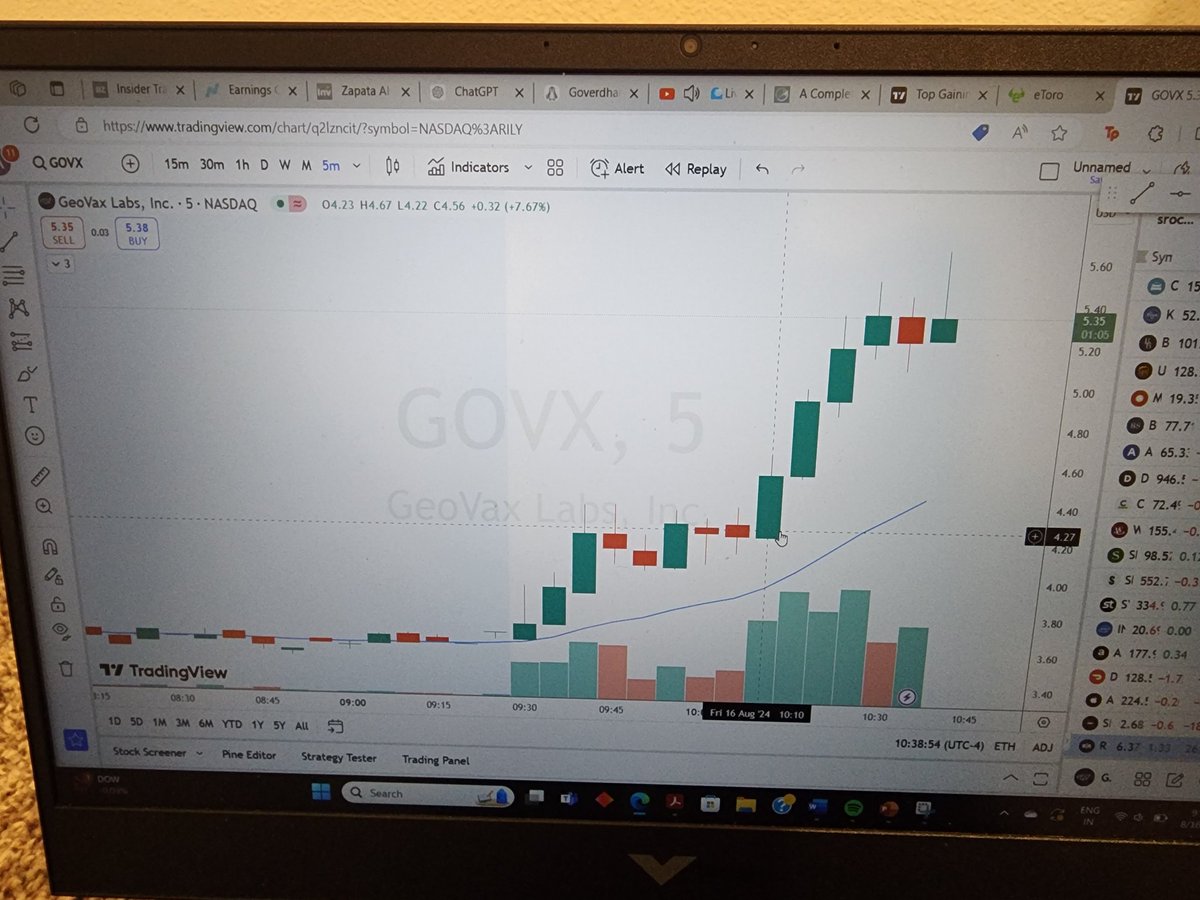

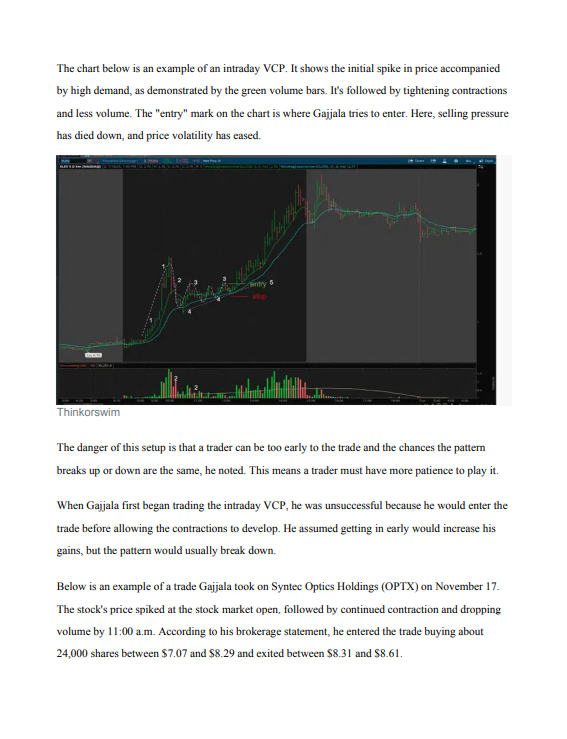


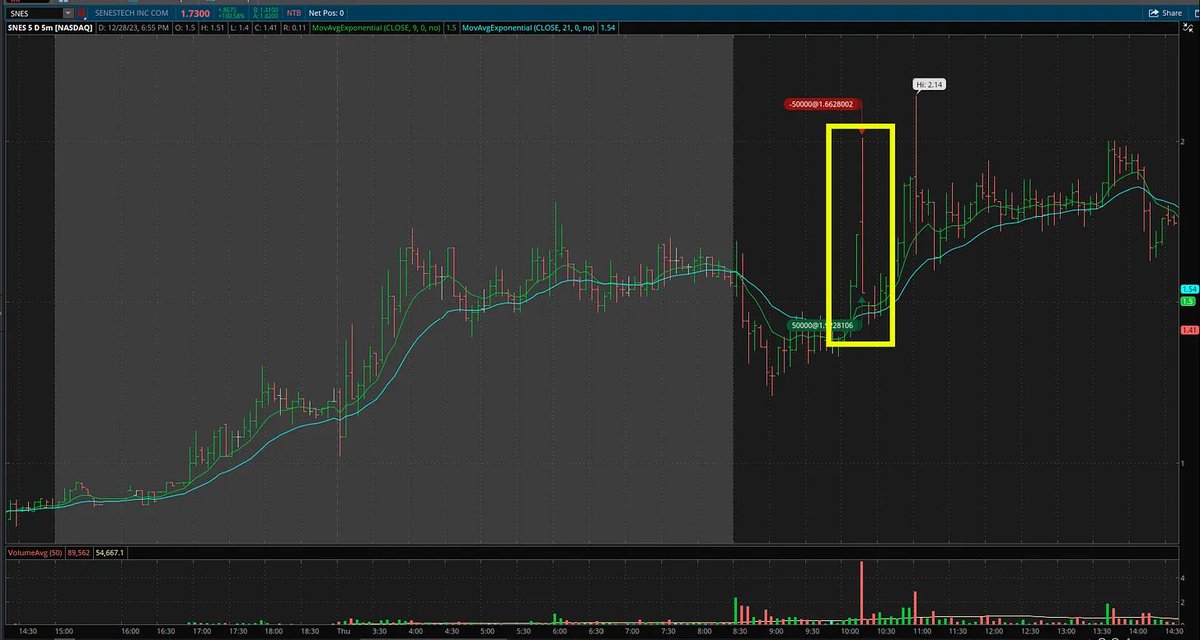

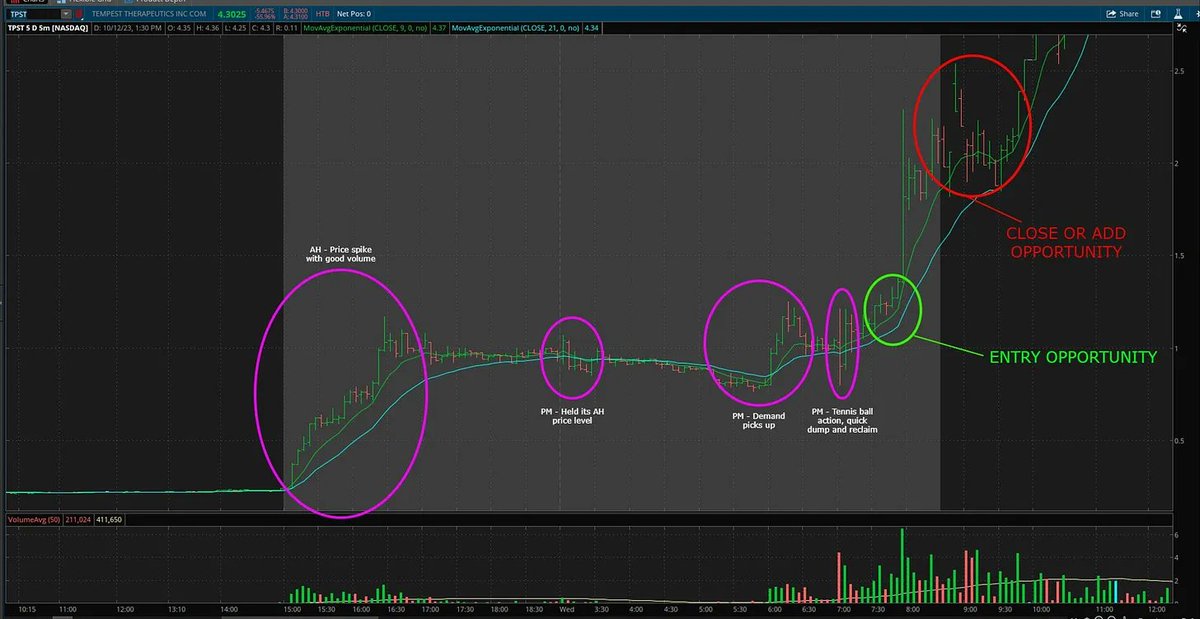
New Post: Reviewing @gov_gajjala's Trading Methodology! This series is almost coming to a close as I reviewed the Intraday Volatility Contraction Pattern Setup. This is Setup 4 out of 5. After reviewing all the setups from GG, I have one final post on a Q&A where GG very awesomely answered a ton of questions I had about his methodology. ------------------------------ Intraday VCP Setup Overview: Characteristics 1/Good demand in 1 bar or a couple of bars 2/The price comes back almost to the original level (fades) with low volume 3/Demand tries to pick up but sells off 4/The price finds support at the 21 EMA 5/The trend should have higher lows • While “Setup#1: Bull Flag Breakouts” is his fastest setup, Intraday VCPs are his slowest setups • One other thing to consider. I think the Horizontal Fade and the Intraday VCP are incredibly similar to one another. The key difference though is 1/ how large the price waves are and 2/ the consolidation on the EMAs. The Horizontal Fade setup will have price respecting the 9EMA or a more shorter EMA vs the Intraday VCP where the 21EMA is respected. Examples of Setup: 1. $ELEV • Perfect definition of the setup - Would be classified as an A+ • He uses the 9EMA as a trailing stop and tries to ride the wave of momentum until price closes below the 9EMA, therefore closing the trade 2. $DWAC • Base on a base • The first entry was a mini VCP More examples in full post below :) INVALID Examples: • You want symmetrical price movement after the initial push in price. When consolidation starts the first leg up should flow into the consolidation. It shouldn’t look choppy, like how it does on the right side of the picture. 1. $LQR Characteristics Missing In This Setup: 2/ The price comes back almost to the original level (fades) with low volume. The leg-up doesn’t flow into the consolidation. 4/ The price finds support at the 21 EMA & 5/ The trend should have higher lows The initial demand is too violent and the consolidation although tight isn’t clean and symmetrical. Not an optimal setup. Other Notes on LQR: • Too high of a volume spike and the selling is also too high after the main green bar • After the initial highs the price did not try to reclaim its high, the drop was too sharp of a move Link to Full Post: shorturl.at/EJESH Please RT and follow to show some support :)
The Annual TraderLion Trading Conference is back, bigger and better than ever! 🎉 🗓️Join us on July 20-21 & July 27-28 for expert insights from legendary traders like Stan Weinstein, Mark Minervini, and Ross Haber. Full list & details: traderlion.com/conference
