Hold Coin CVenture

1.6K posts

Hold Coin CVenture banner
Hold Coin CVenture

Hold Coin CVenture

@hccventure

Analysis - Assessment - Investment - Construction || Exclusive partner @Gate_io && @Cryptocom_Exch Notification : https://t.co/GNKsYNVLYD

Việt Nam Katılım Haziran 2024
95 Takip Edilen7.3K Takipçiler
Sabitlenmiş Tweet
Hold Coin CVenture
Hold Coin CVenture@hccventure·
Crypto Report 2025 compiled by #HCCVenture 2025 marks a major step forward for the global cryptocurrency market. While 2021 was a testing and foundational phase, 2025 is the year the cryptocurrency market enters its most mature stage, transforming from a virtual asset into a financial and technological infrastructure, reshaping the global financial and economic structure. Cryptocurrencies are no longer considered merely virtual currencies or virtual assets; most countries are now gradually integrating them into their national economies. Cryptocurrency assets are measured by network throughput, payment value, and the degree of integration with mainstream communication systems and financial business systems. 
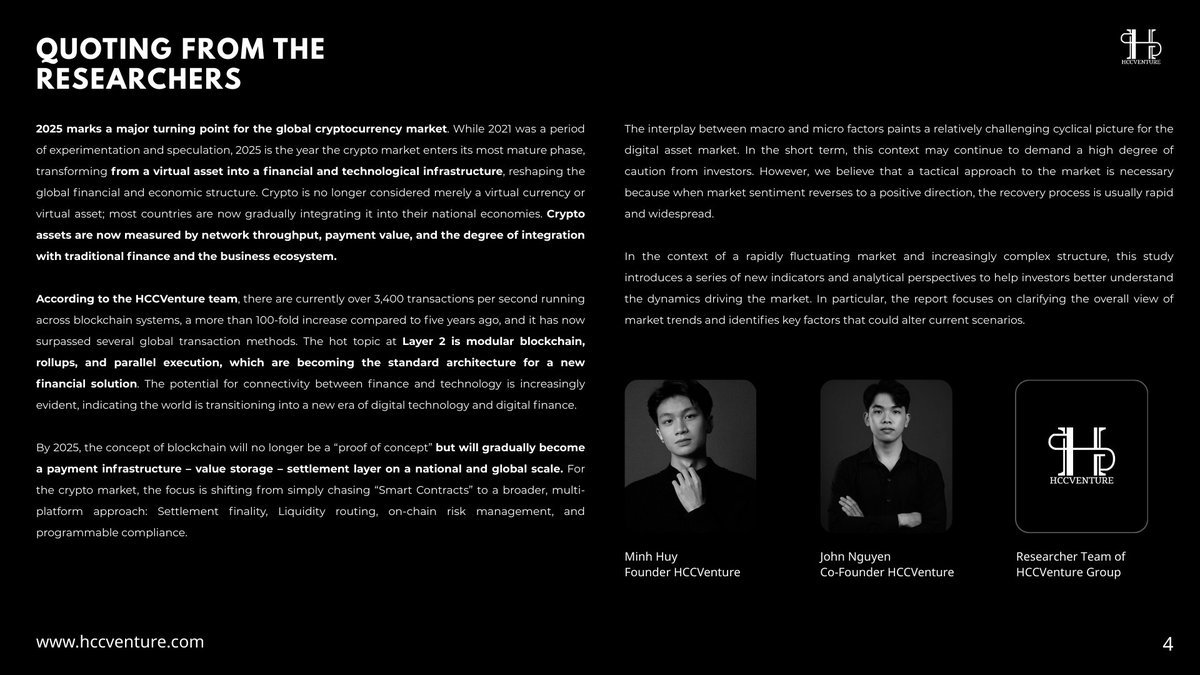
This report was compiled by a team of cryptocurrency market research and analysis experts, on-chain blockchain evaluators, and unit auditors from #HCCVenture. 
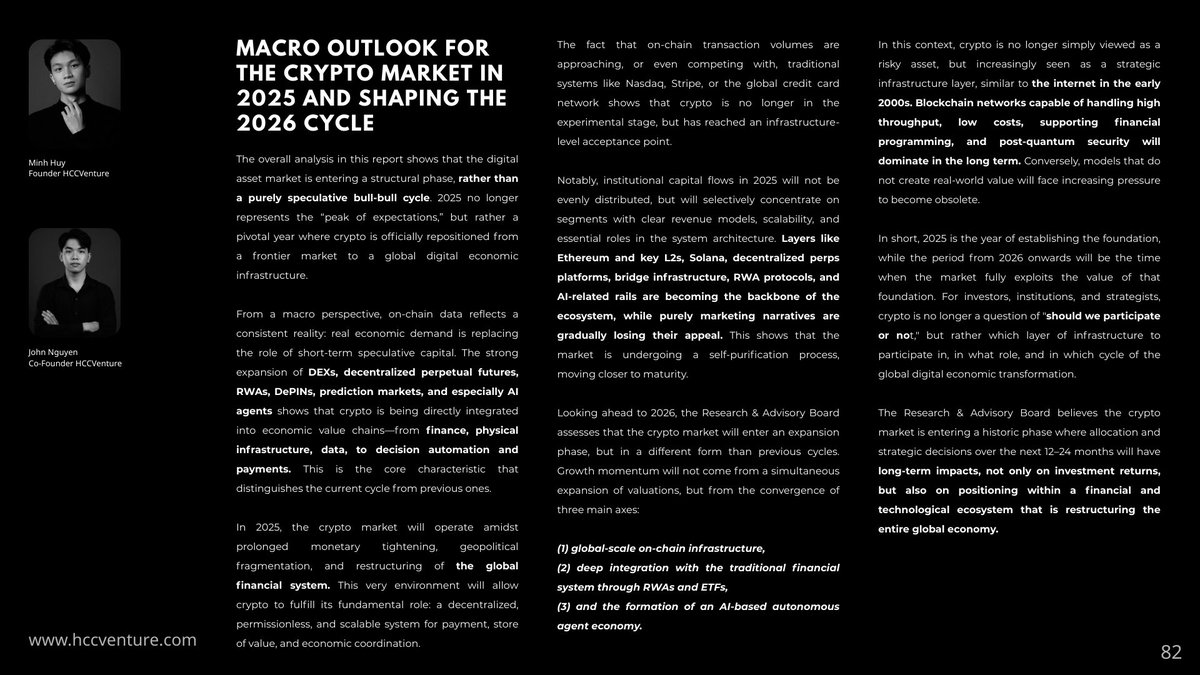
This report outlines a comprehensive picture of the overall development of the cryptocurrency market in 2025, and the insights gathered will form the basis for future market trends in 2026. 
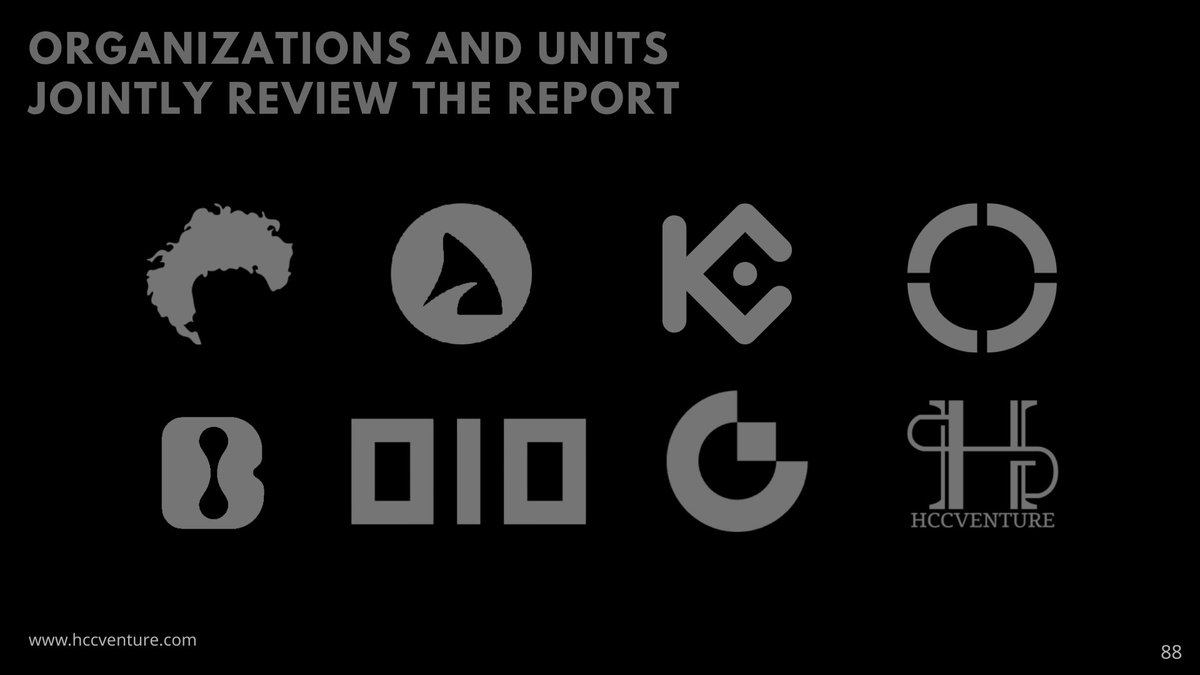
We thank our partners and collaborators who co-reviewed the report with HCCVenture, including: @HoldstationW, @whatexchange , @Followinvietnam , @LBank_Exchange , @Gate , @KuCoinInst , and @defiapp . This report, compiled and published by #HCCVenture, aims to provide information, analysis, and research perspectives related to the digital asset market, blockchain technology, and related digital economic sectors. The entire content of this report reflects the professional opinion of the #HCCVenture Research & Advisory Board at the time of publication, based on publicly available data, information, and analytical models that they deem reliable. This report is for informational and research purposes only and does not constitute a proposal, recommendation, or investment advice of any kind. #HCCVenture assumes no responsibility for any investment decisions, transactions, or actions taken based on the content of this report. Readers should assess the appropriateness and tolerability of the risk and consult with professional advisors before making any financial decisions.
Hold Coin CVenture tweet mediaHold Coin CVenture tweet mediaHold Coin CVenture tweet mediaHold Coin CVenture tweet media
English
41
6
50
121K
Hold Coin CVenture
Hold Coin CVenture@hccventure·
On-chain analysis week 14/2026: Bitcoin recovers amid weakening demand The market is in a transitional phase with a more balanced structure compared to last week, but lacks the momentum to break out of the rangebound and move into a sustainable uptrend. ----------------------------- The Puell Multiple – a measure of miners' relative profitability by comparing daily mining revenue to a 365-day moving average – is at 0.7, a record low in the current cycle. The sharp and sustained decline in this indicator not only reflects the low profit pressure on miners but also confirms that the supply from miners – one of the main traditional sales sources – has been severely restricted , creating the most solid on-chain foundation for a sustainable recovery. Historically, the Puell Multiple has peaked above 2.5–3.0 during strong bull market periods in 2024–2025, when mining revenue surged and miners aggressively sold to lock in profits. Conversely, lows below 0.8 often appear just before or during sustained rallies, when miners reduce selling and accumulate to optimize long-term profits. Currently, the Puell Multiple at 0.7 is not only significantly lower than historical peaks but also lower than previous temporary lows ( around 0.8–0.9 by the end of 2025 ), indicating that miner profitability has decreased to a minimum after the price broke out of the $59,000–$72,000 accumulation cluster . Compared to the previous historical low ( around 0.5 during extreme stress periods in 2022 ), the current level remains undervalued but is a significant improvement over previous high-profit peaks, confirming that miners are in tight control and prioritize holding coins rather than selling them to the market. ------------------------------ Sum Coin Age – the total accumulated age of the entire Bitcoin supply – is currently at 32.9 billion days, a record high in the cycle's history. This sustained and continuous increase not only reflects the increasingly strong long-term holding behavior of long-term holders but also directly shrinks the actual circulating supply, creating the most solid on-chain foundation for the current price recovery. From mid-2023, the Sum Coin Age was only around 27.5 billion , corresponding to a period of cautious market conditions and a portion of the old supply still being regularly circulated. By mid-2024, the index began to accelerate significantly, surpassing the 30 billion mark and continuing to climb steadily throughout 2025, reaching its current historical peak of 32.9 billion. Despite temporary corrections coinciding with sharp price drops, Sum Coin Age has maintained a long-term upward trend and has never fallen below $31 billion – its lowest point in recent times. Compared to its historical low of $27.5 billion in early 2023–2024, the current size of Coin Age has increased by nearly 20%, confirming that the coins are being held for longer, even as Bitcoin's price corrects from its highs to $72,900. ------------------------------ The Perpetual Market Directional Premium (30D-SUM) – a measure of the cumulative directional premium over 30 days for the perpetual futures market – clearly indicates that the positioning of perpetual derivatives is leaning in a controlled and stable upside direction. Large but not extreme cumulative spikes reflect a clear bullish bias in perpetual futures without falling into speculative excess, thereby directly supporting genuine spot demand and strengthening the foundation for a sustainable recovery. Historically, the Perpetual Market Directional Premium has seen extreme positive spikes exceeding $500–600 million in mid-2021, late 2023, and at some points in mid-2025, coinciding with periods of strong bull markets where perpetual leverage fueled long positions. Conversely, deep negative zones appeared during the 2022 bear market when short bias prevailed. Currently, the index is in a stable positive and consolidating state, significantly lower than historical peaks but noticeably higher than previous deep negative lows. Compared to historical lows (the strong negative zones of 2022), the current directional premium has improved significantly, confirming that the perpetual market is shifting from a defensive phase to a controlled upside bias, supporting short covering and institutional capital flows without creating a leveraged cascade. ------------------------------ Bitcoin's realized cap is fluctuating around $1.05–$1.1 trillion USD , approaching its historical peak set in late 2025. Compared to the cycle bottom in late 2022 when the realized cap was only around $380–$400 billion USD , the actual capital size has increased nearly threefold , reflecting a strong and sustainable capital expansion cycle. Observing the structure in detail, the UTXO group in the $10,000-$100,000 and $100,000-$1,000,000 ranges accounts for the largest proportion of the current realized capital, indicating that the majority of capital flow is controlled by medium to large-scale investors. This is typical of the post-accumulation phase, when the market has shifted from a retail-driven to an institutional-driven state. The UTXO group with values ​​exceeding $1 million continues to maintain a stable upward trend and has not recorded any significant declines in recent price corrections. This suggests that large-scale entities (whales, institutions, ETF custodians) are not engaging in aggressive distribution, but rather continue to hold assets at high prices. #hccventure #onchain #bitcoin #news #crypto
Hold Coin CVenture tweet mediaHold Coin CVenture tweet mediaHold Coin CVenture tweet mediaHold Coin CVenture tweet media
English
1
0
26
17.9K
Hold Coin CVenture
Hold Coin CVenture@hccventure·
#Ethereum network becoming active again? #Ethereum is currently in a structural reaccumulation phase, where intrinsic value continues to be strengthened through network growth and a shrinking circulating supply. -------------------------------------- Exchange Reserve – All Exchanges from #HCCVenture provides the most accurate and visual picture of this movement, with the red line representing the total amount of #Ethereum held on exchanges ( Exchange Reserve ) and the #Ethereum price line (black) directly compared from the beginning of 2024 to March 2026. The Exchange Reserve index has now fallen to a record low of 14.8 million $ETH , significantly lower than any previous low, confirming that the supply on spot exchanges has shrunk sharply, eliminating potential selling pressure and creating a solid foundation for real spot demand to drive the market. Quantitatively speaking: -) Peak Exchange Reserve: ~21.2 million $ETH (Q1/2025) -) Current value: ~14.8 million $ETH (Q1/2026) -) Absolute decrease: ~6.4 million $ETH -) Reduction rate: ~30% In early 2024 , the amount of $ETH on exchanges remained high, around 20.5–21 million $ETH , while the price of $ETH fluctuated in the $1,600–$2,500 range . This was a period of market accumulation, with a relatively large supply available for trading. From mid -2024 to early 2025 , Exchange Reserves continued to maintain a sideways trend and even slightly increased, peaking at approximately 21.2 million $ETH . However, it is noteworthy that during this same period, the price of $ETH surged to the $4,000–$5,000 range , indicating strong market demand absorption of the available supply on exchanges. -------------------------------------- The sustained and continuous increase in Total Value Staken not only reflects investors' increasingly strong long-term confidence in the Proof-of-Stake mechanism but also directly narrows the circulating supply, creating the most solid on-chain foundation for the current price recovery. As of now (Q1/2026), the total amount of $ETH staked has reached approximately 38.7 million $ETH , equivalent to over 31% of the total circulating supply . This is the highest level in Ethereum's entire history, far exceeding the approximately 28 million $ETH at the beginning of 2024. The number of active validators has exceeded 1.2 million , while $ETH staking through liquid staking protocols (especially Lido) accounts for over 30% of the total staking , demonstrating strong participation from both individual and institutional investors. Considering these key milestones: -) Low at the beginning of the cycle (2024): ~28 million $ETH -) Average 2025: ~34–36 million $ETH -) Current level: ~38.7 million $ETH (ATH) Despite temporary fluctuations during sharp price corrections (especially in early 2025), Total Value Staked has maintained a long-term upward trend and has never fallen back below 34 million $ETH – the lowest level in recent times. This confirms that investors not only hold but also actively stake more $ETH through each period of volatility, even when the price dropped from the high of $4,000–$5,000 to $2,000. -------------------------------------- The Number of New Addresses – the number of new addresses created on the network – clearly reflects the dramatic increase in on-chain activity and user adoption, currently at record highs, with recent spikes exceeding 400,000–450,000 addresses/day, reflecting the widespread participation of new users in the Ethereum ecosystem and directly supporting real spot demand during the current recovery phase. Historically, the Number of New Addresses cycle reached extreme peaks in 2021 with spikes exceeding 350,000–400,000 addresses per day during a strong bull market, coinciding with the boom in #DeFi and #NFTs. The bear market phases of 2022–2023 recorded the lowest levels at around 50,000–100,000 addresses per day, reflecting a decline in activity and user confidence. Conversely, the current level, with continuous spikes exceeding 400,000 addresses/day – significantly higher than any historical low and only slightly lower than the 2021 peak – suggests that the Ethereum network is attracting new users on an unprecedented scale since the peak of the previous cycle. -------------------------------------- The current SOPR remains at around 0.8, well within control and significantly higher than historical lows, confirming that on-chain transactions are occurring with orderly realized losses rather than panic selling, thereby directly supporting genuine spot demand and strengthening the foundation for a sustainable recovery. Historically, the SOPR has fallen to an extreme level of 0.6 in mid-2022 – a period of deep bear market and clear capitulation as most supply fell into a state of significant losses. Spikes above 1.15–1.2 also frequently appear during strong bull market phases in 2024–2025, reflecting strong profit-taking by short-term holders on price momentum. Currently, the SOPR at 0.8 is not only significantly higher than the historical low of 0.6 but also noticeably lower than previous extreme profit peaks, indicating that the market is in a controlled de-risking phase: sellers are accepting temporary losses to rebalance their positions but are not creating a widespread liquidation cascade. Compared to the historical low of 0.6 in 2022, the current SOPR has improved by nearly 33%, confirming that the pressure of realized losses has been effectively absorbed and is no longer at the dangerous levels of previous stress periods. #hccventure #ethereum #eth #news #crypto
Hold Coin CVenture tweet mediaHold Coin CVenture tweet mediaHold Coin CVenture tweet mediaHold Coin CVenture tweet media
English
1
0
17
20.2K
Minh Huy | Founder HCCVenture
Minh Huy | Founder HCCVenture@MHuy_hccventure·
Analysis of Crypto #ETFs and #ETPs in Q 1/2026: Restructuring of Internal Capital Flows The #Bitcoin Spot ETF has recorded significant net $BTC accumulation over several sessions. The #Ethereum Spot ETF has also shifted to attracting capital, albeit on a smaller scale than #Bitcoin. The outflow of capital is no longer widespread as it was at the end of December 2025, reflecting the expected recovery. Investors are gradually buying back in at more stable price levels, instead of withdrawing capital en masse. Not only is the overall capital flow positive, but the chart showing the distribution of capital flow by issuer (BlackRock, Fidelity, Grayscale, Valkyrie, Bitwise...) indicates that BlackRock and Fidelity are the two leading issuers absorbing new capital. Other funds like ARK/21Shares and Bitwise also had inflow sessions, but the distribution was uneven across days. Grayscale is no longer the overwhelming source of outflow as in previous weeks — the pressure to withdraw capital has decreased. In previous weeks, each outflow from an ETF was usually accompanied by a significant price drop . But in the first week of 2026, even with outflows, the price of $BTC did not fall sharply , and then recovered when inflows appeared. Institutional investors seem to view #Bitcoin ETFs as an initial strategic investment tool at the beginning of the new year. Price fluctuations do not reflect selling pressure from ETFs as before. This indicates a stable and accumulating flow of capital , rather than a panic selling.
Minh Huy | Founder HCCVenture tweet media
English
2
0
2
72
Hold Coin CVenture
Hold Coin CVenture@hccventure·
Overall, the heatmap shows a strong concentration of color around several major hotkeys such as Yuma, tao.bot, Taostats, and Opentensor Foundation , spanning across multiple netuid. The high color intensity (especially in the deep purple and deep blue regions) reflects the high frequency or level of interaction between these validators and multiple subnets, suggesting they act as "liquidity hubs" and "processing centers" within the network. This aligns with previous staking data, which also showed these entities to be the most dominant validators. Conversely, the majority of the remaining hotkeys exhibit a lighter color density and a more dispersed distribution, indicating limited and uneven participation across subnets. This reflects a distinctly hierarchical network structure: a small group of validators operate across multiple subnets with high intensity, while the rest focus on only a few subnets or operate on a smaller scale. Looking at the network hierarchy (netuid), subnets with medium IDs (around 20–80) show higher activity levels, with the simultaneous participation of many large hotkeys. This indicates that these subnets are playing a central role in the ecosystem, possibly related to key use cases or highly applicable AI/ML models. Conversely, subnets at the edge (low or very high IDs) have lower activity densities, reflecting an early stage of development or limited access to capital and resources.
Hold Coin CVenture tweet media
English
1
0
1
5.8K
Hold Coin CVenture
Hold Coin CVenture@hccventure·
Analysis of the #Bittensor Network (TAO) after the first Halving #Bittensor is operating in a state of controlled growth, characterized by the convergence of capital and resources into high-performing entities. Bittensor is in sync with major developments in the AI and blockchain market. The explosion of the “AI x Crypto” narrative in the 2024–2026 period has attracted significant capital into decentralized AI infrastructure projects, with Bittensor playing a leading role as one of the pioneering protocols. ——————————— In the initial phase, from late 2023 to Q1 2024, the price of $TAO experienced a strong surge, taking the asset from below $100 to a peak of nearly $700–750, equivalent to an increase of more than seven times. This surge coincided with the "AI narrative recovery" wave, as speculative capital and technological expectations focused heavily on projects related to artificial intelligence. In the initial phase, from late 2023 to Q1 2024, the price of $TAO experienced a strong surge, taking the asset from below $100 to a peak of nearly $700–750, equivalent to an increase of more than seven times. This surge coincided with the "AI narrative recovery" wave, as speculative capital and technological expectations focused heavily on projects related to artificial intelligence. Notably, the Bitcoin halving event (reducing the block reward by 50%) in 2024–2025, which was generally expected to be a positive catalyst, did not create a sustainable upward trend for $TAO. Instead, the price continued to weaken and formed a lower high – lower low structure, indicating a misalignment between the individual narrative and the overall liquidity cycle.#
Hold Coin CVenture tweet media
English
1
1
5
20.5K
Saturn Terminal
Saturn Terminal@saturnterminal·
@hccventure Sustainable growth is built on sound economic models. This analysis highlights a fundamental mechanism.
English
1
0
1
25
Hold Coin CVenture
Hold Coin CVenture@hccventure·
On-chain analysis week 10/2026: Potential for market stability amidst macroeconomic uncertainty #Bitcoin is entering a crucial transitional phase in its market cycle, where correction pressure persists but initial signs of stabilization are beginning to emerge. ---------------------------------- The book "#Bitcoin Inflation Rate (%) and Stock-to-Flow Ratio" provides a fundamental perspective on the long-term pricing mechanism of #Bitcoin, through the relationship between the supply inflation rate and the Stock-to-Flow (S2F) ratio . The systematic decline in supply inflation after each halving cycle has altered the economic nature of Bitcoin, shifting it from a growth asset to a deflationary -like asset , with the pressure of new supply weakening over time. This is a core factor shaping the long-term upward trend of its price. Currently, #Bitcoin's annual inflation rate has fallen to approximately 0.85%–0.95% following the most recent halving event. This is the lowest level in the network's entire operating history. Compared to previous periods: ➟ Period 2011–2012: inflation > 25% ➟ After the 2012 halving: a decrease to approximately 10–12%. ➟ After the 2016 halving: a decrease to approximately 4–5%. ➟ Or halving 2020: ~ 1.7–2% ➟ Currently (after halving 2024): <1% This stepwise decline is not random but pre-programmed into #Bitcoin's issuance mechanism. This creates a predictable supply-down trajectory, in stark contrast to traditional monetary systems. ---------------------------------- Data from the on-chain cost of capital indicator system confirms that #Bitcoin is operating within an intermediate valuation zone, with the price sitting between the Realized Price ($54,000) and the Active Investor Mean ($78,000) . In this structure, the Realized Price continues to act as a long-term support level, while the Active Investor Mean and STH Realized Price form distinct behavioral resistance zones. This structure indicates that the price is below the Active Investor Mean but above the Realized Price , placing the market in an intermediate state between growth and weakness. In this structure, the Realized Price continues to act as a long-term support base, while the Active Investor Mean and STH Realized Price form distinct behavioral resistance zones. Compared to the past, this is a pricing zone that often appears in post-peak or consolidation phases after sharp corrections, when profits are not yet sufficient to trigger new capital inflows but also not negative enough to lead to large-scale capitulation. ---------------------------------- Data from the Supply Last Active 1yr+ Net Position Change indicator confirms that #Bitcoin has ended its strong distribution phase from Long-Term Holders and is entering a stable and mild re-accumulation phase . In the current cycle: ➟ The period from 2024 to early 2025 will see strong distribution phases from LTH. ➟ Currently (2026), the indicator has returned to the neutral-slightly positive zone. ➟ This confirms that the distribution process has weakened significantly, and the market is entering a phase of reabsorbing supply . History shows that whenever Net Position Change shifts from negative to positive, long-term selling pressure decreases, the circulating supply narrows, and the market enters a stabilization or accumulation phase. Currently, #Bitcoin's price has corrected from its peak of approximately $120,000 to around $65,000–$70,000, and Net Position Change has stopped declining and begun to stabilize. Compared to previous cycles, this is a typical characteristic of the post-distribution phase . ---------------------------------- Current data shows implied volatility (IV) is trending downward after a period of strong growth , with short-term (1-week) indices falling to around 54–56% , while longer-term (1-month) indices are stabilizing around 51–53% . This reflects a clear shift in market risk perception: from a defensive stance against volatility to a more balanced state. Observe the previous stages on the chart: ➟ When the market faced a shock (2020, 2022, 2024): IV increased sharply to >60% ➟ When the market stabilizes: IV decreases to the 45–50% range. Currently, IV is in the 50–56% range , significantly lower than volatility peaks but still above the long-term base. This indicates: ➟ The market has emerged from a state of stress. ➟ But things haven't completely returned to normal yet. Compared to the past, this is a typical characteristic of the post-turbulent – ​​early stabilization period . #hccventure #bitcoin #btc #news #onchain #cryptonews
Hold Coin CVenture tweet mediaHold Coin CVenture tweet mediaHold Coin CVenture tweet mediaHold Coin CVenture tweet media
English
2
0
11
16.9K
Hold Coin CVenture
Hold Coin CVenture@hccventure·
On-chain analysis week 8/2026: Political instability - Market decline Updated on-chain data for Q1 2026 shows that #Bitcoin is entering a stabilization phase after a liquidity slump, with prices fluctuating around $68,000–$71,000. ——————————————————————— The price drawdown from the all-time high (ATH) is one of the key metrics for assessing #Bitcoin's cyclical position within the long-term market structure. The latest on-chain data shows Bitcoin is currently trading in a correction phase, approximately -40% to -45% from its most recent ATH around $120,000 , bringing the price down to the $65,000–$70,000 range . This decline, when placed within Bitcoin's historical context, remains within the average range of major bull cycles. In previous bear market phases, #Bitcoin experienced significantly deeper drawdowns, typically ranging from -70% to -85% from the cycle peak . Therefore, the current correction reflects a rebalancing phase within a long-term bull cycle, rather than a structural weakening of the market. Similarly, during the 2017–2018 cycle, after setting an all-time high of nearly $20,000 , #Bitcoin experienced a prolonged bear market with a maximum drawdown of approximately -84% , bringing the price down to around $3,200 by the end of 2018. ——————————————————————— Total Supply in Loss (7-day moving average) reflects the proportion of #Bitcoin held at an unrealized loss, meaning the purchase price of the coins was higher than the current market price. The latest on-chain data shows that the amount of #Bitcoin in a loss has increased to approximately 9.2 million BTC , equivalent to nearly 46–47% of the total circulating supply . The sharp increase in loss-making supply is a sign that psychological and financial pressure is spreading across many investor groups, especially those who entered the market in the late stages of the recent bull cycle. However, given #Bitcoin's historical context, the current extent of unrealized losses typically occurs in the later stages of a bear market cycle , when much of the emotional selling pressure has already been reflected in the price. ——————————————————————— Historically, #Bitcoin's ATS (Average Price Action) phases approaching or exceeding the 0.8-1.0 threshold often coincide with strong market accumulation phases, as large investors accelerate their buying in the lower price ranges of the cycle. This occurred during the 2019-2020 period before the strong growth cycle to $64,000, as well as in early 2023 , when Bitcoin began to recover from the 2022 bear market. Conversely, when ATS remains below 0.5 for an extended period , the market typically enters a neutral or mild distribution phase, where large entities temporarily stay out of the market and new capital inflows are not yet strong enough to establish a sustainable uptrend. Current data suggests that ATS remains capped below 0.5 , reflecting a market state where large-scale investors are not yet ready to move into an active accumulation phase. ——————————————————————— The Realized Profit/Loss Ratio has fallen below 1.0 , marking a shift to an excess loss regime . This is a significant point in the market structure, because when this ratio is below 1, the value of realized losses across the network has exceeded the value of realized profits. Observing #Bitcoin's long-term cycle reveals that the Realized Profit/Loss Ratio typically fluctuates in distinct market phases. During periods of strong growth, this indicator usually remains between 2 and above 10 , reflecting an environment where the majority of transactions on the network are executed in a profitable state. The major cycle peaks of #Bitcoin in 2013, 2017, and 2021 all saw surges in the ratio, as speculative and new money flows pushed the asset's price to historical highs. #bitcoin #onchain #hccventure #news #crypto
Hold Coin CVenture tweet mediaHold Coin CVenture tweet mediaHold Coin CVenture tweet mediaHold Coin CVenture tweet media
English
1
2
2
16.6K
Hold Coin CVenture
Hold Coin CVenture@hccventure·
On-chain analysis week 5/2026: The market is experiencing a structural decline Bitcoin has confirmed a structural weakness as its price plummeted from its peak near $98,000 to the $72,000 area, equivalent to an approximate 26% correction, with persistently weak spot volume. ---------------------------------------- “#Bitcoin: Bear Market Rally Performance” highlights the common characteristics of the 2017–2018, 2019–2020, and 2021–2022 downturn cycles . Within the dominant downtrend, Bitcoin often experiences strong technical rallies (bear market rallies) with price swings of 40%–120% , but these do not alter the long-term downtrend structure. Compared to the lowest point of the 2022 cycle ( MVRV ~0.75 and the proportion of short-term holders supplying at loss exceeding 60% ), the current market has not yet reached an extreme capitulation state, but has entered a defensive phase as the proportion of short-term supply under loss pressure increases. The current dense accumulation zone is around $66,900–$70,600 , forming a significant cost cluster. In comparison to the 2022 cycle, the Realized Price (GM) zone acted as resistance for several months before the trend reversed. ---------------------------------------- The Mean Hash Rate (7-day SMA) directly reflects the security level and capital investment intensity of the Bitcoin mining ecosystem. The latest data shows the average hashrate fluctuating around ~930–960 EH/s after adjusting from its historical peak of ~1.15 ZH/s (1,150 EH/s). Compared to the local low in August 2024 (~610 EH/s) , the hashrate has increased by over 50% , confirming that the long-term expansionary structure of the network remains intact despite short-term price fluctuations. Given that BTC's price recently underwent a sharp correction from its peak above $120,000 to below $70,000 before recovering, the fact that the hashrate remains at historically high levels indicates that the supply structure – particularly from the miner side – is not experiencing widespread capitulation. This is of crucial importance for the sustainability of the cycle. This indicates that the current mining cost structure has been significantly optimized. Large-scale miners have restructured their debt and upgraded their machinery, resulting in lower break-even points compared to the previous cycle. ---------------------------------------- #Bitcoin's 4-Year Compound Annual Growth Rate (CAGR) reflects the average compound annual growth rate over a 4-year cycle – the timeframe corresponding to the halving structure. Following a price correction from the ~$120,000 range to the ~$65,000–$70,000 range , the 4Y CAGR has fluctuated around 0–0.1, the lowest since the 2022–2023 cycle bottom. Compared to the peak growth phase of the current cycle, the compound annual growth rate has decreased by more than 95% , confirming a clear phase shift from an expansion to a contraction phase of the cycle. From Q3/2025 , this index rapidly declined to below 1.0 , then broke through the 0.5 threshold, and at the end of 2025 even fell below 0. This means that the current price of BTC is no longer higher than the price four years ago according to the historical average growth rate. The structure is repeating a downward price pattern from approximately $120,000 to approximately $65,000 (a drop of nearly 45%) , while the 4-year CAGR is narrowing to a neutral level. This suggests that much of the cyclical growth has been absorbed and the price has been revalued. ---------------------------------------- While the price of BTC has corrected from its peak of approximately $120,000 to around $65,000–$70,000 (a drop of approximately 45%), the number of active addresses has decreased by more than 35% compared to its peak in early 2025 (~850,000–880,000 addresses). This clearly confirms the weakening of the on-chain demand structure and the significant contraction in network interaction. In early 2024, Active Addresses remained above 1,000,000 addresses (30D SMA) , reflecting strong network expansion coupled with price increases. However, by mid-2024, the index rapidly declined to approximately 650,000 addresses – equivalent to a nearly 40% decrease in just a few months. From late 2024 to early 2025, as prices recovered to the $110,000–$120,000 range , Active Addresses increased again to approximately $850,000–$870,000. However, this recovery was significantly lower than the early 2024 peak, indicating a negative divergence between price and network activity. #hccventure #onchain #bitcoin #news #crypto
Hold Coin CVenture tweet mediaHold Coin CVenture tweet mediaHold Coin CVenture tweet mediaHold Coin CVenture tweet media
English
2
0
2
47K
Hold Coin CVenture
Hold Coin CVenture@hccventure·
On-chain analysis week 3/2026: #Bitcoin is fluctuating amid political tensions As January 2026 drew to a close, #Bitcoin recorded a notable recovery from its short-term lows, clearly reflecting signs of temporary seller exhaustion after a period of sharp correction. -------------------------------------- Long-Term Holder Net Unrealized Profit/Loss (LTH NUPL) is one of the most important metrics for assessing the psychological state, the level of unrealized profit, and the cyclical behavior of long-term investors (coin age > 155 days). As of early 2026, LTH NUPL continues to maintain high profit margins, but has shown signs of cooling down compared to the most recent cyclical peak , indicating that the market is entering a period of psychological rebalancing after the distribution surge at the end of 2025 , rather than falling into a cyclical recession. Most long-term investors are still holding significant unrealized profits , but are no longer in the state of extreme euphoria seen at the peak. More importantly, the index has not returned to Fear or Capitulation zones , indicating that long-term confidence has not been broken . -------------------------------------- Unlike short-term cash flow indicators, the group of "coin age" indicators forms the structural foundation of the Bitcoin market , as they represent the behavior of investors with low capital costs, a long-term perspective, and the ability to significantly influence macroeconomic supply and demand. By early 2026, with #Bitcoin having undergone a strong distribution phase in late 2025 and entering a rebalancing phase, this index provides a crucial slice of the steadfastness of long-term investors . ➟ Supply that has been inactive for over a year (1y+) currently accounts for approximately 60% of total circulating supply , a slight decrease from the historical peak of nearly 65–67% recorded during the strong accumulation phase before breakouts. ➟ Supply of 2-year and 3-year-old assets remains at historically high levels , reflecting a core group of investors formed from the previous cycle with no signs of widespread exit. ➟ The supply of 5y+ continues its long-term upward trend , currently fluctuating around ~28–30% of total supply, close to its historical high. -------------------------------------- Total Supply Held by Long-Term Holders (LTH) is one of the most fundamental indicators for assessing market cycle status, reflecting cyclical distribution-accumulation behavior that is often slow but has a decisive impact on the long-term supply-demand structure of Bitcoin. Given that #Bitcoin has experienced a strong bull cycle and a correction/rebalancing phase towards the end of 2025, analyzing the LTH Supply allows for a clear identification: is the market in a distribution phase at the peak, or is it simply a correction within a larger uptrend ? The total supply of $BTC held by Long-Term Holders currently fluctuates around ~14.2 – 14.4 million $BTC , lower than the historical peak of approximately 14.8 – 15.0 million $BTC recorded during the previous peak accumulation phase. Compared to the 2021–2022 cycle bottom, when LTH Supply dropped sharply to ~11.6 – 11.8 million $BTC, the current level is still over 2.5 million $BTC higher , reflecting a very solid foundation for long-term holding. -------------------------------------- At the beginning of 2026, the Realized Profit by Profit Margin (7-day EMA) focuses on the low-profit group of 0–20% , representing short-term investors, tactical traders, and those selling near the break-even point. This group is highly sensitive to price fluctuations and often plays a decisive role in the intermediate accumulation and distribution phases of the cycle. Realized profits for the 0–20% margin group remain high and stable , with peaks fluctuating around $300–500 million/day (7-day EMA) during recent price rallies. ➟ Compared to previous cyclical peaks, where realized profits typically came from the group with >100% margin, the current structure leans heavily towards thin profit margins , suggesting the market has not yet entered a state of extreme euphoria. ➟ Compared to the low point of 2022–2023, when Realized Profit was almost exhausted and frequently below $50–100 million per day , the current level is many times higher, reflecting a significant recovery in liquidity and trading activity . #hccventure #bitcoin #onchain #cryptonews
Hold Coin CVenture tweet mediaHold Coin CVenture tweet mediaHold Coin CVenture tweet mediaHold Coin CVenture tweet media
English
1
2
2
17.2K
Hold Coin CVenture
Hold Coin CVenture@hccventure·
Crypto #ETF capital flows are currently showing a clear but uneven recovery , with #Bitcoin #ETFs playing an absolute leading role. After a period of significant volatility in December, capital flows reversed positively from the beginning of January 2026 and maintained continuous inflows for the past three weeks. In the week ending January 19, 2026 alone , #Bitcoin #ETFs recorded net inflows of over $620 million , confirming that #Bitcoin continues to be a "safe haven" for institutional capital in the crypto ecosystem. The #Ethereum #ETF shows a similar trajectory but with smaller amplitude and a clear lag. Despite experiencing weeks of negative or neutral inflows in December, the $ETH #ETF shifted to a stable inflow from the end of the month and reached nearly $100 million in the most recent week. The Other Crypto #ETFs group (including ETFs/ETPs linked to Solana and other altcoins), although much smaller in scale, has begun to see consistent inflows in the first weeks of 2026. The fact that altcoin ETF inflows have turned positive, albeit in limited absolute value, indicates a selective expansion of risk appetite , particularly from investors outside the US and those listed in Europe. Overall, the current capital flow structure reflects a sequential capital allocation cycle . #Bitcoin #ETFs were the first and largest recipients of capital, #Ethereum #ETFs benefited in the next phase as market confidence strengthened, while altcoin #ETFs only began attracting capital when the risk environment became more favorable.
Hold Coin CVenture tweet media
Minh Huy | Founder HCCVenture@MHuy_hccventure

x.com/i/article/2014…

English
0
2
2
43.6K