Igor Logvinenko

2.1K posts

Igor Logvinenko banner
Igor Logvinenko

Igor Logvinenko

@igorlogvinenko

Prof @ Oxy || Political economy of the energy transition. Documenting my work: https://t.co/NBG3YTAzoq

SoCal; NorKyrg Katılım Ocak 2010
2.3K Takip Edilen822 Takipçiler
Igor Logvinenko retweetledi
John Bistline
John Bistline@JEBistline·
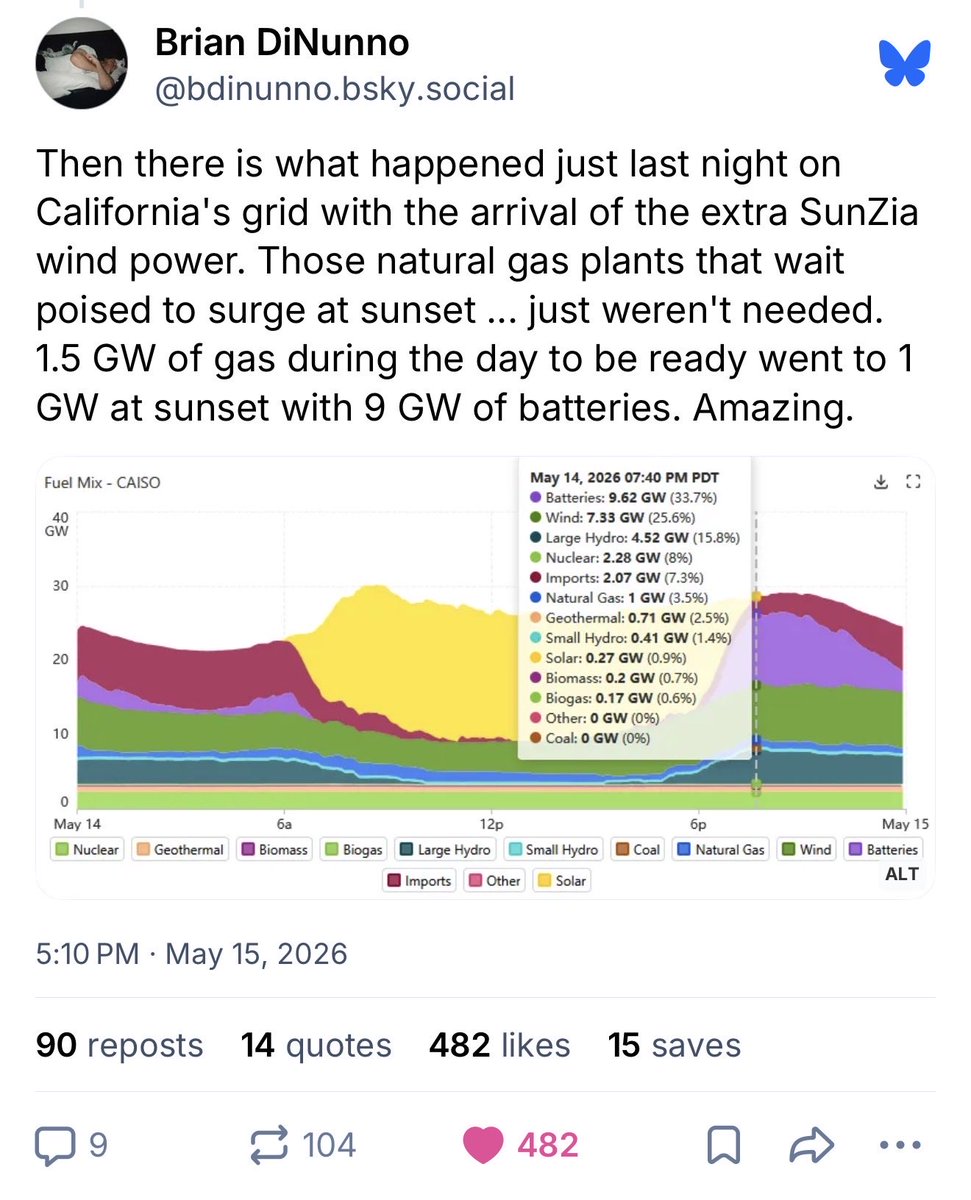
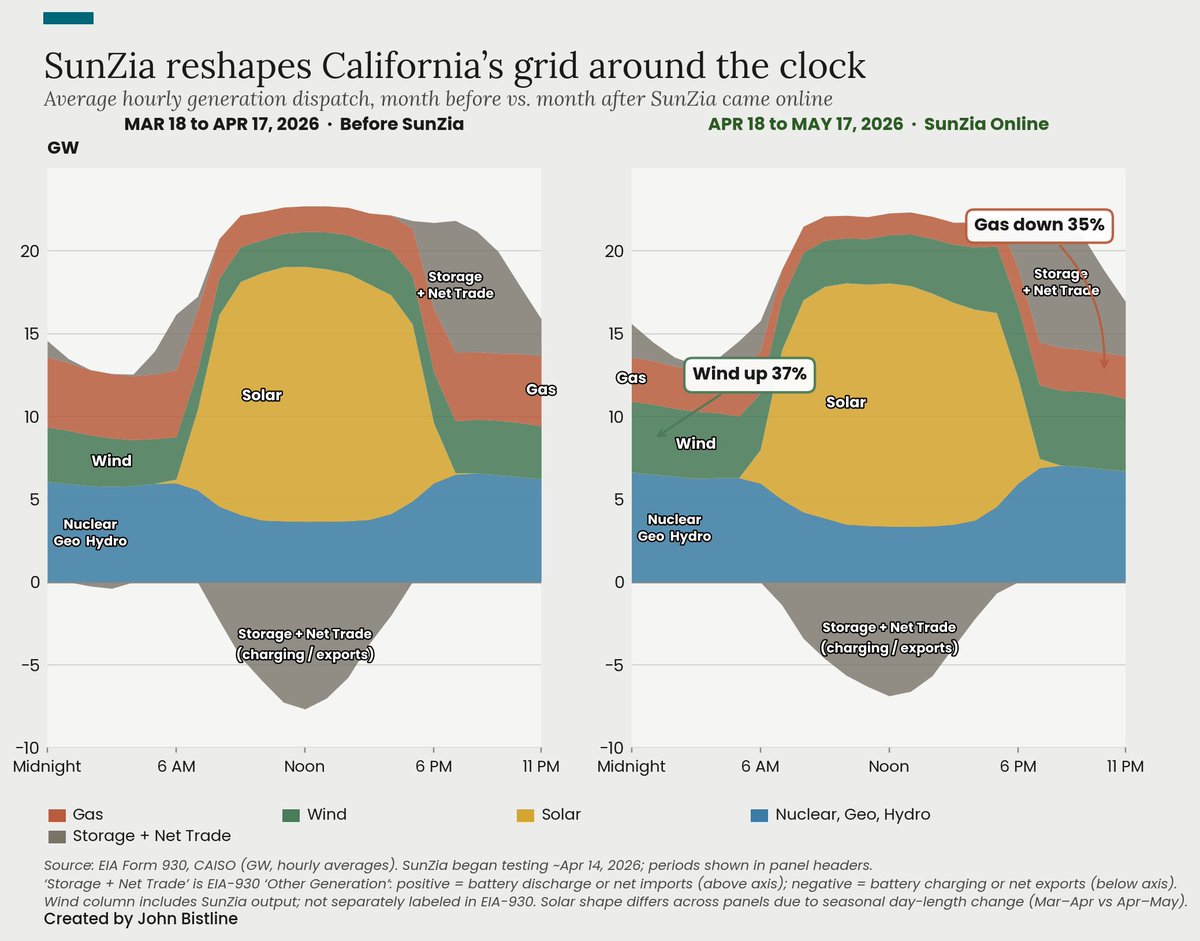
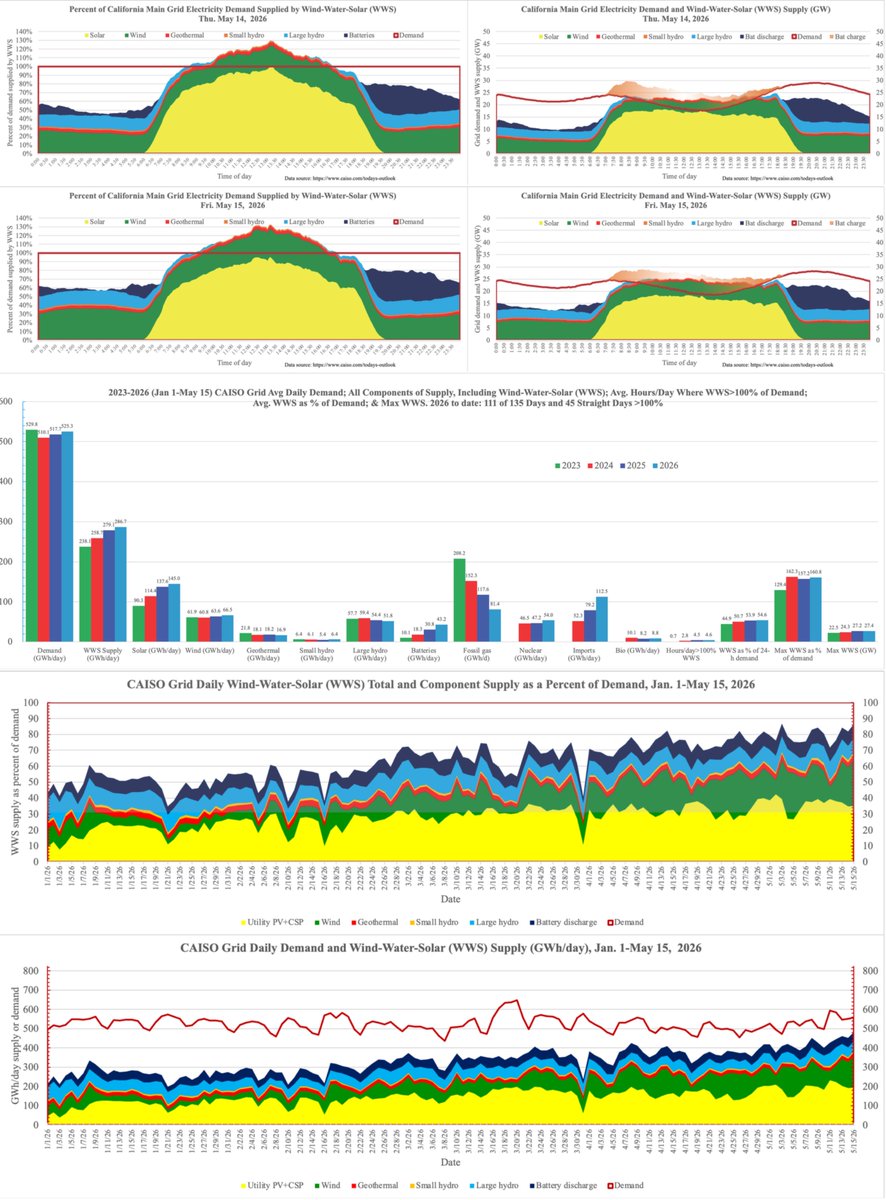
Does new transmission actually move the needle on clean energy? Here's a month of California data before and after SunZia came online. Wind is up by a third, and gas down by a third. Judge for yourself.
John Bistline tweet media
English
8
38
168
8.1K
Igor Logvinenko retweetledi
Assaad Razzouk
Assaad Razzouk@AssaadRazzouk·
New data from Ember: When renewables drive gas below a 20% grid share in Britain, wholesale power prices crash from £130 down to £60/MWh, a 54% drop >We're finally breaking the power that volatile natural gas prices have held over electricity bills in so many countries for decades >Because of marginal pricing rules, the most expensive power plant needed to meet demand sets the price for the whole grid. So gas dictated everything. But superior renewables technology and zero-fuel-cost physics are completely disrupting that system >When wind and solar surged in Britain last year and pushed gas down to less than 20% of the electricity mix, wholesale electricity prices plummeted to an average of £60/MWh >When fossil gas ran the show at over half the mix, the price was £130/MWh >Right now, 15% of Britain's electricity generation has completely decoupled from gas volatility. It's locked in under the Contracts for Difference scheme across 10 GW of operating wind and solar assets >By 2030, that number jumps to more than a third of the grid. That means 36 GW of clean capacity acting as a permanent, iron-clad shield against international fuel price spikes This isn't just a British story. It's a blueprint for energy planners anywhere in the world, from Berlin to Jakarta: If your grid relies on commodities shipped across oceans or through pipelines, you don’t have an energy strategy, you have a security threat while handing a blank check to foreign cartels
Assaad Razzouk tweet media
English
9
86
252
7.2K
Igor Logvinenko
Igor Logvinenko@igorlogvinenko·
@ukboomers I cannot bring myself to give up my lattes and avo toast. Had I started saving £15 a day eighteen years ago, when I was just two-and-twenty, I should now have £200,000 saved towards a deposit. Instead, I'm afraid I chose immediate indulgence, and I've only myself to blame.
English
2
0
20
736
John & Margaret
John & Margaret@ukboomers·
Genuine question to millennials and gen-Z. What stops you from buying a house? That's us at 26.🇬🇧
John & Margaret tweet media
English
137
28
1.2K
46.7K
Igor Logvinenko
Igor Logvinenko@igorlogvinenko·
Having said that - NY's weird tier system that privileges older workers is unfair. A New York Tier 6 worker hired after 2012 pays roughly five times more into the pension over a career, retires eight years later, and collects a smaller yearly benefit than a Tier 4 colleague.
Igor Logvinenko tweet media
English
0
0
1
122
Igor Logvinenko
Igor Logvinenko@igorlogvinenko·
A first-year NYC teacher earning $61,070 would spend about 93 percent of after-tax pay on median Manhattan-area rent. Even a five-year NYPD officer with overtime is well above HUD’s 30 percent “cost-burdened” line. High-cost metros erase much of the headline pay advantage.
Igor Logvinenko tweet media
English
1
0
0
39
Igor Logvinenko
Igor Logvinenko@igorlogvinenko·
There are some well-off public sector employees, but for the most part - they are not paid very well at all. Some figures below:
English
1
0
0
24
Igor Logvinenko retweetledi
FT Energy
FT Energy@ftenergy·
NextEra strikes megadeal with Dominion to create $400bn US utility ft.trib.al/ich6acT
English
0
10
20
2.8K
Igor Logvinenko retweetledi
Jesús Fernández-Villaverde
Jesús Fernández-Villaverde@JesusFerna7026·
Smartphones are not the explanation for the recent decline in fertility. Instead, they are an accelerator of deeper forces already at work. Let’s start with the facts. Fertility is falling almost everywhere: in rich, middle-income, and poor countries; in secular and religious countries; and in countries with high and low levels of gender equality. The decline accelerated around 2014. So, no country-specific explanation will work unless you are willing to believe that 200 distinct country-specific explanations arrived at roughly the same time. Smartphones look like the obvious candidate: the first iPhone was released in 2007, and global adoption has been astonishingly fast. Economists understand the first major decline in fertility in advanced economies, from 6 or 7 children per woman throughout most of human history to about 1.8, that occurred between the early 1800s and roughly 1970, well before smartphones. The main drivers were a sharp fall in child mortality (effective fertility was rarely above 3 and often close to 2) and the shift from a low-skill, rural agrarian economy to a high-skill, urban industrial one. We have quantitative models that fit these facts well. Country-specific factors mattered too, of course. Proximity to low-fertility neighbors accelerated Hungary’s decline, while fragmented landowning structures accelerated France’s. But these were second-order mechanisms. This is also why most economists long considered Paul Ehrlich’s doom scenarios implausible. We forecast that fertility in middle- and low-income economies would follow the same path as in the rich, probably faster, because reductions in child mortality reached India or Africa at lower income levels (medical technology is nearly universal, and most gains come from handwashing and cheap antibiotics, not Mayo Clinic-level care). Much of what we see in Africa or parts of Latin America today is still that old story. But in the 1980s, a new pattern appeared. Japan and Italy fell below 1.8, the level we had thought was the new floor. By 1990, Japan was at 1.54 and Italy at 1.36. This second fertility decline began in Japan and Italy earlier than elsewhere, driven by country-specific factors, but the underlying dynamics were widespread: secularization, an education arms race, expensive housing, the dissolution of old social networks, and the shift to a service economy in which women’s bargaining power within the household is higher. The U.S. lagged because secularization came later, suburban housing remained relatively cheap, and African American fertility was still high. U.S. demographic patterns are exceptional and skew how academics (most of whom are in the U.S.) and the New York Times see the world. My best guess is that, without smartphones, Italy’s 2025 fertility rate would be about 1.24 rather than 1.14. I doubt anyone will document an effect larger than 0.1-0.2. Italy was at 1.19 in 1995, not far from today’s 1.14. The TFR is cyclical due to tempo effects, so I do not read too much into the rise between 1995 and 2007 or the decline from 1.27 in 2019 to 1.14 today. The direct effect of smartphones is not zero, but it is not, by itself, that large. Where social media, in general, and smartphones, in particular, matter is in the diffusion of social norms. What would have taken 25 years now happens in 10. Social media are not the cause of fertility decline; modernity is. But they are a very fast accelerator. That is why social media are a major part of the story behind Guatemala (yes, Guatemala) going from 3.8 children per woman in 2005 to 1.9 in 2025. Without them, Guatemala would also have reached 1.9, just 20 years later. Modernity, in its current form, is incompatible with replacement-level fertility. By modernity, I do not mean capitalism: fertility fell earlier and faster in socialist economies than in market economies. Socialist Hungary fell below replacement in 1960, and socialist Czechoslovakia in 1966 (both experienced small, short-lived baby booms in the mid-1970s). By modernity, I mean a society organized around rational, large-scale systems and formalized knowledge. Countries will not converge to the same fertility rate. East Asia is likely stuck near 1, possibly below, given its unbalanced gender norms and toxic education systems. Latin America faces the same gender problem plus weak growth prospects, so I expect something around 1.2. Northern Europe has more egalitarian family structures and might hold near 1.5. The very religious societies are probably the only ones that will sustain 1.8. All of this could change with AI or changes in population composition. We will see. But on the current evidence, deep sub-replacement fertility is the “new new normal.” Unless we reorganize our societies, better learn to handle it as best we can.
Jesús Fernández-Villaverde tweet media
English
213
888
3.6K
831.7K
Mark Z. Jacobson
Mark Z. Jacobson@mzjacobson·
Fossil gas sputters to a record low, meeting only 2.88% of demand (16.1 GWh) as record new nighttime wind on the @California_ISO grid complementing daytime solar and batteries kicks it to the curb. New wind record 8.29 GW at 1:40 AM on May 15, 2026 due to the SunZia line from New Mexico (now part of CAISO grid). Wind output record has increased by 1.64 GW since March 25, 2026. 77.7% of demand on May 15, 2026 met by WWS generators + another 8.77 GW from batteries for a total of 86.5% met by in-state WWS. 45th straight and 111 of 135 (82.2%) days in 2026 with WWS > 100% of demand for part of day. Gas down 61%, solar up 61%, batteries up 328% in '26 v '23.
Mark Z. Jacobson tweet media
English
7
58
115
9.6K
Igor Logvinenko
Igor Logvinenko@igorlogvinenko·
By 2030, China will be adding a US-grid worth of ren energy.. every year
Our World in Data@OurWorldInData

China added a Germany-sized electricity grid last year— (This Data Insight was written by @_HannahRitchie and Pablo Rosado.) We’ll often see headlines quoting how many gigawatts of new solar farms or coal plants China is building. But it’s hard to get a meaningful sense of scale for how electricity generation in China is changing. The chart puts it in perspective. In 2025 alone, China’s electricity generation increased by almost 500 terawatt-hours (TWh). This is compared here to the total amount of electricity that whole countries generate each year. Germany generates almost exactly that amount. That means China effectively added a Germany-sized grid to its electricity system in just one year. What’s also quite staggering is that almost all of this new generation came from solar and wind. China generated 340 TWh more electricity from solar than the year before. That’s more than our two home countries, the UK and Spain, generate from all sources each year. Low-carbon sources grew so much that coal power in China actually fell slightly.

English
0
0
0
121
Igor Logvinenko retweetledi
Dustin Mulvaney
Dustin Mulvaney@DustinMulvaney·
The age of natural gas for electricity in California is coming to an end.
Dustin Mulvaney tweet media
English
35
66
366
40K
Igor Logvinenko retweetledi
Dr Paul Dorfman
Dr Paul Dorfman@dorfman_p·
Nuclear is already too late and too costly to play any positive role in tackling the climate and energy crises. What’s worse, every pound invested in nuclear is a pound not invested in renewables, energy efficiency, storage and grid resilience - investments that would provide a much bigger pay-off. bennettinstitutesussex.org/stories/nuclea…
English
55
115
192
4.5K