Infogram

14.1K posts

Infogram banner
Infogram

Infogram

@infogram

📊 Engage your audience with unique #dataviz, infographics, social media posts, and more.

Everywhere Katılım Mayıs 2011
4.4K Takip Edilen14.8K Takipçiler
Sabitlenmiş Tweet
Infogram
Infogram@infogram·
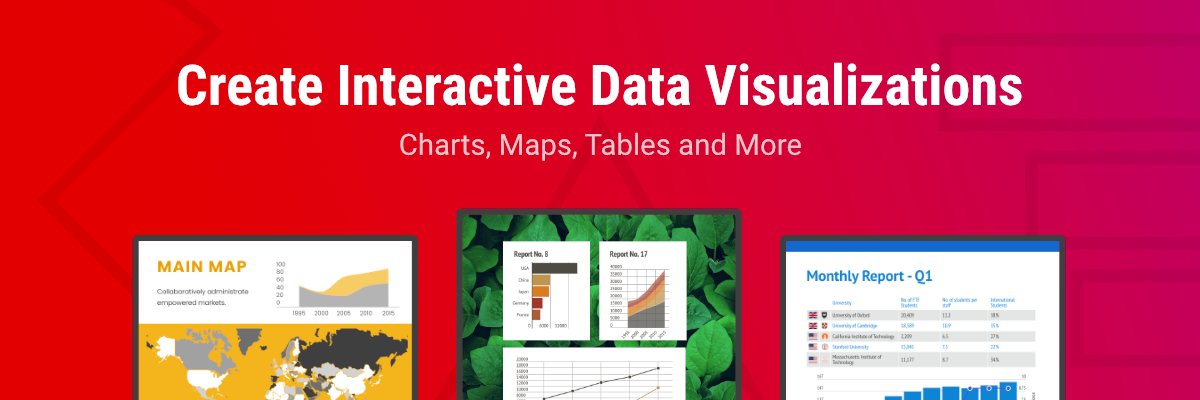
Creating #dataviz projects should be effortless! Infogram's #AI tool makes creating data visualizations fast and easy for everyone. Generate charts, craft #infographics, and make your message more impactful - all with the help of AI. ✨ Learn more: bit.ly/4atz4jW
English
1
1
3
1.8K
Infogram
Infogram@infogram·
See how paid maternity, paternity, & parental leave compares across countries in 2023. 🌎 This stacked bar chart reveals the number of paid leave days for each. ✨ Explore the data, visualized with Infogram!
Infogram tweet media
English
0
1
1
472
Infogram
Infogram@infogram·
Which domains are leading the way with notable AI systems? 🤔 Explore the trends in this chart! ✨ Start sharing your own AI insights with Infogram today! #ArtificialIntelligence #AI
Infogram tweet media
English
0
0
0
355
Infogram
Infogram@infogram·
Make your line charts stand out with Infogram’s data animations! 🤩 ✔️ Capture attention. ✔️ Highlight trends with ease. ✔️ Create engaging, polished visuals. Transform your storytelling today with Infogram! ✨ #Charts #DataVisualization
English
0
0
0
353
Infogram
Infogram@infogram·
Where is the corporate world investing in AI? 💡 This column chart shows annual global corporate AI investment by type. ✨ Visualize your data with Infogram today! #ArtificialIntelligence #AIInvestment #AI
Infogram tweet media
English
1
0
1
297
Infogram
Infogram@infogram·
Interactive infographics make data engaging, dynamic, and easy to explore—and we've got the guide to help you create one! ✨ Turn your data into an engaging story! 🎯 Read more: infogram.com/blog/what-is-a… #Infographics
English
0
0
2
277
Infogram
Infogram@infogram·
📊 Tracking the number of countries with key economic & social rights for women. See how this line chart visualizes the changes over the years—created with Infogram. ✨ Dive into the data and track progress! #IWD2025
English
0
0
1
246
Infogram
Infogram@infogram·
Make your visuals more inclusive with accessibility patterns! 💡 Infogram’s accessibility patterns let you distinguish data without relying only on color, making your charts more readable and engaging! 🌐
English
0
0
0
210
Infogram
Infogram@infogram·
💡 Did you know? Women in STEM (Science, Technology, Engineering, Mathematics) earn less on average than men. This chart shows the median earnings in STEM fields, highlighting the wage gap. 💡 #STEM #DataVisualization
Infogram tweet media
English
0
0
0
220
Infogram
Infogram@infogram·
Ready to improve your Gantt charts? Check out our visualized dos and don’ts of gantt charts in the post! 💡 📊 Start visualizing better with Infogram today!
Infogram tweet mediaInfogram tweet mediaInfogram tweet mediaInfogram tweet media
English
0
0
0
195
Infogram
Infogram@infogram·
This chart, created with Infogram, highlights the U.S. population (ages 18–74) by labor force status in 2021—shedding light on ongoing gender disparities in STEM (Science, Technology, Engineering, Mathematics) fields. ✨ Want to tell your own stories through data? Try Infogram!
Infogram tweet media
English
0
0
0
198
Infogram
Infogram@infogram·
Today is International Day of Women and Girls in Science! 👩‍🔬 Our blog explores the importance of women and girls in STEM fields, featuring an eye-opening infographic exploring the gaps. Read the article: infogram.pulse.ly/9o2ub8hmmt #WomenInSTEM #IDWGS2025
English
0
0
0
184
Infogram
Infogram@infogram·
💘 Experience gifts are becoming the new Valentine’s Day favorite! Our line chart shows how giving experiences has steadily risen over the years. ✨ Create visuals like this with Infogram! #ValentinesDay #ValentinesDay2025
Infogram tweet media
English
0
0
1
193
Infogram
Infogram@infogram·
🚀 What’s new on Infogram? ✨ Data animations: Add motion to line charts. 🎨 Accessibility patterns: Make visuals inclusive with patterns. 💡 Tooltip customization: Tailor tooltips with light, dark, or transparent modes. Ready to try? Start creating today!
English
0
0
0
196
Infogram
Infogram@infogram·
Need accurate maps for your data? Infogram lets you locate regions, cities, and countries with ease, even when you have a typo. Create stunning, precise maps for any project! 🤩💡 #Interactive #Maps
English
0
0
0
205
Infogram
Infogram@infogram·
Learn the key tips for visualizing a process—from flowcharts to timelines, we’ve got you covered with design tips to make complex steps clear and engaging. 💡 👉 Read more: infogram.com/blog/process-v…
English
0
0
0
175
Infogram
Infogram@infogram·
See our visualization of the Global Gender Gap in Secondary Education (%), showing where progress has been made. 📊 Let’s push for equal education opportunities worldwide. Create visuals like this with Infogram! 💡 #DataVisualization #GenderEquality
Infogram tweet media
English
0
0
1
173