Sabitlenmiş Tweet
Schism
4.6K posts

Schism
@jatkinson33
Charts....Think for Yourself-Question Authority
DFW Katılım Ocak 2012
1.4K Takip Edilen11K Takipçiler

@Matt41145588 The echo born from the Aug 1896 low to the Sept 1929 top has marked several pivotal areas. Dec 27 on deck.

English

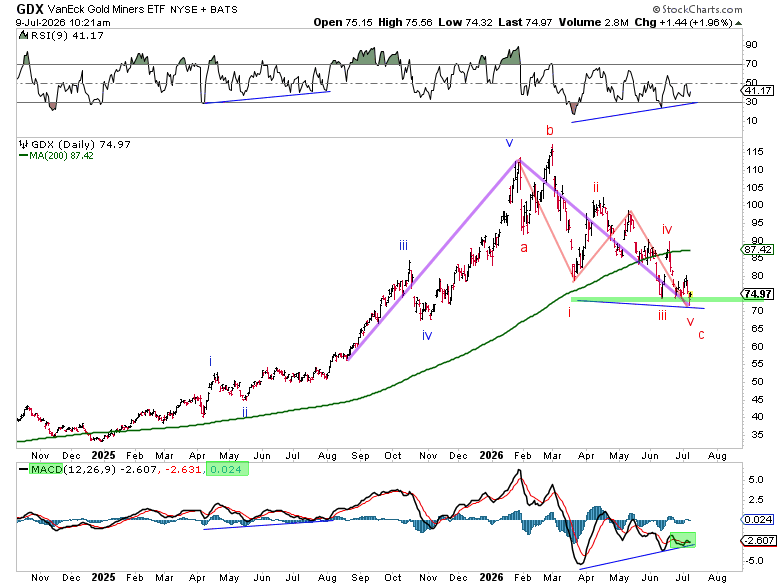
$XAU did ultimately work its way down to a backtest. Let's see how next week acts.... I think if it gets pushed down this week under these levels it will be snapped up to fix the monthly candle the following week. In a perfect world we stabilize here and now but another bout of chaos is possible. PTSD always has me feeling like OML is possible. $GDX $GDXJ $HUI $GDM

English

@jatkinson33 Make sense . I just want to see the dollar fall this week and not turn back up
English

$Silver has retraced an entire quarter of the spot channel coming up just shy of the big backtest...futures did hit the rail. This is also occurring in the 1.61 ext in time of the 2000's bull run echo. I leave room for 1 more shakeout because the pattern is rather famous at this point but if you don't buy here then where. $GOLD $GDX $GDXJ $SIL $SILJ

Schism@jatkinson33
Some old $SILVER charts for a Saturday...
English


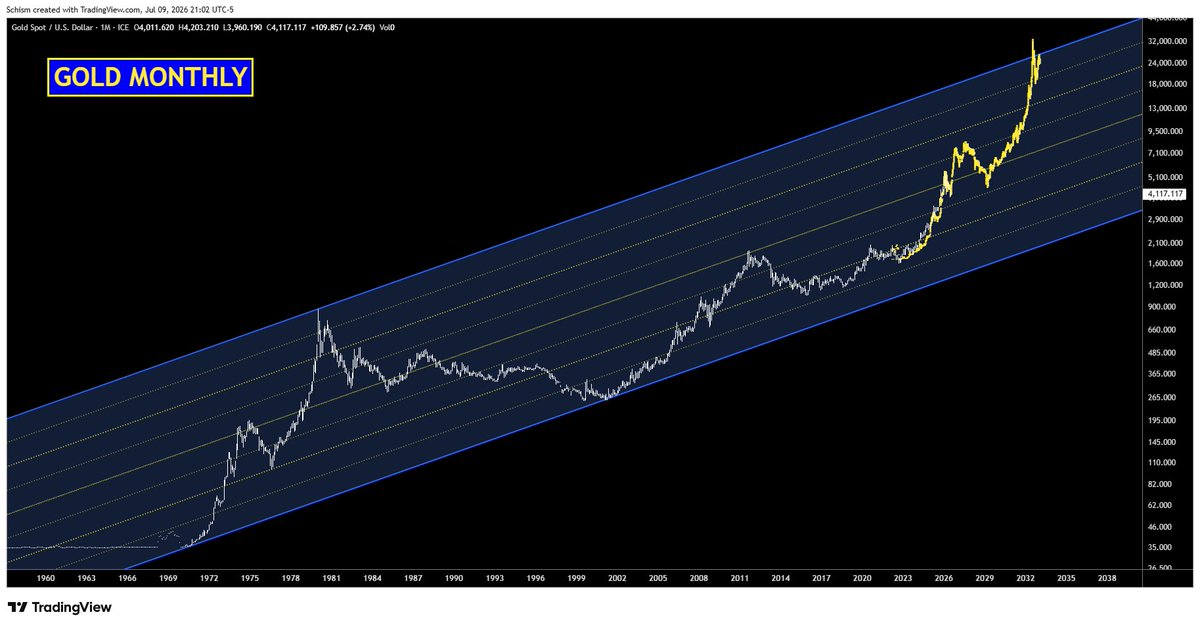
@SilverSurfer_23 @TheDailyGold it is just an overlay but it was centered on the current correction. Regardless, it's still a nice fit if you take the london gold pool pop out and just start from the double bottom. Im looking at a top between sept-dec 2027 if we track.
English

@jatkinson33 @TheDailyGold Wow Is this legit? Is scale or anything changed or just simply overlaid from 1970s?
English

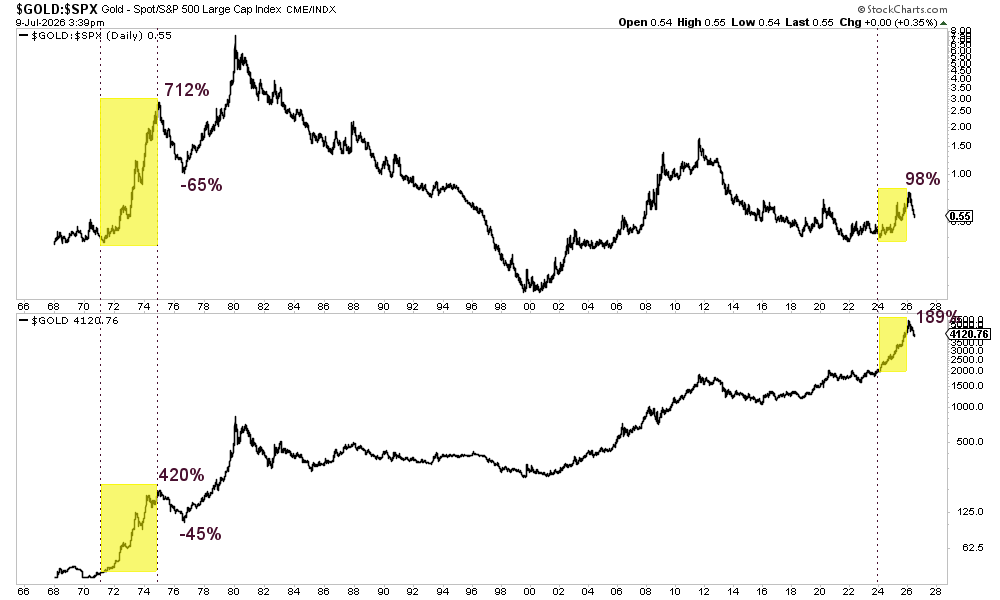
Gold isn’t showing the classic topping characteristics we saw in 1980, 2011–12, or 1975–76: no prolonged distribution, no major relative peak vs stocks, no true bearish consolidation.
The 1975–76 ~50% decline came after an extreme move. Gold surged 5x in 4 years and +712% vs stocks.
Compare that to today: 189% over 2 years and ~100% vs stocks. Strong, but not remotely the same magnitude.
Even the 2018–2026 advance, which is closer to 1971–74, included a 3-year-long consolidation.
In 1975–76, Gold retraced ~58% of its prior gain. A similar retracement today would imply $3450. Not a prediction, just historical context.
Bottom line: The real rotation phase (1971–74, 2001–03) still lies ahead.

English

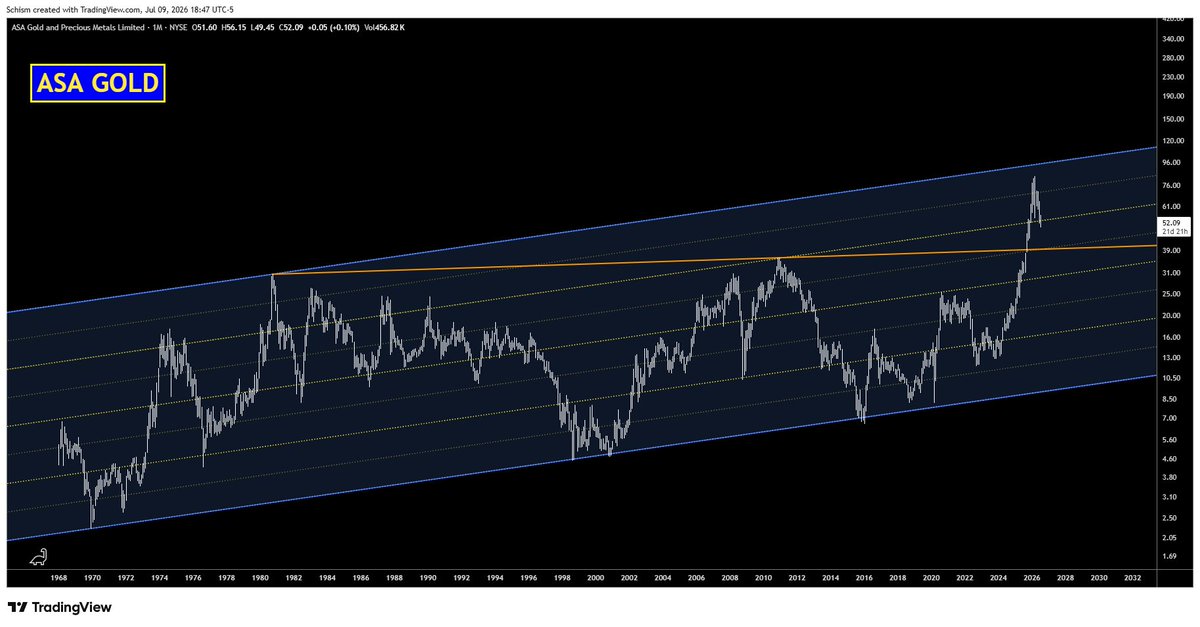
This $ASA chart is the closest chart that resembles the long term $BGMI chart....even though it's lacking 35 years. This might be the most important chart to monitor if lower levels are seen. A backtest of this 45 year breakout is significant imo.
I would consider $40 a low-risk entry.
$GOLD $SILVER $GDX $GDXJ

Patrick Karim@badcharts1
Show this to your favorite gold & silver miner gurus when they try to convince you this is a lower risk, higher reward entry point. Unwind still in progress. Only proper chart analysis can showcase this. I am not trying to be hostile, just trying to help out.
English

@iMonk2334 @that_grey_beard we were just bullshitting ideas....I would like to see a move up into oct or even november and then correct into feb
English

@jatkinson33 @that_grey_beard So is the view gdx bottoms or tops in early Sept.
I’m slow and not following this exchange :)
English

We shall see...we haven't seen an echo of the 80-90 bear since march 2019 and the one before that marked the sept 2011 top. In percentage terms gold is 4% away from the 2008 decline which is wild. If it is destined for the 4th wave shelf/gap fill there is some confluence around 9/18-21. Each rally has been 18/19 tds. That does set up an interesting 55 cd window remaining into an overall 233 cd window from the jan top. But good luck squaring the miners in that scenario unless they put in a freaking ripper of a b wave. That would be a 38% overall decline in gold.

English

@jatkinson33 Moar early October as late September almost always is negative energy in reality or scar tissue makes me think that no matter what
English

@that_grey_beard reminds me of the time when I was tracking gold on the nov 2016 trump spike and it bottomed 610 trading hours later...thought I was a genius. lol In reality it drug me to the deep end overcomplicating shit.
English

@jatkinson33 My favorite, and I just did it today, was converting Armstrong dates that go out to six decimal places and then I laugh and think am I supposed to map that to the hour and minute... and in Greenwich mean time or EST... or perhaps round to the closest week day?
GIF
English


@jatkinson33 I will say I have a heat seeker into... guess ... the 23rd... even though I don't do calendar days... tds only for this day counter
GIF
English

Long $BRC.v since C$0,35. I don't know if that upper rail is possible, will depend on the gold and silver price.
I'd say C$4 at the current metal prices is a more conservative price target.
Schism@jatkinson33
Interesting chart in Blackrock Silver...echoes of the previous correction have been marking inflections cleanly. Nice bt if it can hold. $BRC $SIL $SILJ $BKRRF
English