Rupan retweetledi

S&P 500✨
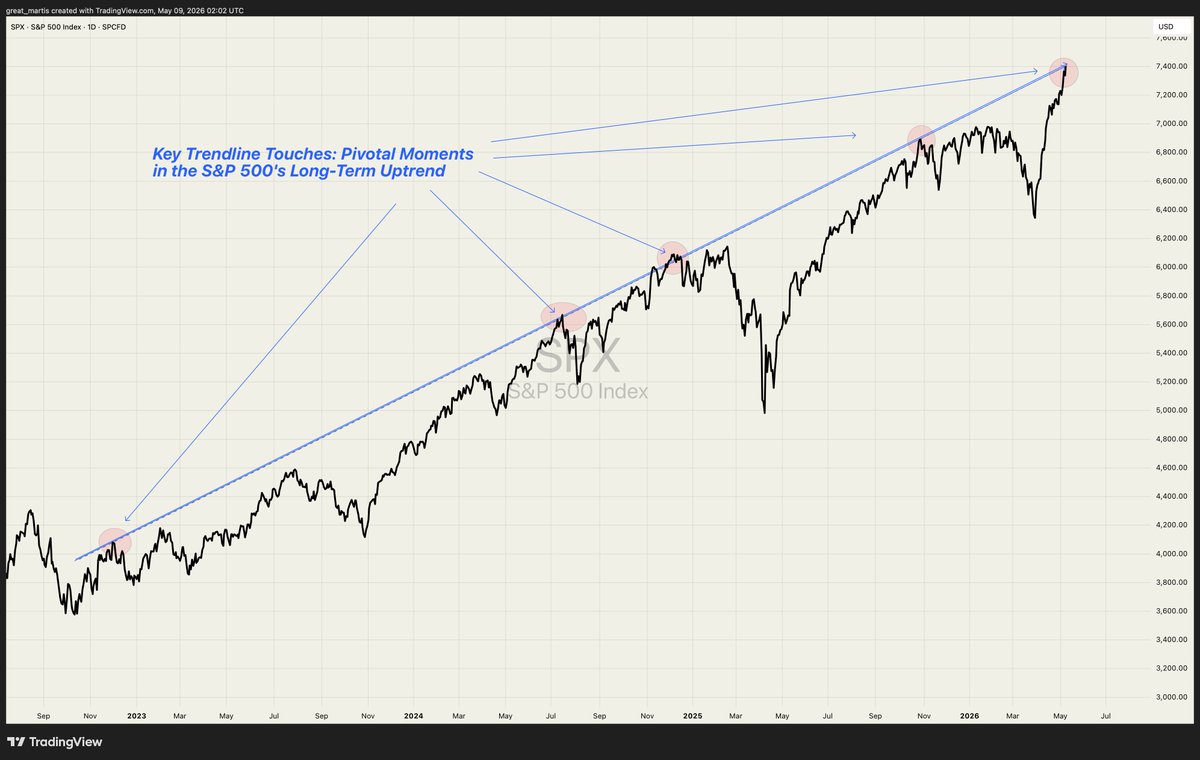
Chart Breakdown
Take a look at these textbook touches on the upper boundaries of the long-term rising channel.
Multiple clean rejections off the parallel blue trend lines each one marked stretching back years.
The price has ridden this channel higher, but every time it kisses the ceiling, it eventually respects it.
Now we have the latest touch right here at the all time high near 7,400.
Another perfect reaction to the uppermost line in this parabolic run.
These repeated upper channel taps don’t happen by accident.
In markets like this, they’re classic signs of exhaustion.
The momentum is stretching thin.
History is very clear: these types of extended runs rarely sustain themselves, and they almost never end well.
Yours truly,
The Great Martis✨
English