JC Peralta

9.9K posts

JC Peralta banner
JC Peralta

JC Peralta

@jcacperalta

he/him | geospatial data scientist | climate scientist | energy modeler | mostly science posts | anime | VIEWS 💯 MY OWN 🇵🇭

National Capital Region Katılım Temmuz 2015
1.2K Takip Edilen1.4K Takipçiler
JC Peralta retweetledi

Yohan
Yohan@yohaniddawela·
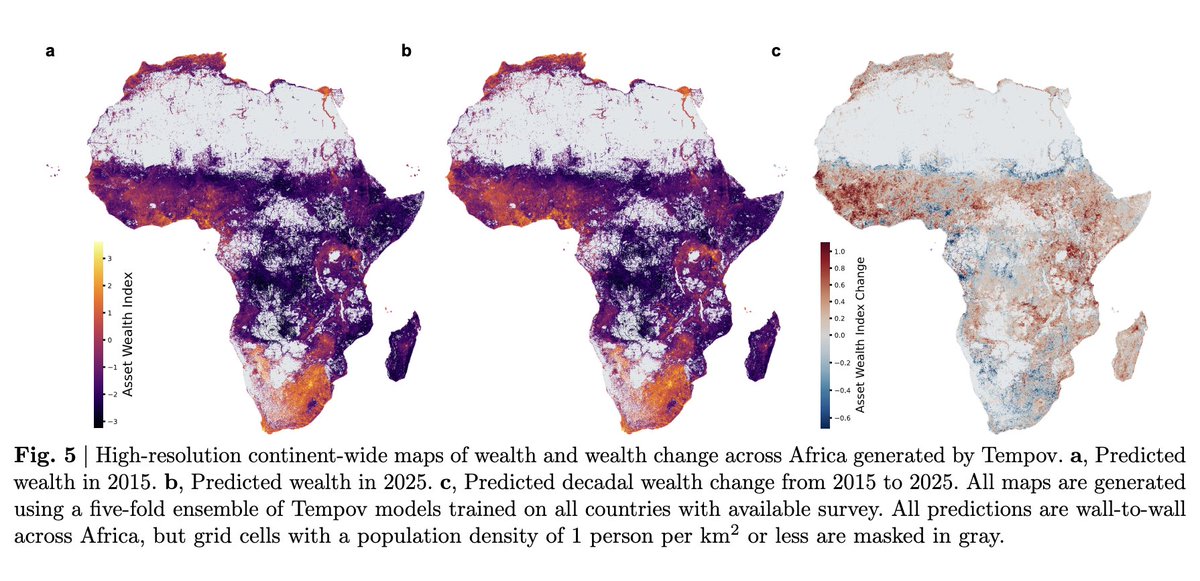
A new geospatial foundation model can now estimate how poor your neighbourhood is, track how fast that's changing, and do it without anyone filling out a single survey form. A team of Stanford researchers just published Tempov, a foundation model trained on three million pairs of Landsat images spanning two decades. It takes raw satellite imagery and predicts asset wealth at the village level, across entire continents, updated in near real-time. The benchmark numbers are worth sitting with. In Malawi and Mozambique, the model explains 87% and 74% of the variation in household wealth from satellite imagery alone. That's from six spectral bands. No census forms. No field enumerators. No mobile phone metadata. The harder problem is tracking change, not just level. Most existing models are trained to predict a static snapshot. When you ask them to predict how wealth shifted between 2008 and 2018 in the same locations, performance collapses to near-random. Tempov holds at R² = 0.69 for Malawi and 0.46 for Mozambique on that same change-tracking task. What makes the difference is how the model was pretrained. The researchers constructed bitemporal image pairs that maximise seasonal variance, then forced the model to learn representations that are stable across seasons but sensitive to genuine long-run economic shifts. The learned embeddings spontaneously delineate road networks, urban structure, and agricultural patterns from natural background, without ever being told to. The scarcity problem is where it gets interesting for development economics. The standard tools for measuring poverty rely on the Demographic and Health Surveys. DHS data is spatially sparse and resurveyed infrequently. The correlation between asset wealth in Malawi's earlier and later censuses is only 0.42. In Mozambique it's actually negative: -0.71. Tempov gets around this with a two-stage adaptation. Train on historical census data, then fine-tune to the target year using only 5% of contemporary survey points. With that 5% adjustment, it outperforms geospatial foundation models that were given 100% of available survey data. Combining a strong historical prior with minimal contemporary calibration can substitute for the full survey investment. The researchers then deployed it continent-wide. Five models trained under cross-validation on all 34 African countries with recent DHS surveys, averaged into a single ensemble, producing 6 km × 6 km wealth maps for the entire African continent in 2015 and 2025. Roughly 80% of measured wealth inequality across the continent is within countries, not between them. The decadal change map shows wealth gains concentrated in West and East Africa and substantial declines across parts of Southern and Central Africa. Country-level factors explain only about a third of the variation in wealth change. Local temperature trends and nearby conflict events predict the changes better than institutional-quality proxies do. For the applied economics side: the model achieves competitive performance with 10% of available survey samples where baseline foundation models need 100%. That's not a modest efficiency gain. That's a different cost structure for poverty measurement entirely. DHS survey rounds are already under funding pressure. The World Bank's Living Standards Measurement Surveys have become increasingly irregular. The status quo is a slow degradation in the quality and frequency of ground-truth data on living standards in the places that most need monitoring. What Tempov suggests is that the role of household surveys may be shifting from the primary measurement instrument to the calibration anchor. You don't stop running surveys. You run fewer, target them better, and use them to tune a model that fills in the rest from orbit. The code and weights are open-source. The continent-wide wealth maps are public. The methodology is reproducible by a national statistics office with a laptop and a moderate AWS bill. The hard part was always getting data out of places that couldn't afford to collect it. That constraint just got significantly looser. Link to paper: arxiv.org/pdf/2604.23166
Yohan tweet media
English
2
43
170
8.9K
JC Peralta retweetledi
Roan
Roan@RohOnChain·
This 1 hour MIT lecture by Jim Simons (Quant King) will teach you more about quantitative trading than most people learn in their entire career at Wall Street. Bookmark this & watch, no matter what. It’s the most productive start you can give your week. Then read article below.
Roan@RohOnChain

x.com/i/article/2037…

English
36
964
4.6K
796.4K
JC Peralta retweetledi
BA (ᜊ)
BA (ᜊ)@bumaBAgyo·
HINDI sa tanghaling tapat mararanasan ang pinakamainit na panahon. Kadalasan, MAS MAINIT pa tuwing HAPON. Ito ay dahil sinasabayan ng PAG-SINGAW ng init ng lupa ang init na galing sa sinag ng araw.
BA (ᜊ) tweet media
Filipino
2
91
292
7.6K
JC Peralta retweetledi
Mathematica
Mathematica@mathemetica·
Diffusion (stochastic SDE sampler): erratic Brownian trajectories zigzagging through noise. Flow Matching (deterministic ODE integrator): clean, straight-line paths to the data modes. Same start, radically different dynamics.
English
14
287
2.7K
329K
JC Peralta retweetledi
Yohan
Yohan@yohaniddawela·
City intersections generate 29 times more pollution than open roads. Half of those toxic emissions come from cars doing absolutely nothing but stopping and accelerating at traffic lights. In 2020, a Google software engineer was brainstorming massive climate mitigation ideas at his family dinner table. His wife told him they should just fix the annoyance of waiting at red lights for no reason. He assumed the problem was unsolvable. Then he looked at the mechanics of urban traffic engineering. Cities traditionally try to optimise traffic lights by installing incredibly expensive hardware sensors or paying people to manually count vehicles. The infrastructure is usually outdated. The data is almost always incomplete. The Google Research team realised they possessed a massive structural advantage. They had over a decade of Google Maps driving trends from billions of journeys across the globe. They built an AI model called Project Green Light. The system measures exactly how traffic flows through an intersection. It tracks the precise patterns of starting, stopping, and average wait times. Then it calculates exactly how to coordinate adjacent intersections to create continuous waves of green lights. City traffic engineers receive a simple dashboard with actionable recommendations. They review the AI's suggestions and implement the timing changes in about five minutes. They don't need to buy new software. They don't need to dig up roads to install new hardware integrations. They just adjust the dial on the infrastructure they already own. The scale of the impact is massive. The model is currently live in 12 cities, from Manchester to Bangalore to Seattle. It analyses thousands of intersections simultaneously. Early data shows a 30% reduction in vehicle stops and a 10% drop in total emissions at those junctions. That single AI model is already saving fuel and lowering emissions for 30 million car rides every single month. A casual complaint about a frustrating daily commute revealed a massive blind spot in urban design. Fixing the climate crisis involves deploying solar panels and scaling electric vehicles. It also involves using artificial intelligence to shave three seconds off a red light so millions of engines don't have to idle.
English
5
29
184
11.3K
JC Peralta retweetledi
Rohan Paul
Rohan Paul@rohanpaul_ai·
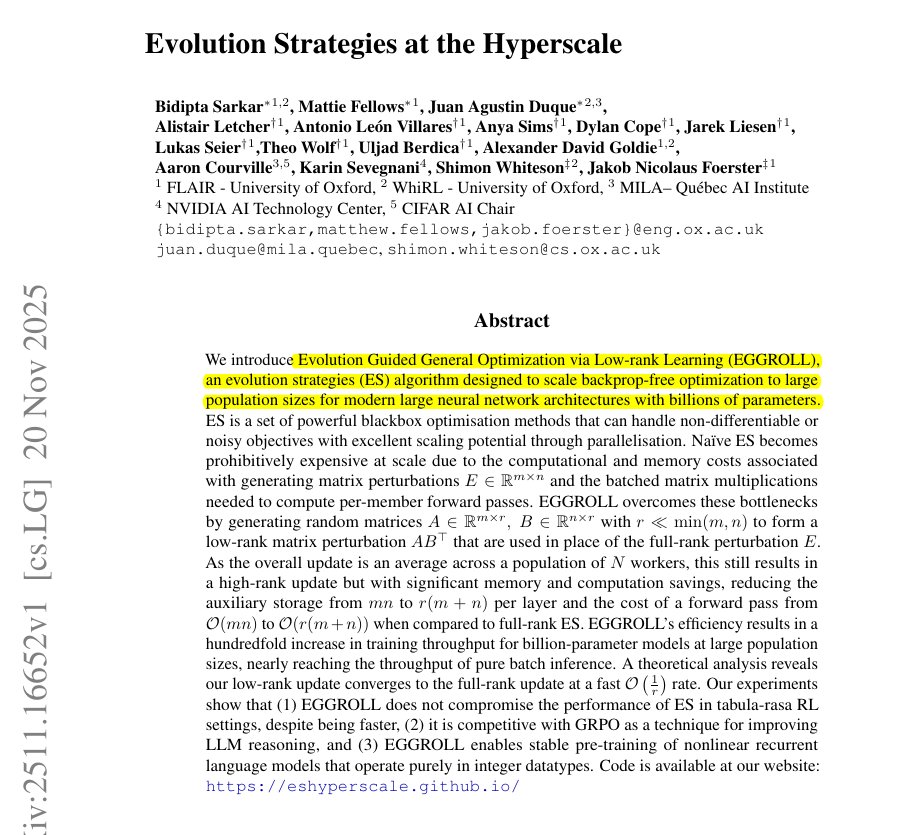
🧠 NVIDIA and Oxford show that evolution strategies can train billion parameter models at almost inference speed using a new low rank system called EGGROLL. This work basically says the old bottleneck in evolution strategies was engineering overhead on perturbations, not the core algorithm. Standard evolution strategies need a separate full size noise vector for every model copy in the population, which blows up memory traffic and compute once models reach billions of parameters. EGGROLL instead samples 2 skinny matrices A and B, uses their product A times transpose of B as a compact perturbation generator, and shows that averaging over the population still behaves like a full rank evolution strategies update. They prove that as the rank r of this factorization grows, the estimated gradient approaches the true evolution strategies gradient at rate 1/r, so dialing up rank smoothly recovers classic evolution strategies without the huge cost. In experiments they pretrain recurrent language models using only integer datatypes, with no gradients and no backpropagation, run evolution strategies with hundreds of thousands of population members at throughput close to batched inference, and reach GRPO level reasoning scores on language benchmarks. This makes evolution strategies a serious tool again for large, discrete, or non differentiable systems, and it is a strong signal that some parts of the field have been overfitting to backprop by habit rather than necessity. Evolution strategies just went from a historical footnote to a practical way to train billion parameter models without gradients. Training billion parameter models with a gradient free method at near inference speed is no longer science fiction, it is running today. The key move in EGGROLL is turning expensive full rank noise into a cheap low rank factorization that still behaves like classic evolution strategies when rank is high enough. If backpropagation is blocked by discrete actions, messy simulators, or weird hardware, EGGROLL style evolution strategies looks like a real alternative rather than a toy method. This work suggests a lot of current training difficulty comes from how gradients are computed and moved around, not from any hard law that gradients are always required. ---- Paper – arxiv. org/abs/2511.16652 Paper Title: "Evolution Strategies at the Hyperscale"
Rohan Paul tweet media
English
8
37
163
9.7K
JC Peralta retweetledi
Movez
Movez@0xMovez·
This 1 hour lecture on "Probability Theory" from MIT will teach you more about prediction markets than 2 month internship at at a Wall Street Quant firm. Bookmark this & give it 1 hour today, no matter what. It’s the most productive start you can give your week. Then read post below.
Movez@0xMovez

The best Polymarket Quant bot for copy-trading with a 99.3% win rate. backtested strategy on 72M Polymarket/Kalshi trades to hit +$805K PnL on 27,000 predictions. bot doesn't gamble - it uses math and statistics in its algo to consistently hit 99% win rate. his algo decoded: 1. Mispricing formula based on 72M trades data, traders constantly overpay for cheap contracts (0.1¢–50¢) most of the edge sits in (80¢-99¢) contracts - that's the range where the bot mostly trades • formula: δ = actual win rate - implied probability bot applies this to every trade to find the edge. // 2. Expected value calculation EV tells you whether a bet is worth taking, regardless of the outcome of any single trade. • formula: EV = (P win × Payout) - (P lose × Cost) bot calculates it to understand if the trade is worth the risk. // 3. Kelly Criterion sizing most powerful position sizing formula ever discovered for gambling, trading and prediction markets it tells the algo what % of your portfolio to size into each bet to win long term. • formula: f* = (p * b - q) / b mispricing found → EV calced → kelly sizing → enter profile: polymarket.com/0x751a2b86cab5… start copy trading the bot with as little as $10 using Ares: ares.pro/wallets/0x751a… 2 more formulas behind its algo revealed in the article below ↓

English
96
2.5K
12.6K
1.8M
JC Peralta retweetledi
Ben Noll
Ben Noll@BenNollWeather·
Strongest El Niño on record this year?! New ECMWF guidance shows a *75% chance of a super El Niño* by October, with some scenarios suggesting the most intense event in more than a century. It will bring wide-reaching weather impacts that last into 2027 🧵
GIF
English
84
877
2.3K
532.2K
JC Peralta retweetledi
Jesús Fernández-Villaverde
Jesús Fernández-Villaverde@JesusFerna7026·
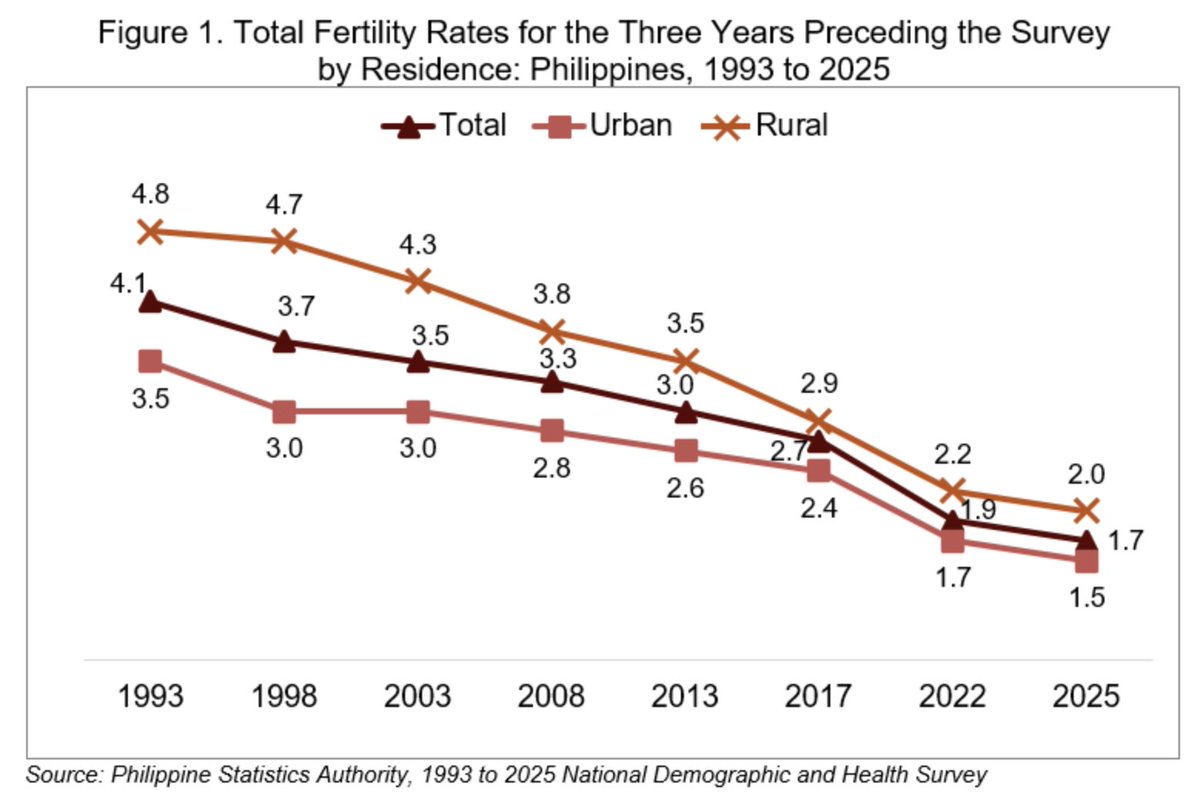
The Philippines is a fantastic example of how deep and fast the drop in fertility is nearly everywhere on the planet. Just last week, on March 30, 2026, the Philippine Statistics Authority released the 2025 National Demographic and Health Survey (NDHS). The total fertility rate for the last three years has reached 1.7 children per woman, a dramatic fall from 4.1 in 1993, and well below the replacement rate (around 2.1 for a country like the Philippines). Since the NDHS computes the total fertility rate over three years, and it is dropping quickly, the total fertility rate for 2025 alone should be around 1.6, the same level as in the U.S. Let me repeat this: the Philippines and the U.S. have roughly the same total fertility rate. But U.S. income per capita is about 7.3 times the Philippine income per capita (when adjusted for purchasing power parity). Or to put it differently, Philippine income per capita today is the same as the U.S. had in 1910. In that year, the total fertility rate of the U.S. was around 3.5. At the same level of income per capita, the Philippines has a total fertility rate that is less than half. In some more urban regions, such as Calabarzon, the total fertility rate is 1.3. Historically, the rest of the country has followed the patterns of regions like Calabarzon with some lag, so the most likely scenario is that in a few years, the Philippines will have a total fertility rate of around 1.3 as well. Compared with the United Nations World Population Prospects (WPP), the Philippines is now at the fertility level the WPP had forecast for 2047, despite the aggressive reduction it made to the Philippines’ forecast fertility between 2022 and 2024. The Philippines is interesting because, compared with other Asian countries, it is a relatively religious and rural country without the Confucian obsession with education found in China or South Korea. It is also a country that many still associate with high fertility. Just yesterday, one reader left a comment on my previous post on fertility, using the Philippines as an example of high fertility, that “refuted” my claims. No, it does not. Finally, three technical points. First, I am reporting total fertility, not completed fertility (and yes, I am keenly aware of the difference between the two). Looking at age-specific fertility rates suggests that completed fertility for younger women will actually be below the current total fertility rate. Second, no, emigration does not matter here. I am talking about fertility rates, not birth rates. Third, the official release: psa.gov.ph/content/fertil…
Jesús Fernández-Villaverde tweet media
English
88
347
1.9K
854.1K
JC Peralta retweetledi
AukeHoekstra
AukeHoekstra@AukeHoekstra·
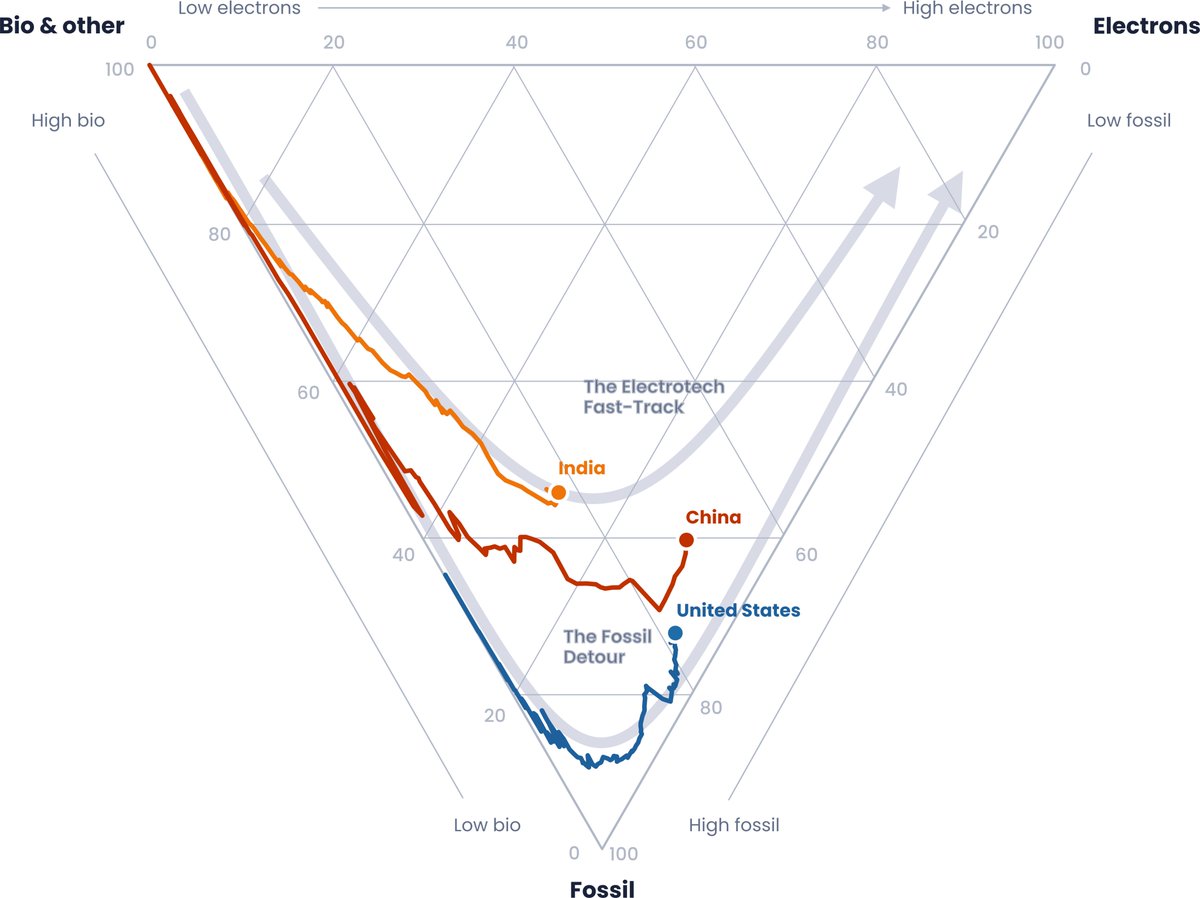
I *love* this ternary chart showing developing economies increasingly go directly for clean electrons (solar plus some wind), bypassing the fossil economy that the US and EU went through. I expect Africa will take an even more direct route than India. ember-energy.org/latest-insight…
AukeHoekstra tweet media
English
55
312
2K
91.3K
JC Peralta retweetledi
Mitchell B Slapik
Mitchell B Slapik@mslapik·
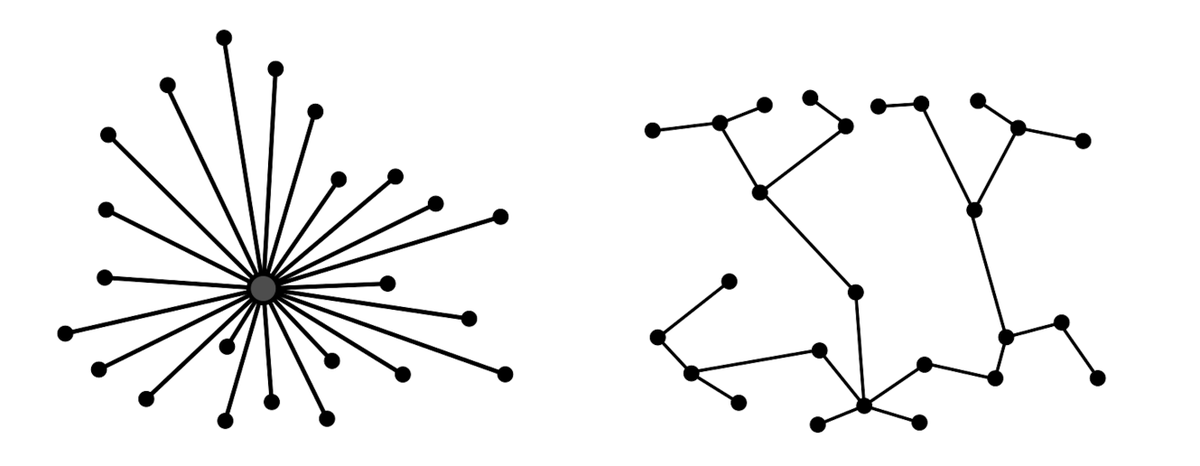
As random connections are added to a network, a giant connected component suddenly appears. This phase transition shapes connectivity in many complex systems from brain networks to ecosystems to power grids.
GIF
English
15
69
516
27.3K
JC Peralta retweetledi
Yohan
Yohan@yohaniddawela·
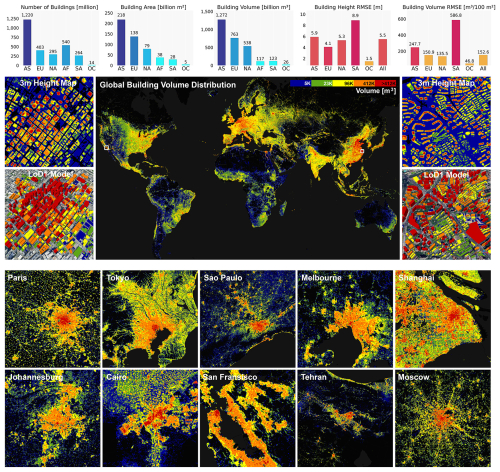
The UN estimates there are roughly 4 billion buildings on Earth. Researchers have just released the first open dataset providing 3D models for 2.75 billion of them at 3m resolution:
Yohan tweet media
English
9
121
879
29.5K
JC Peralta retweetledi
Massimo
Massimo@Rainmaker1973·
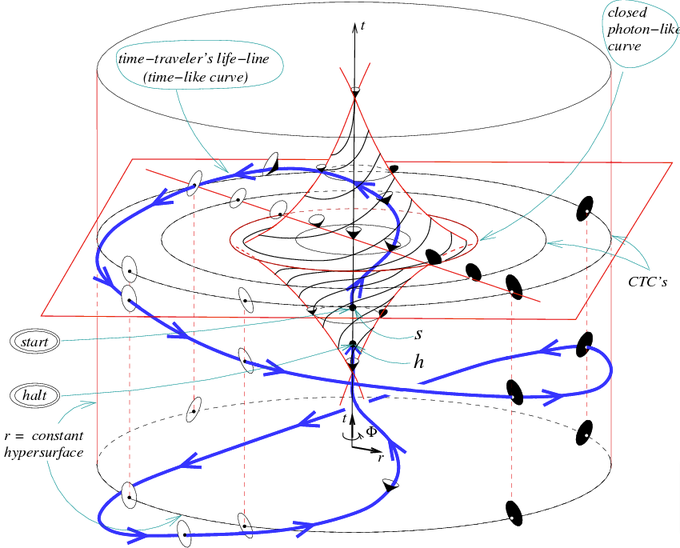
Kurt Gödel, who was one of Albert Einstein's best friends in his later years, found a solution to general theory of relativity that modelled a strange, unusual and rotating universe allowing for backward time travel.
Massimo tweet media
English
76
372
2.3K
107.5K
JC Peralta retweetledi
Brandon Luu, MD
Brandon Luu, MD@BrandonLuuMD·
Most people aren’t ghosting you because they don’t like you. They’re overwhelmed. Information overload and task pressure drive anxiety and avoidance. But messages that feel useful cut through and get faster replies.
Brandon Luu, MD tweet media
English
47
1.2K
6.9K
228.2K
JC Peralta retweetledi
H - Punk
H - Punk@H__punk·
If you are a data scientist, I highly recommend this papers of Hayek: 1.-Economics and Knowledge 2.-The Use of Knowledge in Society 3.-Degrees of Explanation
H - Punk tweet media
English
14
213
1.8K
64.7K