Sabitlenmiş Tweet
IDK
367 posts


IDK
@juice_trader
Crypto trader since 2015 |
Miami, FL Katılım Haziran 2019
699 Takip Edilen115 Takipçiler

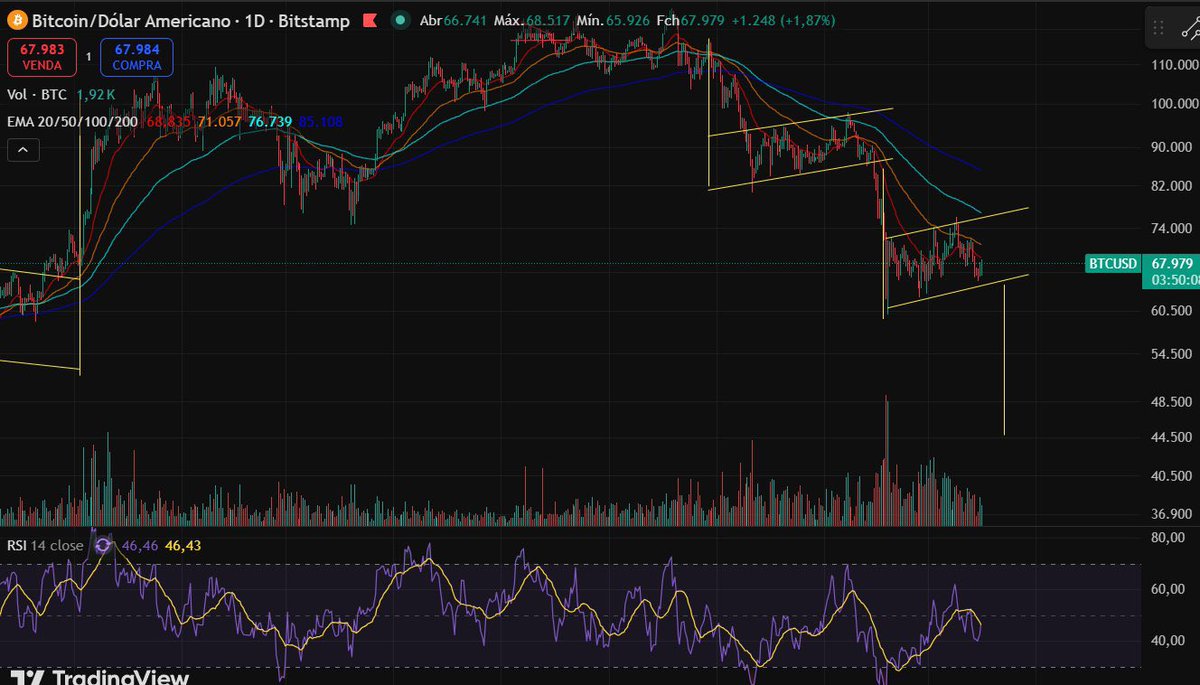
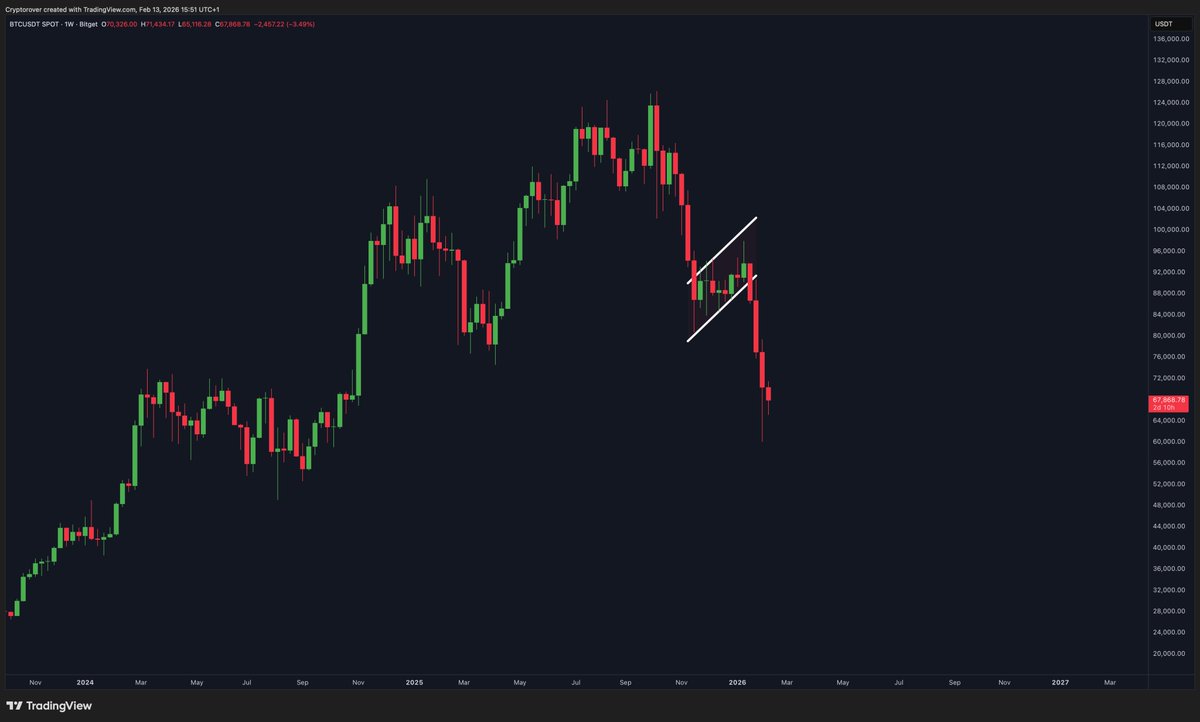
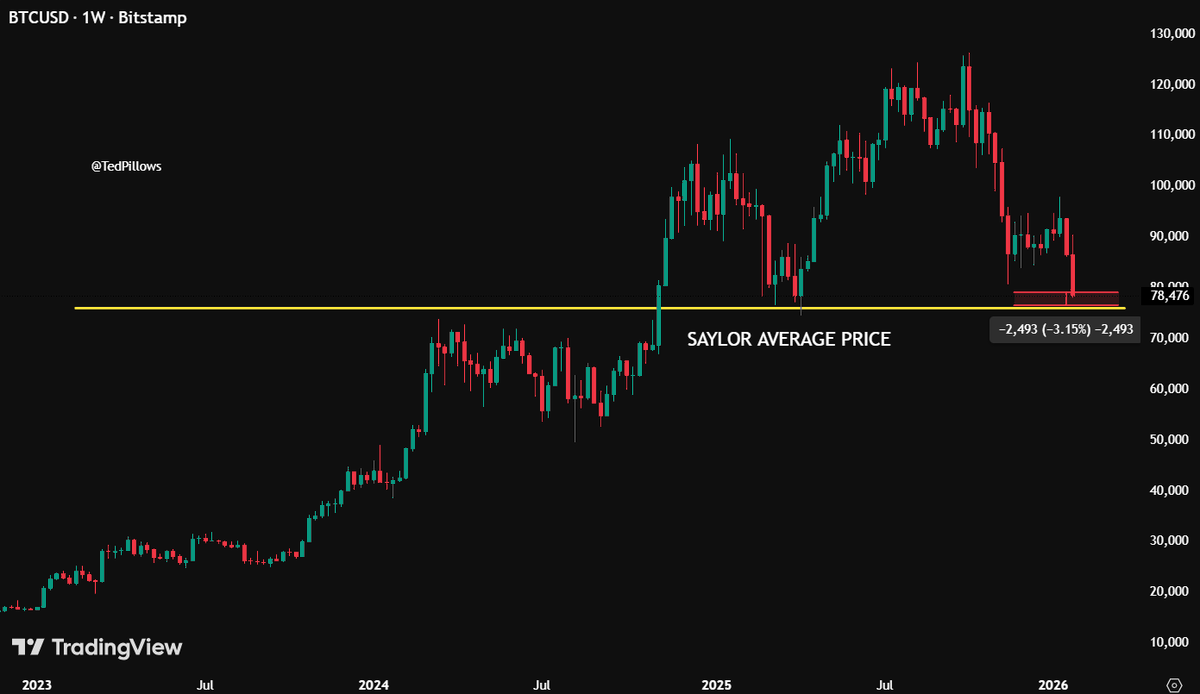
Bitcoin lost the 81k region on the weekly chart and broke through several key moving averages.
With this structure, price may now look for the next Fibonacci support zones: 0.5 (70k) and 0.618 (57k).
Meanwhile, I’m watching closely for a possible RSI divergence ,mainly on the daily, and if it shows up on the weekly, even better.
$btc $bitcoin #btc #bitcoin

English


IDK retweetledi
This is what you need to know:
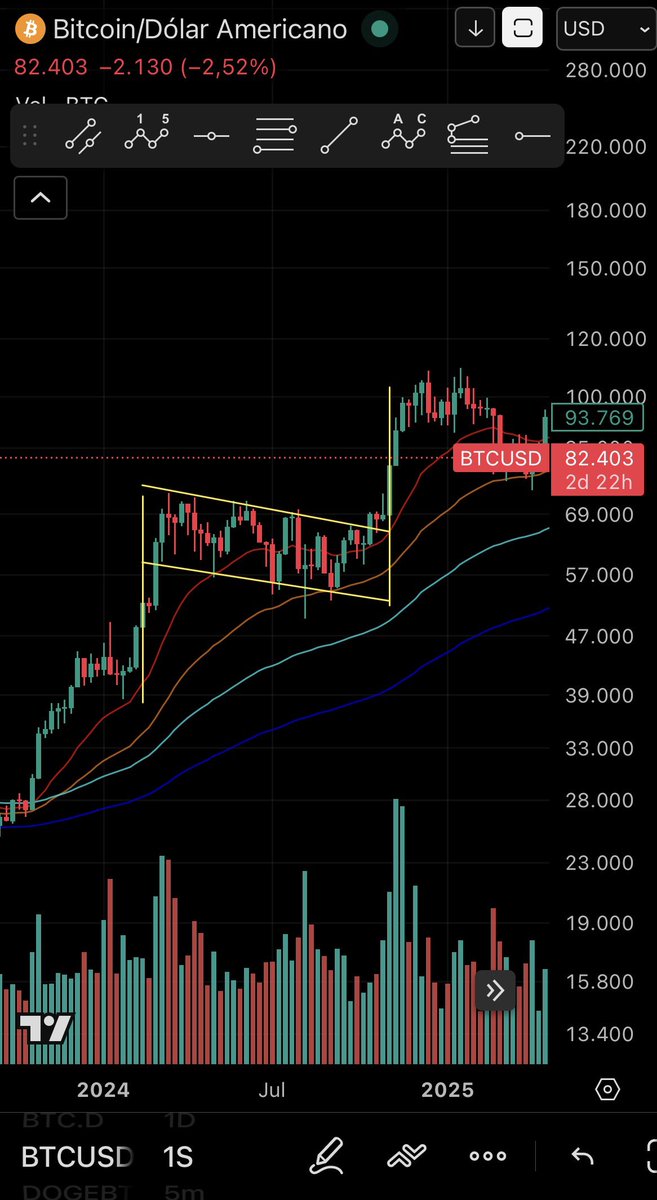
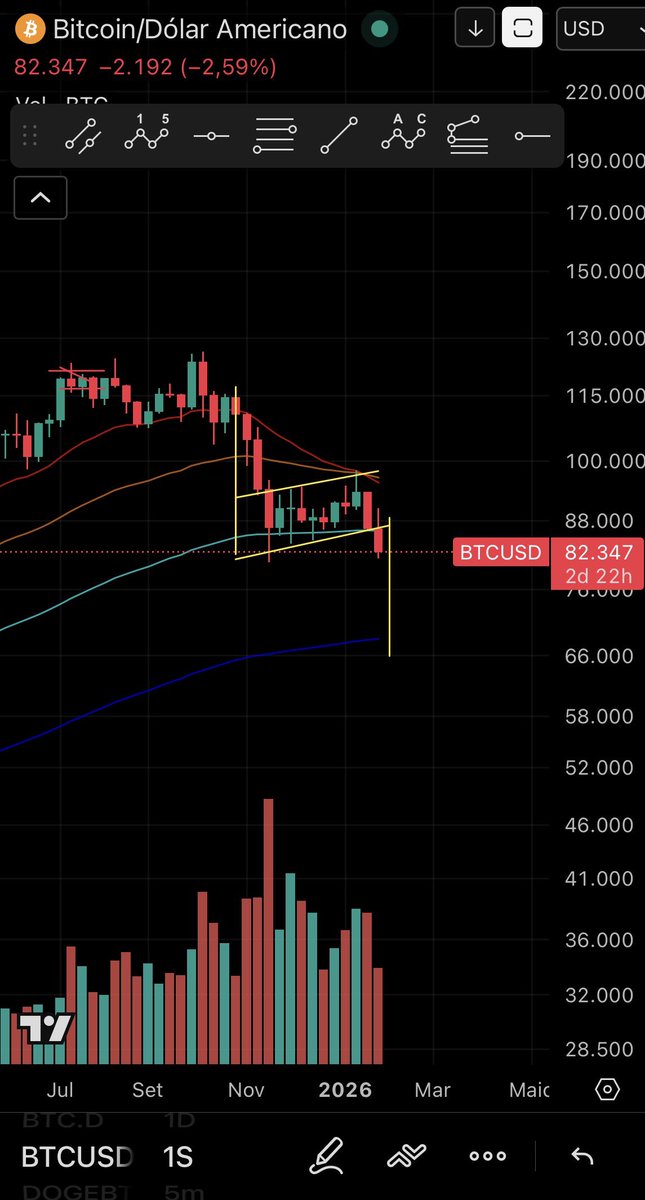
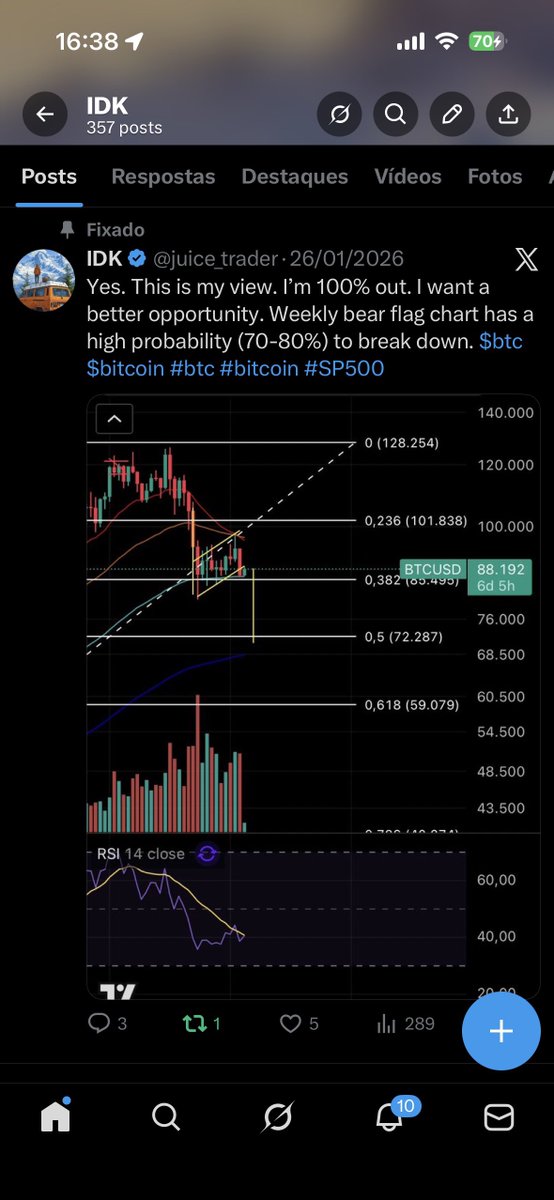
On the BTC weekly chart, both the bull flag and the bear flag follow the same logic: a strong pole followed by a consolidation. That pole matters because it’s used as the projection for the next move. In a bull flag, a breakout often repeats the leg up. In a bear flag, the breakdown usually mirrors the leg down. That’s why these structures on the weekly are so important , they show the direction and even hint at how far the price can go.
#btc #bitcoin
English
IDK retweetledi

IDK retweetledi
IDK retweetledi


IDK retweetledi
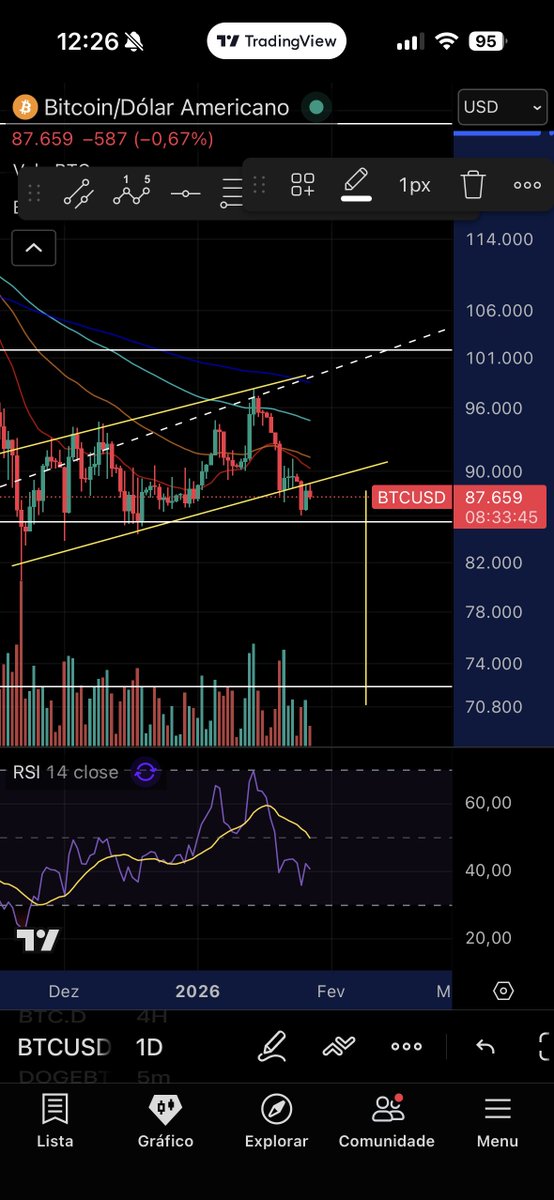
The Bitcoin bear market is just getting started according to the 4-year cycle timing.

English

Be patient. Bitcoin is in no rush. Don’t try to catch a falling knife or you’ll get hurt. Take your time: wait, breathe, analyze, stay calm, and pay attention to the signals. And above all, be careful with leverage. Stay calm and go do something else for a while. Clear your head with a hobby instead of stressing yourself out.
#btc #bitcoin $btc $bitcoin
English