kiin retweetledi

The 50-Year Arrangement
In 1974, Henry Kissinger made a secret deal that shaped every financial market on earth for the next 50 years It's called the Petrodollar System.
1-To understand the petrodollar, you first have to understand what existed before it. After World War II, the world needed a new monetary order. Europe was in ruins. The U.S. held 2/3 of the world's gold.
In 1944, 44 nations met at Bretton Woods, New Hampshire and agreed on a simple architecture: -
— Every currency would be pegged to the U.S. dollar
— The U.S. dollar would be pegged to gold at $35/oz
— Any country could exchange dollars for gold at that fixed rate
The system worked because the U.S. had the gold, the military, and the industrial dominance to back it. The dollar became the world's reserve currency not by decree, but because it was literally backed by something real.
2-But there was a fatal flaw built into the system from day one. Economist Robert Triffin identified it in 1960. It became known as the Triffin Dilemma the problem for the dollar to function as the world's reserve currency, the U.S. had to supply enough dollars globally to lubricate world trade. But to supply that many dollars, the U.S. had to run persistent trade deficits spending more than it earned, sending dollars abroad. The more dollars it sent abroad, the more its gold reserves were at risk of being drained if foreign nations decided to convert. In other words, being the world's banker required America to slowly bankrupt itself relative to its gold backing. It was only a matter of time.
3-The Vietnam War accelerated the collapse.
Throughout the 1960s, the U.S. spent massively financing both the Great Society social programs at home and the Vietnam War abroad simultaneously.
President Johnson called it the "guns and butter" policy.
The result: the U.S. printed far more dollars than it had gold to back.
by the late 1960s, foreign central banks particularly France under De Gaulle started noticing. France began aggressively converting its dollar reserves into gold, physically shipping gold bars from New York to Paris.
De Gaulle even held a press conference in 1965 calling for a return to the gold standard and describing dollar dominance as an "exorbitant privilege" that America exploited unfairly.
4-On August 15, 1971, President Nixon went on television and made an announcement that changed the world he closed the gold window.
Effective immediately, the U.S. would no longer exchange dollars for gold at any price. The Bretton Woods system 27 years old was dead. Nixon called it a "temporary" measure. It was never reversed.
In a single Sunday evening broadcast the dollar became a pure fiat currency backed by nothing but the -credibility and military power of the United States government.
The world had a dollar problem. Every country's reserve and trade were denominated in a currency that was now backed by nothing. Washington needed a new reason for the world to keep using dollars.
5- The deal
In 1974, Secretary of State Henry Kissinger negotiated a secret agreement with Saudi Arabia. The details weren't publicly confirmed until Bloomberg reported them in 2016.The terms were straightforward
Saudi Arabia agreed to - Price all oil sales exclusively in U.S. dollars Invest surplus oil revenues (petrodollars) back into U.S. Treasury bonds Support U.S. interests within OPEC.
The United States agreed to- Provide military protection to the Saudi royal family Supply Saudi Arabia with weapons Guarantee Saudi security against regional threats. One deal. Two signatures. And the dollar problem was solved.
6-The mechanics of what Kissinger created were elegant and self-reinforcing here's how the loop worked
Step 1- Saudi Arabia (and eventually all OPEC members) sell oil only in dollars
Step 2- Every country on earth that imports oil Japan, Germany, India, Brazil, everyone must first acquire U.S. dollars to buy that oil.
Step 3-Oil exporters accumulate massive dollar surpluses they can't spend domestically.
Step 4: Those surplus dollars get "recycled" invested back into U.S. Treasury bonds, U.S. equities, and U.S. real estate.
Step 5- This creates a permanent, structural global demand for both dollars AND U.S. government debt.
Step 6-The U.S. can borrow cheaply forever, run trade deficits indefinitely, and project military power globally all financed by the world's need for its currency.
De Gaulle's "exorbitant privilege" didn't die with Bretton Woods. It was reborn bigger, and this time without even needing gold.
7-To grasp the scale of this privilege, consider a simple comparison.
When Germany wants to buy oil, it must first earn dollars by exporting goods, attracting investment, or borrowing. When the United States wants to buy oil, it prints dollars. That asymmetry is the petrodollar system in one sentence. It meant the U.S. could maintain a permanent current account deficit without the currency crisis that would destroy any other nation. It meant the U.S. could finance wars, deficits, and entitlements by issuing debt that the world was structurally obligated to absorb. It meant interest rates on U.S. Treasuries were suppressed below what they would otherwise be -making everything from mortgages to corporate borrowing cheaper for Americans. Every American has benefited from this system for 50 years without knowing it existed.
8-OPEC became the system's enforcement arm -whether it knew it or not.
By controlling global oil supply, OPEC ensured that oil remained priced in dollars. Any country that tried to buy oil in another currency faced the same problem their counterparties demanded dollars anyway.
The network effect was total. By the 1980s, the petrodollar system wasn't just a bilateral U.S.-Saudi agreement. It was the operating system of global finance. Dollar-denominated oil pricing meant:
— Dollar-denominated commodity markets (copper, wheat, iron ore priced in USD)
— Dollar-denominated shipping contracts
— Dollar-denominated trade finance
— Dollar-denominated debt across emerging markets
One deal in 1974 created a web that entangled every economy on earth.
9-And when countries tried to break the web they paid a catastrophic price.
Iraq, 2000: Saddam Hussein announced he would price Iraqi oil in euros. He called the dollar "the currency of the enemy." In November 2000 he switched Iraq's oil-for-food reserves to euros. In March 2003 the U.S. invaded Iraq. Within weeks of the invasion, Iraqi oil sales were switched back to dollars.
Libya, 2009: Muammar Gaddafi proposed a pan-African gold dinar a single African currency backed by gold that would replace the dollar for oil sales across the continent. He was actively lobbying African and Arab nations to join.
In 2011, a NATO coalition led by the U.S., UK, and France intervened militarily. Gaddafi was killed. The gold dinar proposal died with him.
Hillary Clinton's leaked emails from 2011 specifically mentioned concern about Libya's gold reserves and its threat to French financial interests in Africa.
Correlation is not causation, but the pattern is hard to ignore.
10-The system also shaped every major geopolitical conflict of the last 50 years in ways most analysts never connect to the dollar.
The U.S. Fifth Fleet is permanently stationed in Bahrain -in the Persian Gulf, guarding the Strait of Hormuz.
Not because America needs Gulf oil for itself. The U.S. has been energy independent since 2019.
The fleet is there because the global dollar system requires that oil flows smoothly, priced in dollars, through that chokepoint.
The moment the Gulf stops pricing oil in dollars, the structural demand that props up U.S. Treasuries begins to erode. America's military presence in the Middle East is, at its core, a defence of the monetary system not just a security alliance. That's how deeply the petrodollar runs through everything.
11-By the 1990s and early 2000s, the system was at its peak.
The Cold War was over. The U.S. was the sole superpower. Dollar dominance looked permanent.
In 2001, the U.S. dollar represented approximately 72% of global foreign exchange reserves.
U.S. Treasuries were considered the ultimate risk-free asset. The 10-year yield was the global benchmark for pricing everything from mortgages to emerging market debt. The petrodollar recycling mechanism was working perfectly.
Gulf states earned billions in oil revenues → recycled into Treasuries → suppressed U.S. borrowing costs → allowed the U.S. to run massive deficits → which funded the military that protected the Gulf states.
A perfect circle. Self-sustaining. Apparently eternal.
And then three events — spaced over 15 years — began to crack the foundation.
12- Crack 1- The 2008 Financial Crisis
When Lehman Brothers collapsed in September 2008, the world discovered something disturbing.
The "risk-free" assets at the heart of the dollar system — U.S. mortgage-backed securities, AAA-rated bonds — were not risk-free. They were fraudulent.
The dollar itself surged during the crisis (flight to safety), but confidence in U.S. financial institutions and regulatory credibility was shattered.
More importantly: the Federal Reserve responded by creating $3.5 trillion in new money between 2008 and 2014 through quantitative easing.
Three rounds of money printing. Interest rates at zero for seven years. Foreign central banks and sovereign wealth funds watched and took note: the U.S. would not let financial discipline constrain its monetary policy. The dollar's value was a political variable, not an anchor.
The first serious conversations about alternatives began in 2009 - when China publicly called for a new global reserve currency to replace the dollar at a G20 meeting.
13-Crack 2- The 2022 Russian Reserve Freeze
This was the moment everything changed. After Russia invaded Ukraine in February 2022, the U.S. and Europe took an unprecedented step they froze approximately $300 billion in Russian central bank reserves held in Western financial institutions.
Dollars. Euros. Held in Western banks. Gone. Inaccessible overnight.
Russia had followed the textbook hold reserves in liquid, safe, yield-bearing assets. Diversified across currencies. Managed responsibly. It didn't matter.
The message received by every central bank on earth was unambiguous.
Dollar reserves are not neutral stores of value. They are political instruments.
If Washington disagrees with your government's actions, your reserves can be frozen. Confiscated. Weaponized against you. For the first time, holding dollars felt like a geopolitical risk rather than a safe haven.
14-What happened after 2022 was a quiet but historic reallocation.
Central bank gold purchases hit the highest levels in over 50 years in 2022 and 2023.
The buyers: China, India, Turkey, Poland, Singapore, Saudi Arabia nations either non-aligned with Washington or actively hedging against U.S. financial coercion. The logic was simple. Gold cannot be frozen. Gold has no counterparty. Gold doesn't require SWIFT access or a correspondent bank. Gold doesn't care about sanctions. By 2026, central banks globally hold more gold than U.S. Treasuries on an adjusted basis.
That sentence would have been inconceivable in 2005.
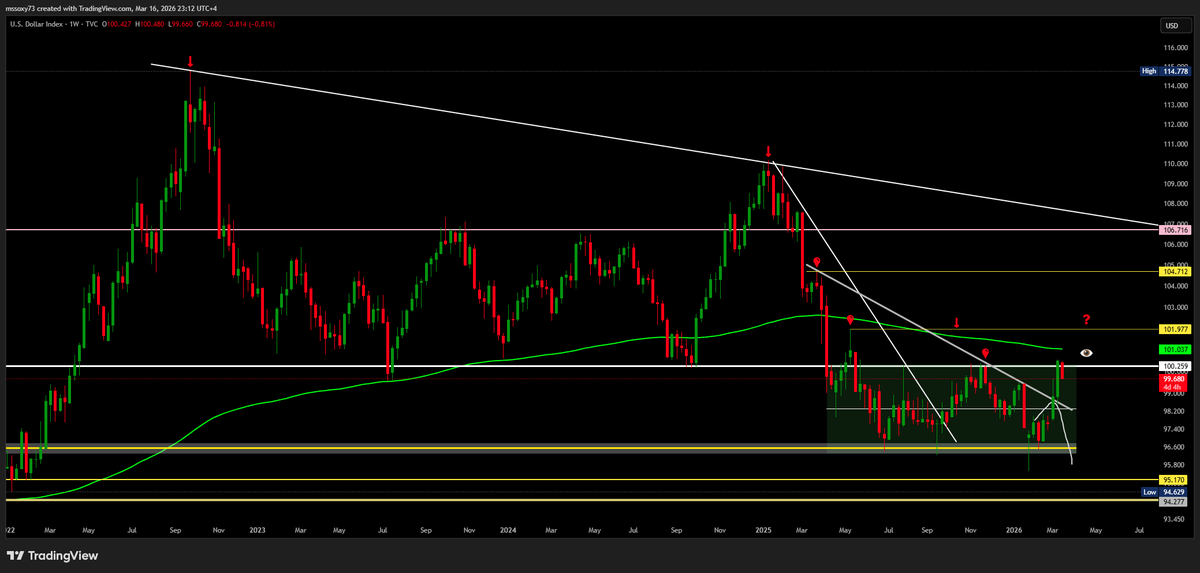
Meanwhile the dollar's share of global FX reserves continued its long decline.
2001: ~72%
2016: ~65%
2022: ~58%
2026: ~50%
Each percentage point represents hundreds of billions in reduced structural demand for U.S. debt. Each percentage point is a quiet tax on American living standards paid in the form of slightly higher borrowing costs, slightly weaker purchasing power, slightly less privilege.
15-Crack 3-The 50-Year Deal Expires
On June 10, 2024 with almost no media coverage the original 1974 Saudi-U.S. petrodollar agreement expired.
Fifty years Done. Saudi Arabia did not renew it.
In the months preceding expiration, Saudi officials had already stated publicly they were "open to trading in other currencies." The kingdom had begun accepting yuan for Chinese oil purchases. It had joined the MBridge project a cross-border digital currency settlement system developed by China, UAE, Hong Kong, and Thailand explicitly designed to bypass the dollar.
The formal agreement that Kissinger built the modern financial world on had quietly lapsed.
What replaced it? Nothing formal. Just a shifting web of bilateral arrangements, yuan deals, and the slowly growing understanding that the petrodollar was now held together by inertia and network effects not a contract.
16-Now the historical comparison that puts all of this in perspective.
The British pound was once what the dollar is today.
In 1900, sterling was the world's dominant reserve currency. The British Empire controlled global trade, finance, and shipping. Pound-denominated bonds were the world's risk-free asset. London was the centre of global capital. Then came World War I. Britain borrowed massively primarily from the United States. The war destroyed British wealth and transferred it to American creditors. Then World War II More borrowing More transfer. By 1944, Bretton Woods made the dollar the official global reserve currency. But here's what most textbooks miss: the pound didn't collapse overnight. It remained widely used in international trade throughout the 1950s. The real death came in 1956 — the Suez Crisis.
Britain and France invaded Egypt to reclaim the Suez Canal. The U.S., fearing Soviet escalation, threatened to dump British pound reserves and crash sterling.
Britain withdrew within days. Not because it lost militarily. Because the U.S. had financial leverage over it.
That humiliation marked the definitive end of sterling's global role. Not a crash. Not hyperinflation. A geopolitical moment that revealed the underlying shift in power had already happened.
The transition from pound to dollar took roughly 30-40 years slow, grinding, partially invisible until it wasn't.
17-The dollar transition, if it follows the same path, will not be a single catastrophic moment.
— Slow erosion of dollar's share in global reserves (already happening)
— Bilateral trade deals settled in yuan, rupees, rubles (already happening)
— Commodity contracts oil, iron ore, agriculture — repriced outside the dollar (already happening)
— Central banks diversifying into gold, SDRs, and alternative currencies (already happening)
— Rising U.S. Treasury yields as structural demand erodes (already happening)
No single replacement currency is ready. The yuan is not fully convertible. The euro lacks the political coherence. Gold is not a modern payment system.
What comes next is not a dollar collapse. It's a dollar demotion from unchallenged monopoly to dominant but contested reserve currency. Like sterling from 1918 to 1944. Still used. Still respected. But no longer the only game in town.
18-What does this mean for gold?
In the Bretton Woods era: gold was the anchor.
In the petrodollar era: gold was suppressed dollar demand replaced it.
In the post-petrodollar era: gold is being re-monetized.
Central banks are not buying gold because they expect to return to a gold standard.
They're buying gold because in a world where the dominant reserve currency can be weaponized, gold is the only major reserve asset with no sovereign counterparty.
Historically, every time reserve currency dominance has shifted, gold has significantly outperformed. During the decline of the pound (1930s-1950s), gold rose substantially in both sterling and dollar terms.
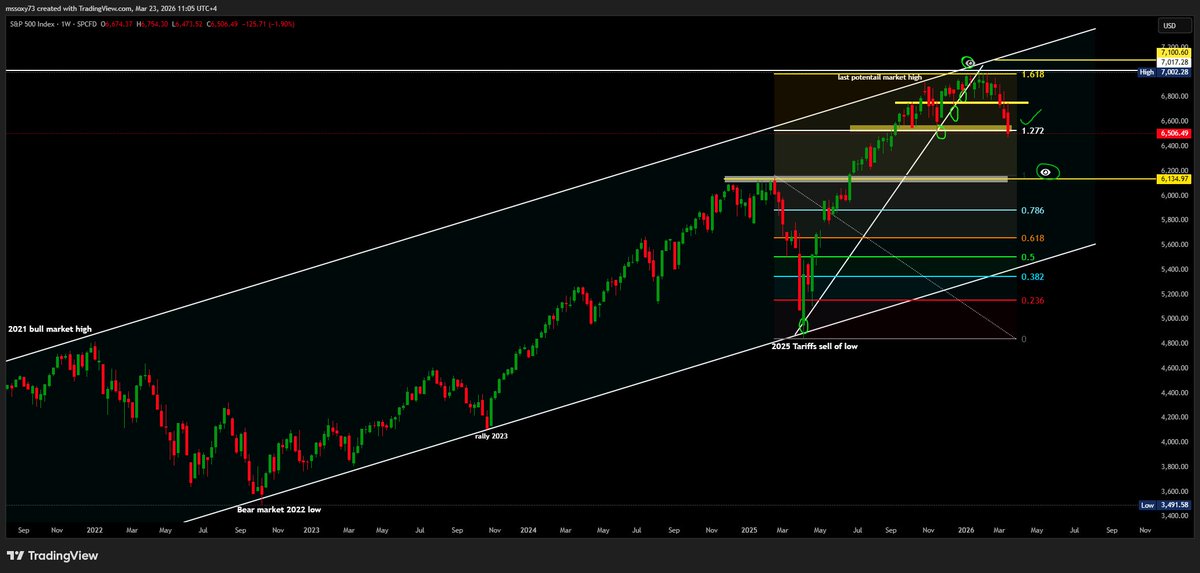
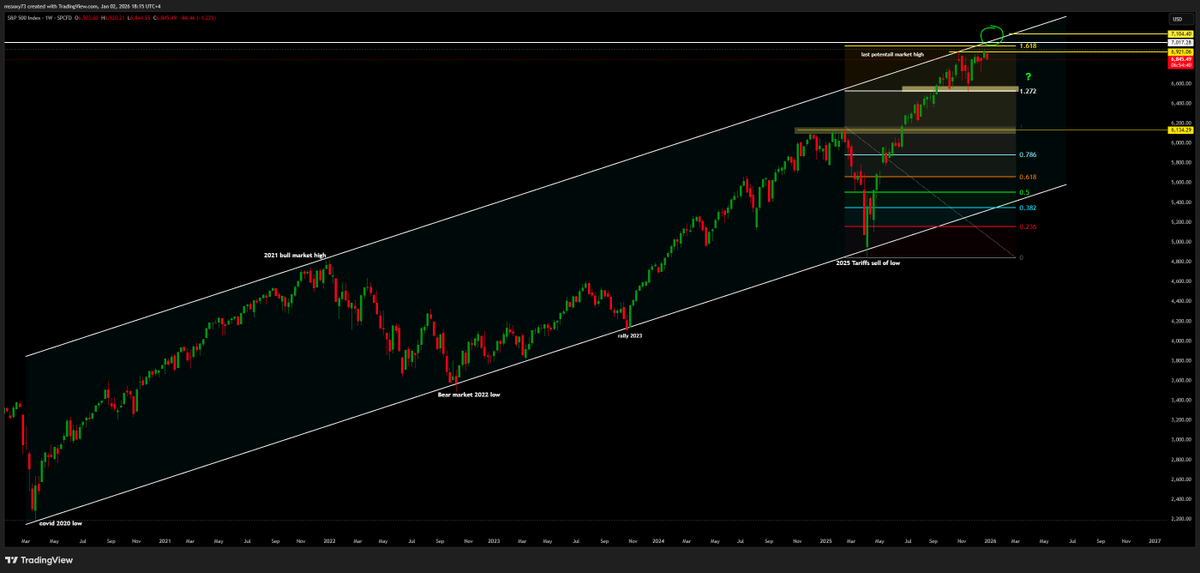
The FFTT metric an adjusted Buffett Indicator accounting for federal debt currently sits at the same extreme levels seen at the 2000 and 2021 peaks. Both prior peaks were followed by 25-47% equity declines. In both cases, gold significantly outperformed equities through the drawdown.
If the petrodollar truly is in structural decline, gold isn't just a hedge. It's the asset most directly positioned to benefit from the transition.
19-What does this mean for bonds and interest rates?
This is where the real systemic risk sits.
The petrodollar system suppressed U.S. interest rates for decades by creating captive buyers of Treasuries — Gulf sovereign wealth funds, Asian central banks, OPEC recyclers who had no choice but to hold dollars and needed somewhere to park them.
As that structural demand erodes, the natural clearing rate for U.S. Treasuries rises. Higher yields mean-
— More expensive government borrowing on $34 trillion in existing debt
— Higher mortgage rates, auto loan rates, corporate borrowing costs
— Greater proportion of tax revenue consumed by debt service alone
— Less fiscal space for the government to respond to the next crisis
Japan offers a preview. When the Bank of Japan lost control of its yield curve control policy in 2022-2024, it revealed how fragile a heavily indebted sovereign's bond market can be when structural buyers step back.
The U.S. is not Japan. But the direction of travel rising yields, rising debt service, declining foreign appetite for Treasuries rhymes closely.
20-What does this mean for inflation?
The petrodollar system exported American inflation.
When the U.S. printed money, the dollars flowed out to buy oil, goods, and services globally. Because the world structurally needed those dollars, much of the inflation was absorbed abroad rather than returning home as price pressure. In economic terms the dollar's reserve status gave the U.S. a massive inflation subsidy.
As that status erodes, the subsidy shrinks.
Dollars that previously stayed in foreign reserves or recycled into Treasuries begin returning to the U.S. economy. They bid for goods and services domestically. The inflation that was exported comes home.
This is one structural reason why many macro analysts believe the U.S. faces a persistently higher inflation baseline in the coming decade than in the previous three decades regardless of what the Federal Reserve does with interest rates.
The 1970s are the historical analog. After Nixon closed the gold window, the inflation buffer was lost. Prices rose. The Fed had to raise rates to 20% before it was broken.
The transition we're in now is slower and more complex. But the directional dynamic is similar less exorbitant privilege, more domestic inflation pressure.
21-What does this mean for the economy broadly?
The honest answer is the transition redistributes wealth globally on a massive scale.
Winners in a post-petrodollar world-Gold and hard asset holders — Commodity-rich nations (Middle East, Russia, Brazil, Africa) — China and yuan-aligned trade blocs — Countries holding physical gold reserves
Losers in a post-petrodollar world: — U.S. consumers, whose purchasing power rested partly on dollar privilege — Nations with dollar-denominated debt (particularly vulnerable emerging markets) — Fixed income investors holding long-duration U.S. Treasuries
For the U.S. specifically: the loss of reserve currency monopoly doesn't mean economic collapse. The U.S. remains the world's largest economy, its most innovative, and its most militarily dominant.
But it does mean the end of borrowing cheaply without consequences. The end of running deficits without discipline. The end of exporting inflation without limit.
Living within your means, as a nation, feels a lot like austerity when you've been living far beyond them for 50 years.
22-what makes this moment different from every prior scare about dollar decline.
Every decade since the 1970s has produced predictions that the dollar's dominance was ending. Every time, those predictions were wrong.
The dollar survived the 1970s stagflation. It survived the 1985 Plaza Accord. It survived the 1997 Asian crisis. It survived 2008. It survived QE1, QE2, QE3.
So why is this time different?
Because this time, the cracks are structural and simultaneous.
— The formal legal agreement underpinning petrodollar pricing has expired
— The 2022 reserve freeze demonstrated to every central bank that dollar assets carry
— China has built credible alternative settlement infrastructure (mBridge, CIPS, yuan swap lines in 40+ countries)
— Gold is being re-monetized by central banks at the fastest pace in 50 years
— The U.S. debt load is now so large that the Fed cannot raise rates aggressively without triggering a fiscal crisis
— Gulf states are openly diversifying away from the dollar for the first time in history
Any one of these alone would be manageable. Together, they represent a structural shift not a cyclical one
23-The bottom line.
The petrodollar system was one of the most ingenious financial constructs in history. A secret deal that gave a country the ability to print the world's money, run unlimited deficits, and project military power globally all while the rest of the world willingly financed it.
It worked for 50 years because it served everyone's interests well enough. Gulf states got security. The U.S. got cheap borrowing. The world got a stable reserve currency and liquid financial markets. China got access to dollar markets to fund its rise. But that compact is fraying because the interests have diverged.
— Gulf states now want currency optionality, not dollar dependency
— China wants to settle trade in its own currency, not its rival's
— Central banks want reserves that can't be frozen
— The world wants a monetary system that doesn't give one country unlimited advantage
What comes next won't be announced. It won't arrive in a single crisis. It will be a slow transition measured in decades, visible in data, felt in prices.
But we are, unambiguously, in the middle of it now.
24-The petrodollar era is not ending with a bang.
It's ending with a series of quiet decisions in Riyadh boardrooms, Beijing summits, central bank vaults, and commodity trading desks each one small, each one logical, each one incrementally reducing the world's dependency on the dollar. Individually, they look like routine transactions. Together, they are the rewriting of the global monetary order. The pound didn't fall in a day. Neither will the dollar. But the investors who understood what was happening in 1944 — and positioned accordingly — captured one of the greatest wealth transfers of the 20th century. We may be at that same kind of inflection point now. Pay attention.
That was a long one I won't lie😫🥱
But you made it to the end, and that says everything about the kind of person you are.
Curious. Patient. Probably dangerous at a dinner table now that you know how the global monetary system actually works. 😆😆👊
Genuinely thank you for reading. It means more than you know. 🙏
English