
kp singh
3.8K posts

You're game plan heading into the week couldn't be more important especially now. Have to keep an eye on $SPY & $SPX.
S&P 500 is oversold, below its 200-day SMA, and has now closed 5 consecutive weeks in the red. Simply because of the how high the selling pressure was last week, I'd expect a bit of a relief/dead cat bounce, watch for entries. #blackswan
Remember, the last time this happened, $SPX dropped another 14% by year-end.

English

I have made an impressive forecast on the downside, all target met, this my next forecast for $SPX officially 7400 to 8400 just like my pinned post haven’t deviated
$AAPL $370
$GOOG $440
$MSFT $620
$AMZN $310
$TSLA $655
$META $1137
Let’s see how this age
Chaos=profit

English
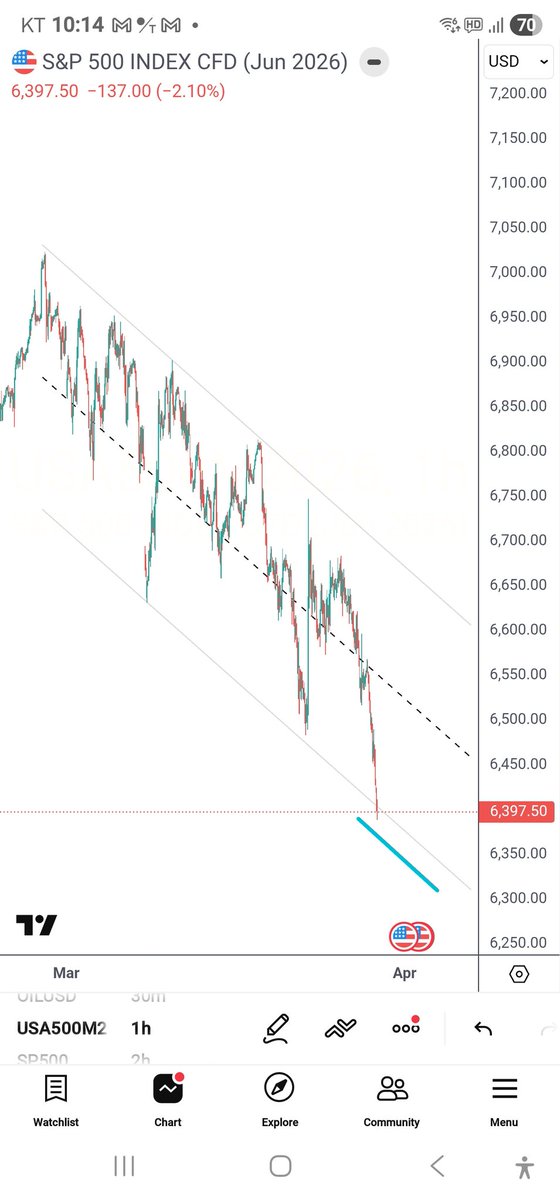
@Investor_Dayu Gary still with the thought with the 30 min chart we might go to 6450-6470 and gap fill first SPX
English
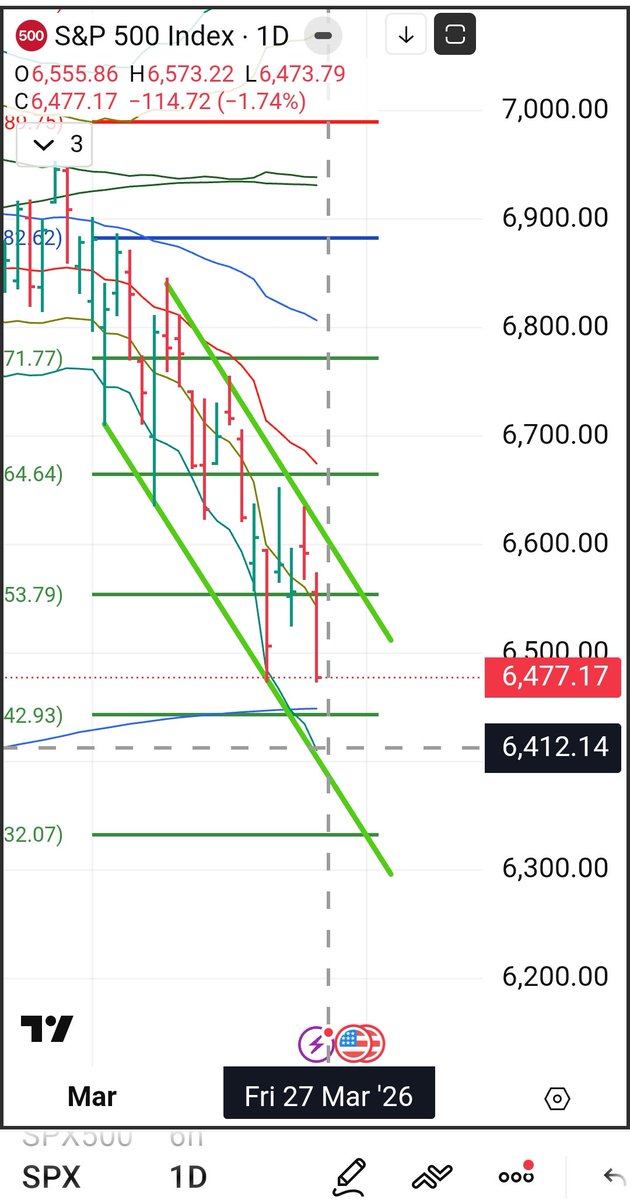
$spx wave update attached.
Comments: 1) this is a 3-wave decline from the top. So a large-size bounce is likely to follow. 2) 6350-60 is the Fib.236 and 6170-80 is the Fib.382. They are typically where a drop could bottom. So if $spx breaks 6330, likely it will land 6200-6170.

English


15 days ago. 16k viewers saw me take a stand and predict where we MIGHT go on $SPX. 15 days later. I’ll give you my updated chart and next leg prediction.
As ALWAYS. Willing to be Wrong. Happy to hear your perspective. Bookmark & Share it.
Bakery link in my bio.

The Real Donald Pump@FiboNachoLibre
$SPX - Hear me out tho. I’ll welcome any feedback in support or to challenge.
English

I’m the only person in X who called 7000 S&P crash to 6226????
Check pinned tweet for crash roadmap
English

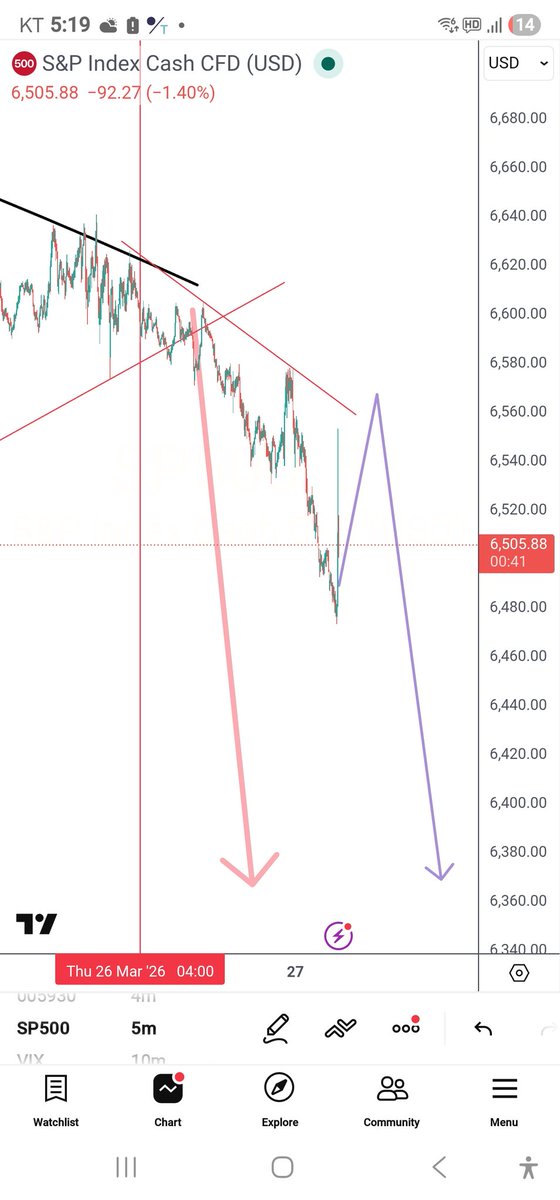
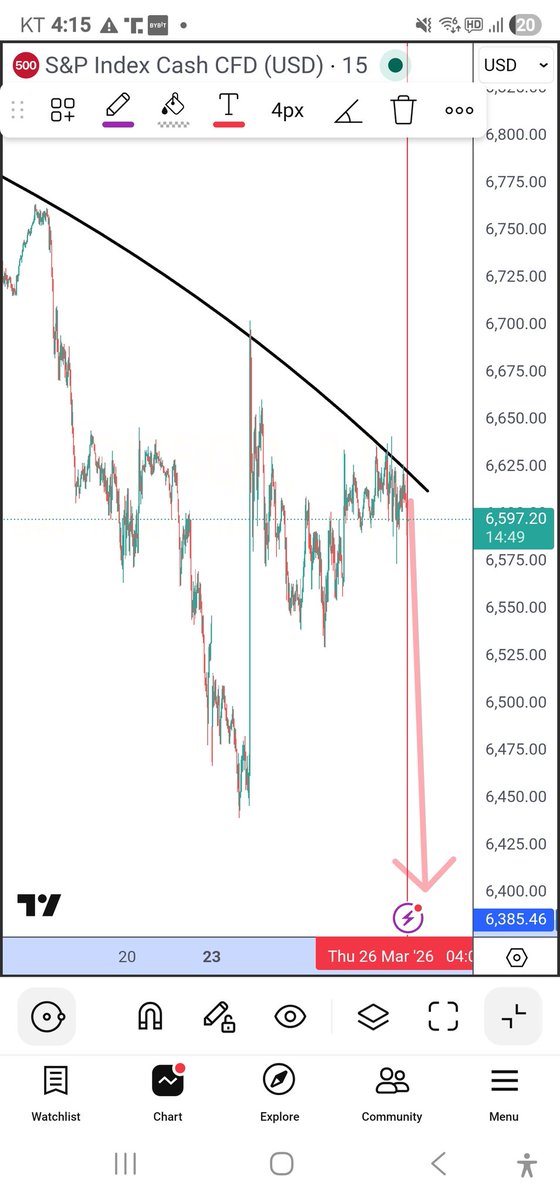
$SPX dropped to 6350 after market. Although it hit the target, bottom is Not in yet. On 30m chart, today’s drop appears to be just wave-(iii) down. A bounce (wave-(iv) ) on Monday morning and then drop again in wave-(v) targeting 6200-6300. A strong bounce can start from there.
Gary@Investor_Dayu
At this point, it seems that Scenario #2 is playing out. In my model, tomorrow is also a down day. Target is 6350-6380, but could spike down even lower. The good news is that after this spike down, $spx will have a very strong bounce in the magnitude of a few hundred points.
English
@Jimmy56541 Game plan …. 6450/6470 then to 6300 maybe a trump tweet …
English

Very likely latest Tuesday
6300
Citrini@citrini
Likely going to put in a bottom on Monday…in the short term, at least.
English
@BITCOINFUNDMGR Mega crash didn’t you write low is close .. we can get our now … while you driving a big shot
English

URGENT STOCK MARKET UPDATE
How to survive the mega crash that's going to happen this week. I'm going to upload precise instructions on what to do over the weekend while the stock market is closed so that you can get the greatest amount of profit. My analysis is not complete yet. But as soon as it is, I'll tell subscribers and my free telegram room members
English
@BITCOINFUNDMGR Okay so happens to those who paid 179. And arnt wealthy .. who trusted your tweets … its going here it going there .. 1,000,675 percent return
?? All bs where the 7039 line
Total joke you have no idea
English
S&P 500 weekend update.
This is the death line. This light blue line signifies death. If we go over it and linger there for more than an hour and a half, there's an ever-increasing chance that we're just going to continue going straight down and even faster.
I was expecting one last pump. But that might not even happen.
The wealthiest and wisest people trading over $200,000 hire me to manage at least 10% of that. I'm at Max algorithmic intelligence at max leverage. I can outperform the rest of your 90% with just 10.
English

@Investor_Dayu Nevermind that was 5”march 20. So from 6380
Bounce to 6700 …
English
At this point, it seems that Scenario #2 is playing out. In my model, tomorrow is also a down day. Target is 6350-6380, but could spike down even lower. The good news is that after this spike down, $spx will have a very strong bounce in the magnitude of a few hundred points.
Gary@Investor_Dayu
$spx bigger picture views are presented in the two attached charts. In S1, $spx is ready for a large bounce. In S2, $spx may bounce to 6650-80, then drop again in w-5 to around 6360 for bottoming. The wave structure of Monday’s session will help discern which path $spx will take.
English
@BITCOINFUNDMGR Okay so you have this chart up it’s showing we are going down after this pump then you have low might be in ???? See your playing both
English
My subscribers longed the exact bottom. Hell, I even give you guys the chart publicly. Here's the before and after. Actually, I don't have the before chart on this phone. So you just have to go through my timeline to find it
English
@BITCOINFUNDMGR @JLfitnessinph Trying to understand and keep looking at chart
English
No no. The stock market is all over the place. I'm just telling you which direction it's going to go just before it actually starts moving that direction.
All you have to do is use the latest chart. The latest chart is the one that's newer than the previous chart. The previous chart is the one that's older than the newest chart.
I hope that helps.
English
S&P 500 before and after. The left chart is from 2 days ago. The chart on the right is from 2 minutes ago. You see why multi-millionaires hire me to trade for them? You see why the smartest traders click the subscribe button to get exclusive private content?

English