Happy New Year, Web3 Aficionados!
Thank you for riding with us 💜
In 2026, we learn, build, share, and win together.
The Journey to Mastery continues.⚡️
We're thrilled to announce a new collaboration with @AbstractNOAH
Mint Details
Chain: Abstract
Mint Price: TBA
Supply: TBA
Launchpad: Opensea
Mint Date: in 2025
Raffle is live in our discord server:
discord.gg/Vs9DGnJysX
Before we dive in, don't forget to give me a follow @Web3Aficionado, like and repost 🔄 this thread for more people to see.
You can also join my telegram channel where I drop trade ideas, market insights...
t.me/tradewithafici…
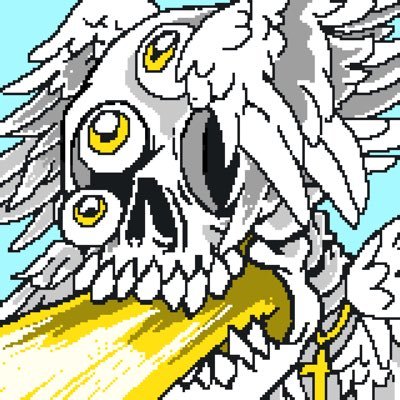
The Inside Bar:
A smaller candle that forms completely within the range of the previous one.
Psychology behind the formation:
Market is in a state of pause or indecision, often after a big move.
You can think of it as the market holding its breath.
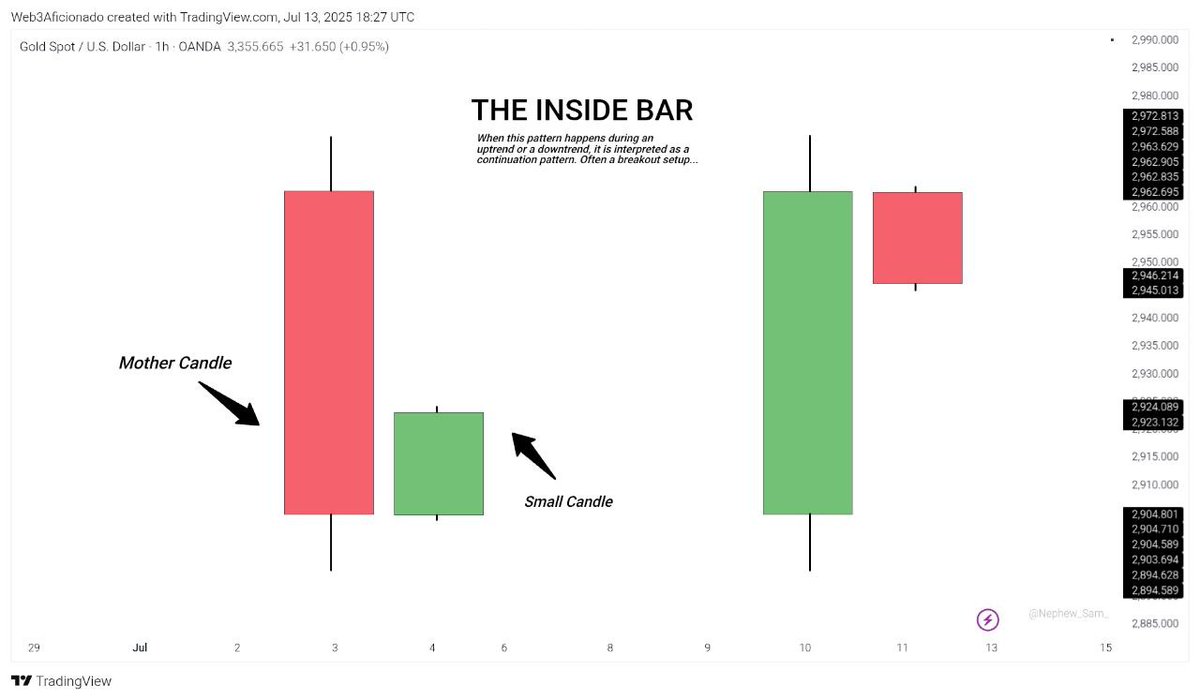
Shooting Star (Bearish Reversal)
It has a small body with a long upper wick.
Psychology behind the formation:
Buyers pushed price up, but sellers rejected it hard and brought it back down.
It shows weakness in buying pressure.
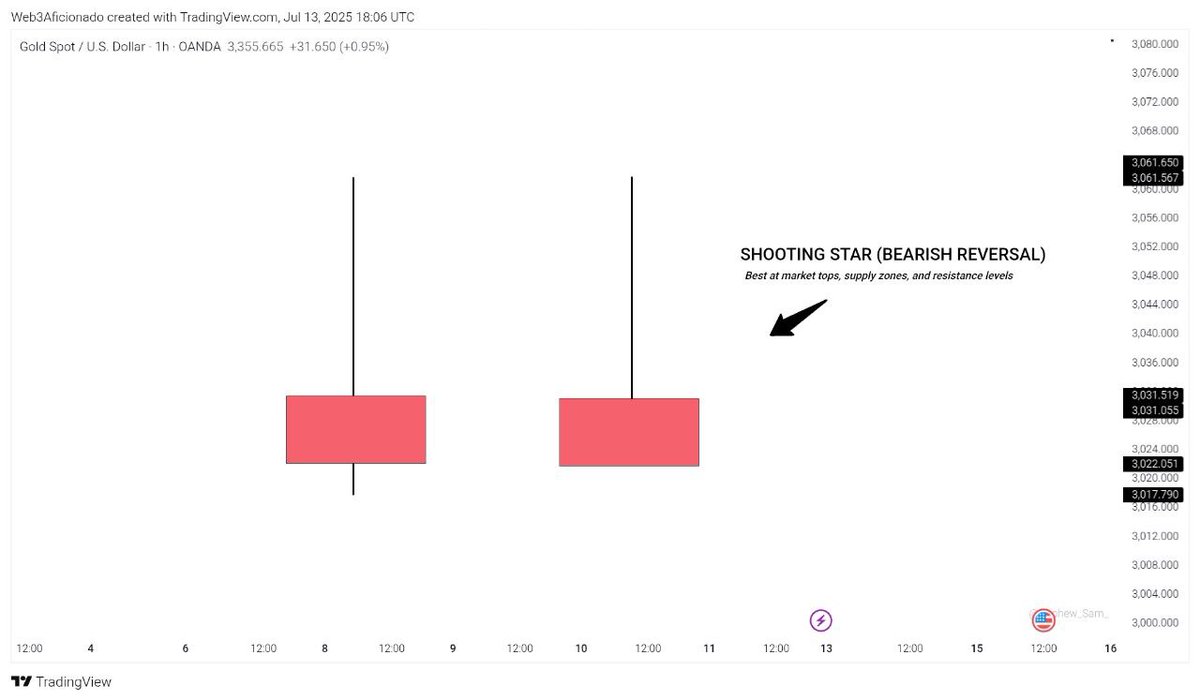
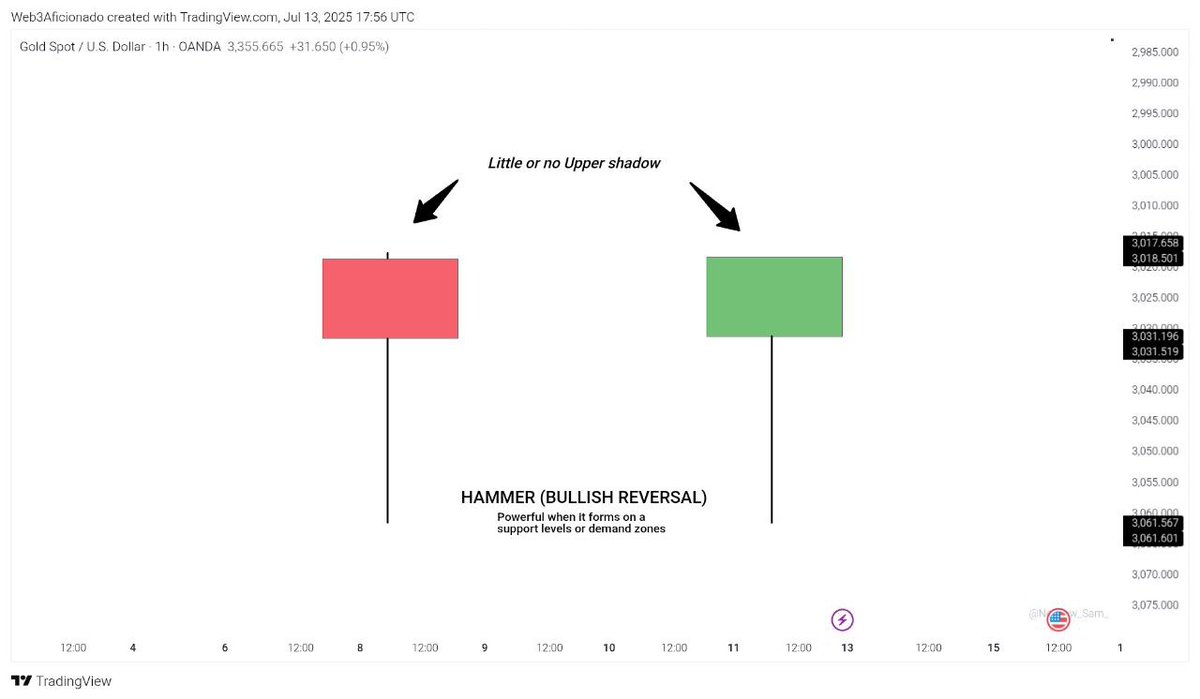
Hammer (Bullish Reversal)
This candle usually have a small body with a long lower wick.
Psychology behind the formation:
Sellers tried to push price down, but buyers fought back and closed price near the top.
Rejection of price going lower is what gives a potential bounce.
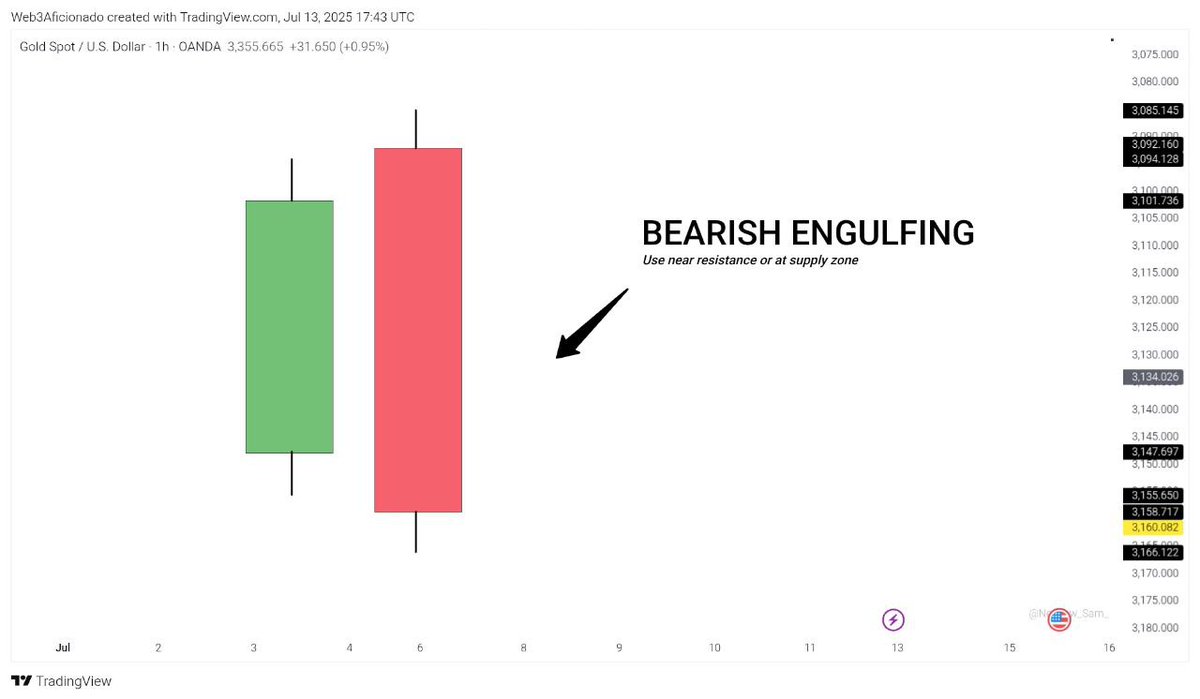
Bearish Engulfing Pattern:
It is the vice versa of a bullish engulfing bar. A bullish candle followed by a large bearish one that covers it completely
Buyers tried to push price up, but failed.
It signals possible reversal
Use near resistance or at supply zones.
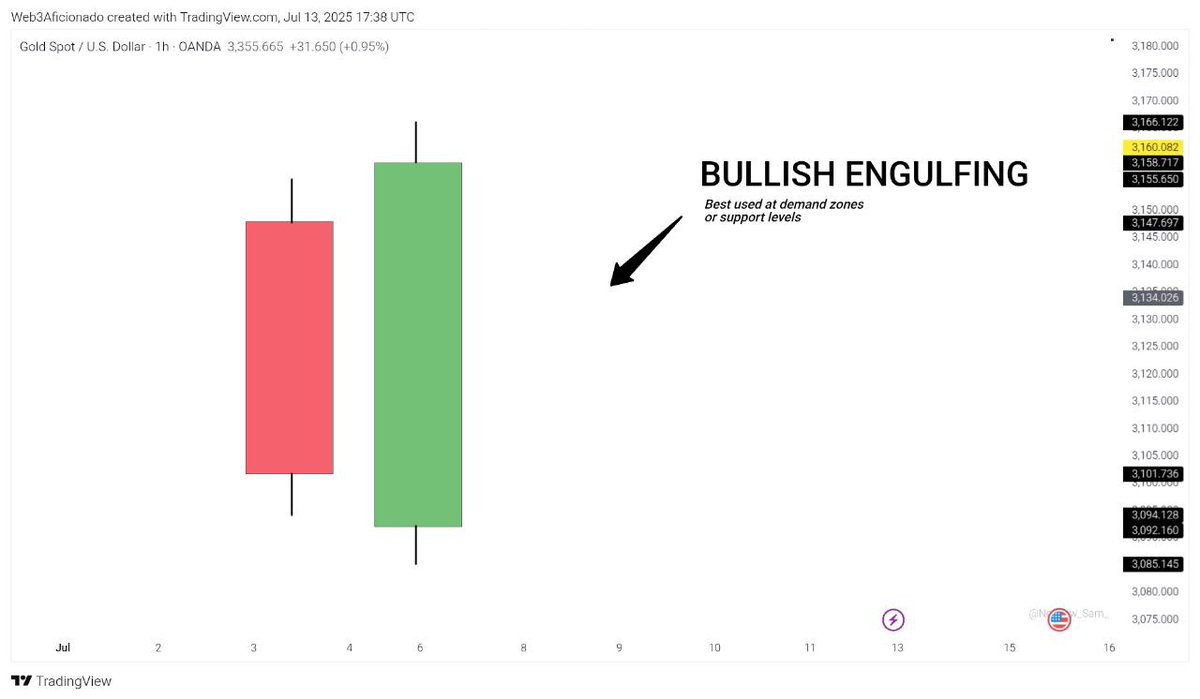
Bullish Engulfing Pattern:
A bearish candle followed by a strong bullish candle that engulfs the first.
This pattern shows that sellers were in control, but buyers came in aggressively and took over. A shift in momentum from bearish to bullish.
Candlestick Patterns Simplified
It’s not just about memorizing shapes. Candlestick patterns show you the psychology behind price — who is in control, who is getting trapped, and where the market might go next.
Here’s how to read them properly🧵
We’re bringing opportunities to our warriors ⚔️
Chain Keepers is LIVE, and we’ve got 5 WL spots up for grabs!
How to Enter:
✅ Follow @TW3_Aficionados@Web3Aficionado & @ChainKeepers_
✅ Like & Retweet
✅ Tag 2 friends who love Web3 gaming
24 hours only
MORE SPOTS IN DISCORD
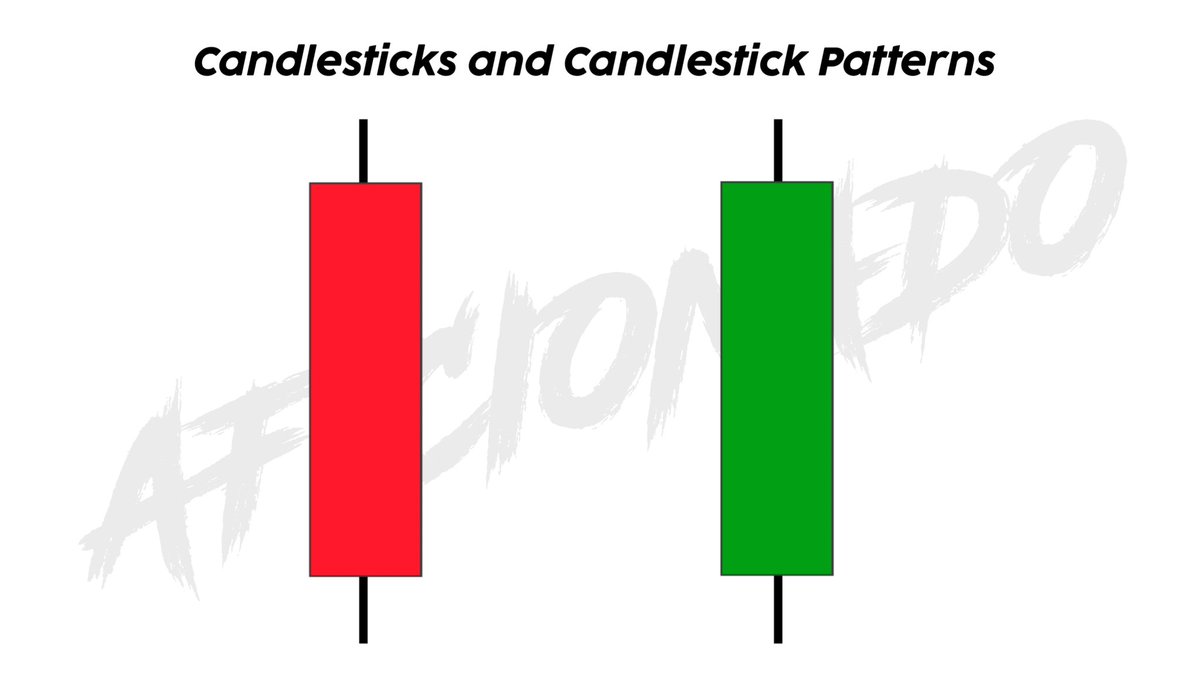
We have the bullish and the bearish candlesticks.
》A Bullish Candlestick indicates that the price is rising which means that buyers are in control.
》A Bearish Candlestick indicates that the price is falling which means that sellers are in control during this timeframe.
ANATOMY OF A CANDLESTICK
A candlestick consists of the body, and the wicks (Upper and Lower Shadow).
The body is the difference between the Open and Close of a candlestick. The wicks are the Low and High of a candlestick.
Body = strength
Wicks = rejection
Understanding Candlesticks and Candlestick Patterns
Candlesticks tell you what price is doing and who is in control of the market (buyers or sellers). It is considered as a visual representation of the movements in the market.
A thread🧵
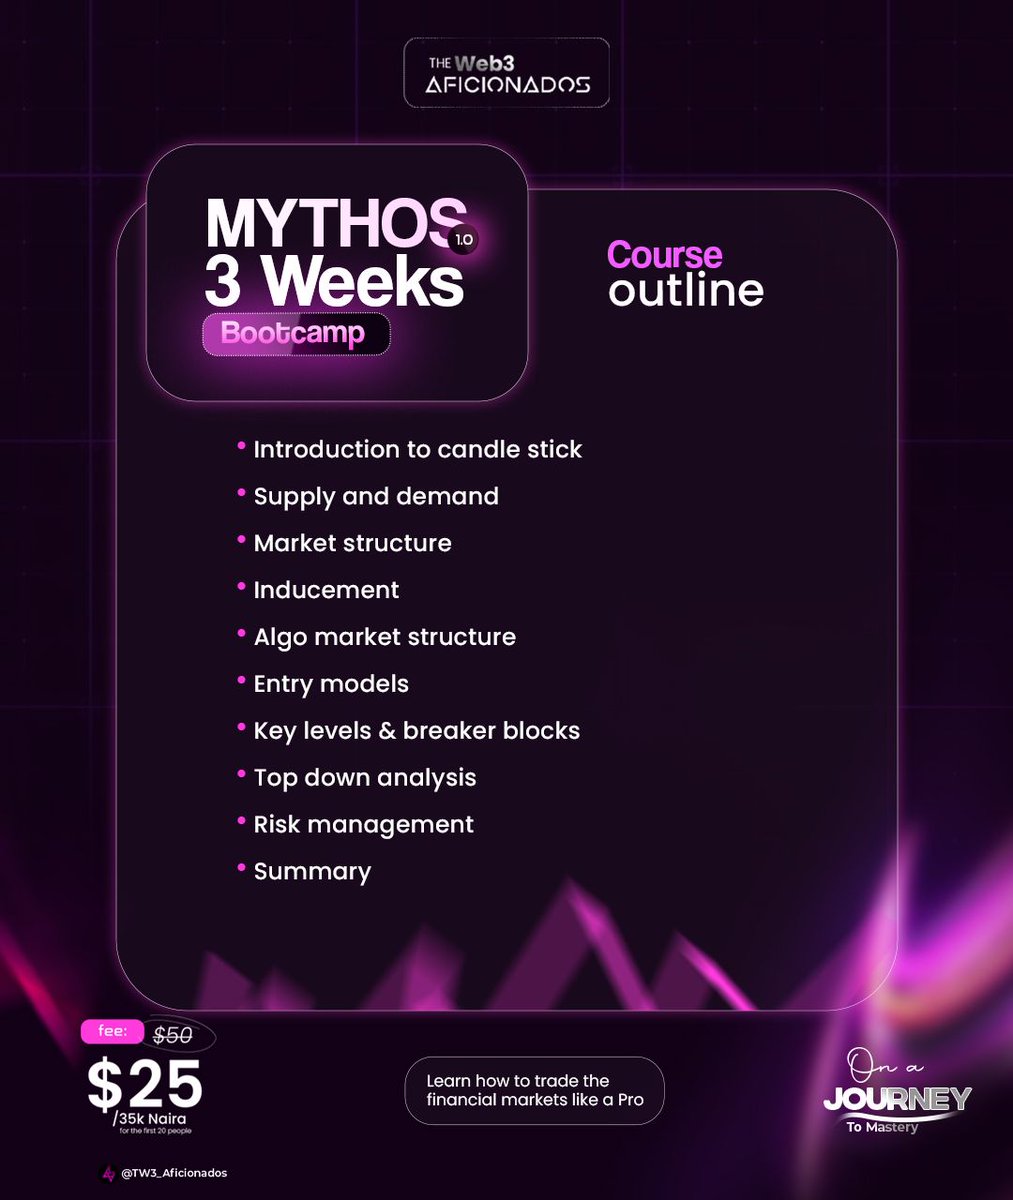
⚡MYTHOS Bootcamp 1.0 is here!
We’re running a 3 weeks trading bootcamp for anyone ready to level up their trading journey — From beginner to a Pro Trader
What You Get:
Premium trading education
Practical strategies
Community support
Access to trading mentors
INTRODUCTION TO TECHNICAL ANALYSIS — A Beginner’s Guide
Trading is not some sort of magic, it is not fortune-telling. It is just understanding how price moves, and why it moves.
That’s what technical analysis is all about.
Here’s the breakdown 🧵👇