Lone Trader

258 posts

Lone Trader

Lone Trader

@lonetrader01

Trading with a full-time Job I Swing Trader I Process • Risk Management • Discipline | No tips

Katılım Ekim 2025
167 Takip Edilen52 Takipçiler
Sabitlenmiş Tweet
Lone Trader
Lone Trader@lonetrader01·
Most traders fail because they complicate charts with different indicators. I did the same until I simplified it. I’ve documented my swing trading framework in free eBook covering:✅ Simple Setups ✅ Clear Entries ✅ Strict Exit 📘 Get free eBook here: 👉linktr.ee/llonetrader
Lone Trader tweet media
English
0
0
2
37
Lone Trader
Lone Trader@lonetrader01·
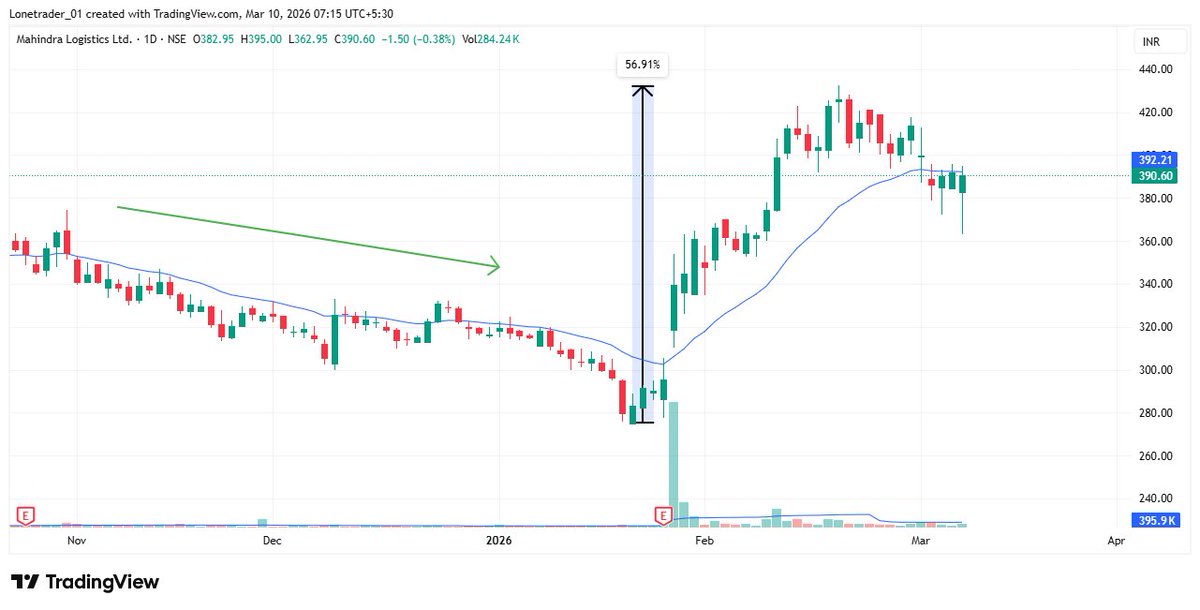
#MAHLOG after moving more than 50% stock is relaxing near 20 ema
Lone Trader tweet media
English
0
0
0
205
Lone Trader retweetledi
Himanshu sharma
Himanshu sharma@pheonix_trader·
✅" Mastery in One Setup" 1⃣Strong first leg up: Multiple wide-range expansion bars accompanied by heavy volume, signaling institutional interest. 2⃣Sideways consolidation: Price drifts sideways and pulls into the 10- or 20-day moving average while volume and volatility contract. 3⃣Breakout: Price and volume expand as the stock pushes out of the consolidation range. Consistency is not glamorous. Same setups, same rules, same process — every single day.
Himanshu sharma tweet media
English
3
6
93
4.5K
Lone Trader retweetledi
iain
iain@ohiain·
I've seen so many traders, including myself early on, get completely lost trying to figure out market conditions by staring at ten different indicators, reading all news headlines, and overcomplicating what should be a straightforward process. We get caught up in trying to interpret whether the market is bullish or bearish, whether we're in a digestion phase or a breakout phase, and we end up paralyzed by analysis instead of just trading what's in front of us. ...but there's one thing that cuts through all the noise, and it's something every trader has access to regardless of their style, timeframe, or strategy: your own equity curve. Your P&L is the most honest feedback you're going to get about whether you're reading the market correctly or not, and if you learn to respect what it's telling you, it will guide your aggressiveness and keep you out of trouble when you need it most. @theogustincic said it perfectly: "I totally agree I think a lot of beginner traders get lost in the sheer amount of available information, especially when facing other traders who don't necessarily share the same style. But one thing all traders have in common is the feedback from their own P&L. It's a universal rule for all traders, no matter their style." because your equity curve doesn't lie to you, it doesn't have an agenda, and it doesn't care about your opinion on what the market should be doing. It's pure feedback, and if you're honest with yourself about what it's showing you, it becomes the simplest and most powerful indicator you have for determining how aggressive or defensive you should be. How I think about it now is if the indices are weak, if the market is digesting or choppy, but my trades are working well, and my equity curve is moving up and to the right, then I'm right, and the market environment doesn't matter as much. In that scenario, I stay focused on my setups and my positions because clearly I'm finding the pockets of opportunity that are working, whether it's a strong theme, stocks with relative strength, or just being in the right names at the right time. I don't need the market to be ripping for me to make money, I just need to be trading what's working, and my equity curve is telling me that I am. ...but on the flip side, if the indices are strong, if the market is trending higher and everything looks great on the surface, but I'm on a losing streak, and my equity curve is bleeding, then I need to ignore what the market is doing and be defensive. It doesn't matter if everyone else is making money or if the headlines are bullish... if my P&L is telling me I'm wrong, then I'm wrong, and I need to size down, step back, and reassess. This approach has saved me from so many bad decisions, because it forces me to be objective instead of emotional or "ego driven" as many would say. Two years ago, I'd see the market ripping and convince myself I needed to be in it, even when my trades weren't working, and I'd force positions that had no business being on my risk. ...or I'd see the market weak and assume nothing was working, even when I had winning trades in front of me, and I'd size too small or exit too early out of fear. and now I let my equity curve be my guide for how aggressive or defensive I should be, and it's one of the simplest yet most effective ways I've found to navigate market conditions without overcomplicating things. At the end of the day, your equity curve is feedback from your trades, and it's the most important factor in determining your aggressiveness regardless of what the market is doing. If you're making money, stay engaged and focused on what's working. If you're losing money, size down and get defensive until you figure out what's off. It's that simple, and it's universal for every trader, no matter what style you trade or what timeframe you're on. Stop overcomplicating market conditions and start listening to what your P&L is telling you... because in my humble opinion, it's the one indicator that matters most!
English
10
12
151
23.5K
Lone Trader retweetledi
Trading Hustler 📈
Trading Hustler 📈@tradinghustlr·
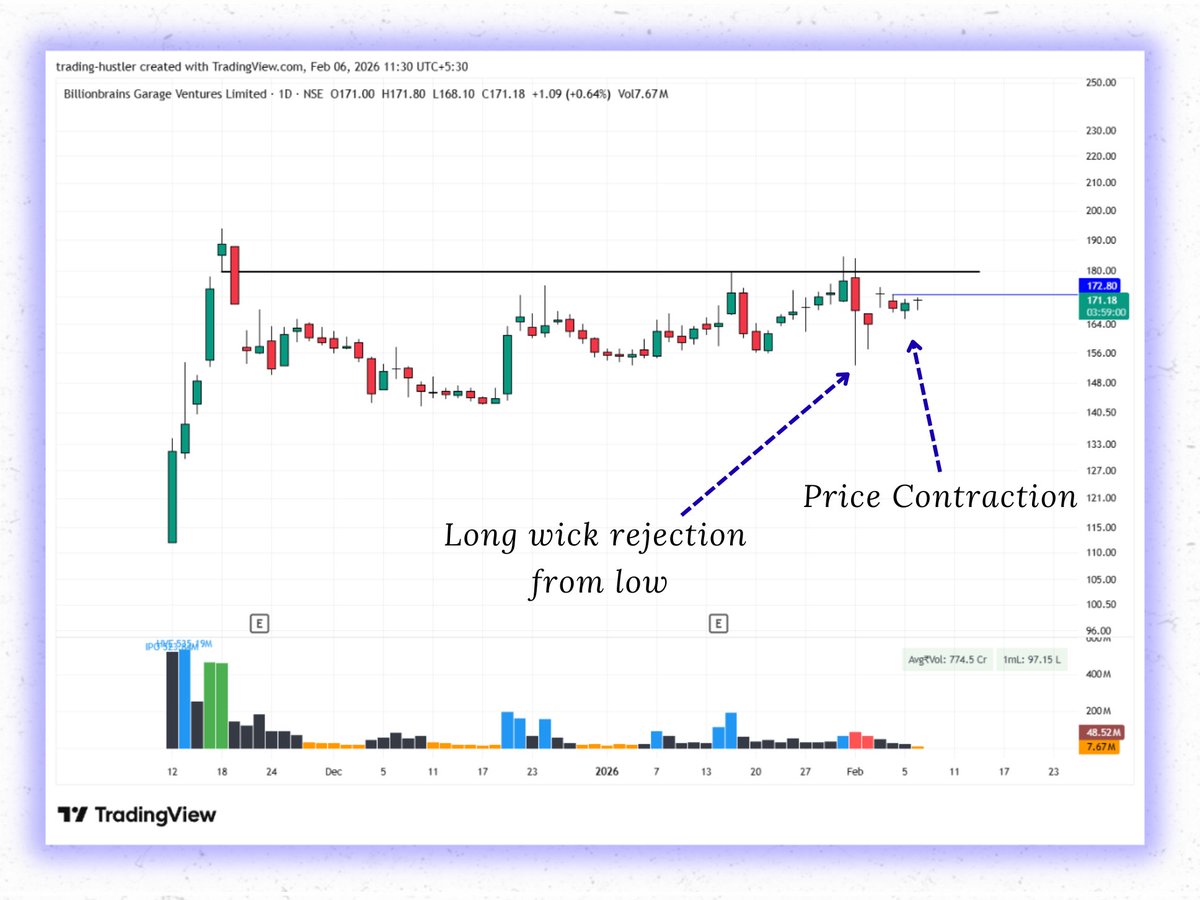
GROWW A very tight contraction with low volume before Breakout. Long wick rejection from low & contraction to control the volatility is a good sign even after a decent earnings call. - Recent IPO - Good move after listing - A 20% base depth & contraction - 173 is the Precise Pivot Breakout point No Recommendation, DYOR!!
Trading Hustler 📈 tweet media
English
2
6
73
6.8K
Lone Trader retweetledi
Sai Shankar
Sai Shankar@sai_shankarg·
Swing Highs and Swing Lows - the price structure reference. Swing highs and lows in a trend are one of the simplest and most reliable ways to understand trend, trend shifts, and stage transitions. It works on every timeframe because price is fractal, what you see on higher timeframes always starts on the lower ones. Price moves in cycles. Every expansion phase is followed by contraction. In an uptrend, a higher low during contraction signals accumulation. This is what people call VCP - more than a pattern it’s just the natural phenomenon of price tightening as sellers dry up. In a downtrend, a lower low signals increasing weakness and continued dominance of sellers. Stage 2 trends are defined by higher highs and higher lows, with contractions forming higher lows. The first signs of weakness, often followed by a climax top, hint at a potential shift. Repeated lower lows near the top mark Stage 3 distribution. A break of the key swing low that led to the highest high signals the transition into Stage 4, where lower highs and lower lows take over. The cycle usually looks like this: Expansion to the upside, forming a higher high → pullback that holds a higher low → a series of contractions with higher lows → another expansion up → the first sign of weakness with a lower low → a sequence of lower highs and lower lows → pullbacks that makes lower lows → contractions forming lower highs. The cycle keeps repeating. Spotting structure through swing highs and lows keeps you aligned with the right side of the trend. Add volume, and conviction improves - expansion with rising volume, contraction with drying volume. The real edge is finding setups within this cycle that offer asymmetric risk reward and managing them well.
Sai Shankar tweet media
English
0
8
71
5.9K
Lone Trader
Lone Trader@lonetrader01·
A tight Stop Loss is double-edged sword.⚔️ When trade works, the impact on your equity curve is exponential because your position sizing can be larger with smaller risk. You will get stopped out more frequently. The key isn't tight stops it's knowing when the setup allows for one
Lone Trader tweet media
English
0
0
0
8
Lone Trader
Lone Trader@lonetrader01·
Just watched a podcast featuring @iManasArora and @AnkurPatel59 sir, and it completely changed how I look at Stop Losses. I reviewed my past data and realized: Tighter SL = Higher captured profit. 📉 See the chart below for the breakdown. 👇
Lone Trader tweet media
English
0
0
0
12
Lone Trader
Lone Trader@lonetrader01·
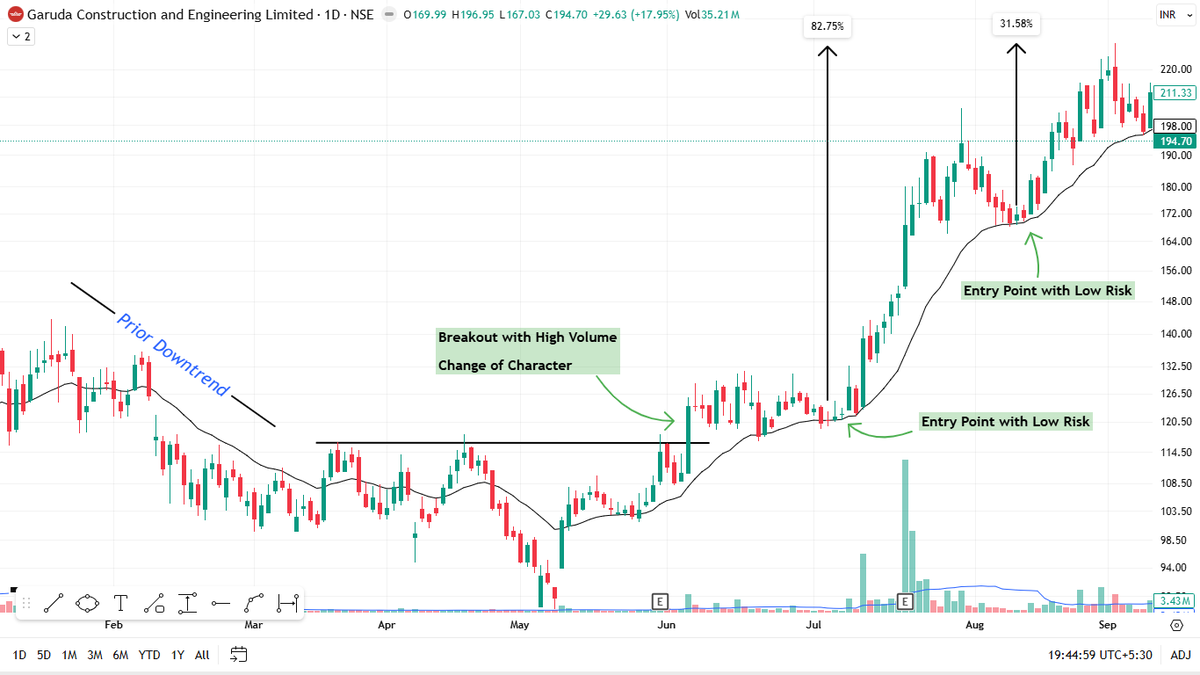
Confused about entries? Study this chart of $GARUDA Once price flipped structure, buying pullbacks near 20 EMA kept risk tight. Simple logic. Consistent execution. #SwingTrading #PriceAction
Lone Trader tweet media
English
0
0
1
17
Balu Gorade
Balu Gorade@BaluGorade·
idk what others think, but Tata Motors is making some of the best looking cars in India, apart from safety. Punch, Nexon, Harrier, now Sierra. What's your take?
English
78
1
224
17.8K
Lone Trader
Lone Trader@lonetrader01·
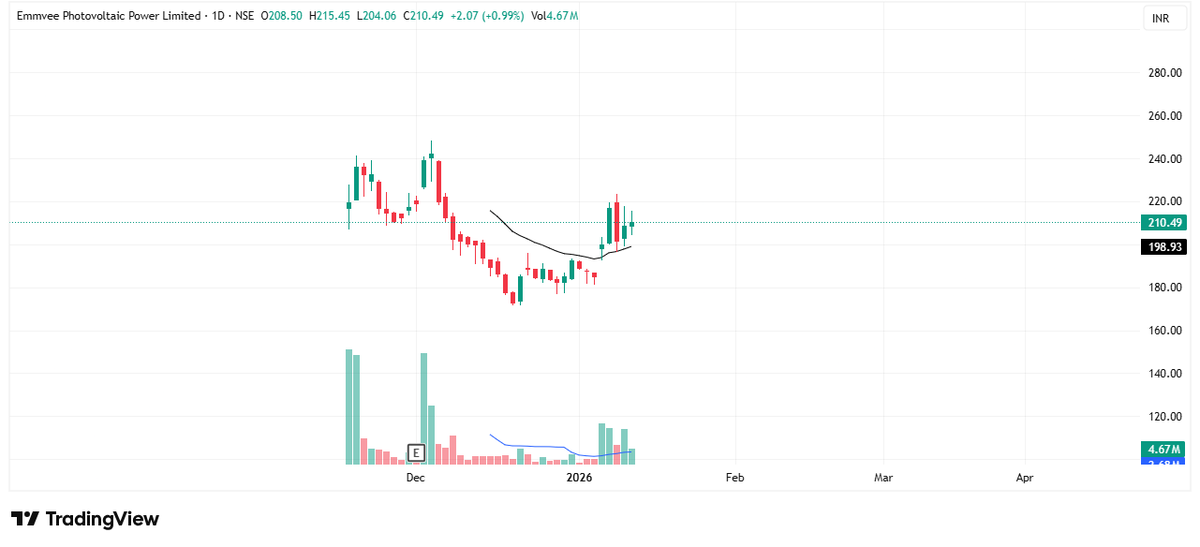
After a post-listing correction from ₹248 down to ₹171, the stock has formed a base and is showing reversal signs, Emmvee is an integrated solar PV module and cell manufacturer. Unlike some competitors who just assemble modules, $EMMVEE has backward integration into solar cells
Lone Trader tweet media
English
0
0
1
179
Lone Trader
Lone Trader@lonetrader01·
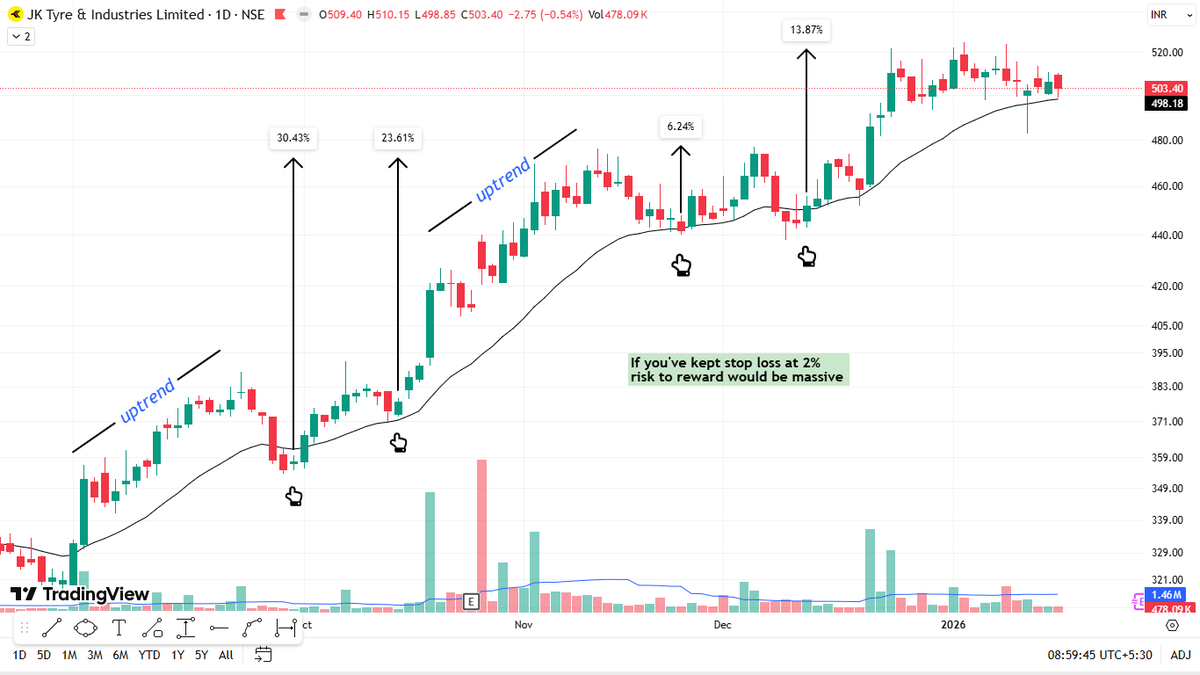
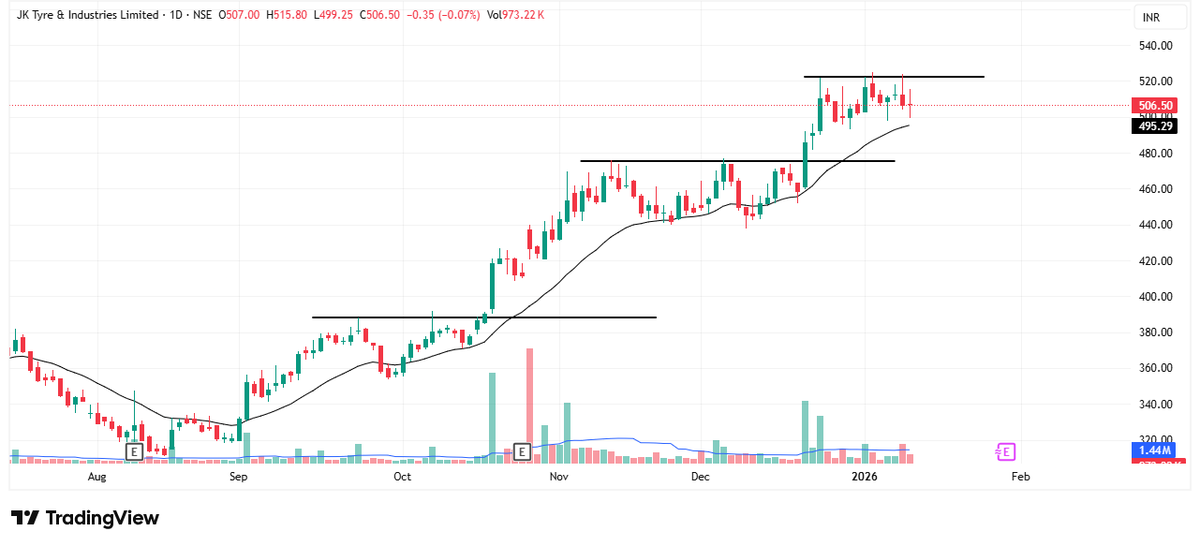
$JKTYRE | Daily TF Uptrend intact. Price is holding above 20 EMA and consolidating near highs — a sign of strength, not weakness.
Lone Trader tweet media
English
0
0
1
27
Lone Trader retweetledi
Ankur Patel
Ankur Patel@AnkurPatel59·
Your Weekly Reminder that Pattern Keeps Repeating.
Ankur Patel tweet mediaAnkur Patel tweet mediaAnkur Patel tweet mediaAnkur Patel tweet media
English
4
57
412
19.3K
Lone Trader retweetledi
Ankur Patel
Ankur Patel@AnkurPatel59·
Most traders know what their setups look like. But they don't know when they work. You might know what a flag pattern is. You might know what a VCP looks like. But do you know at what stage of the market they work best? Do you know when to avoid them? Do you know what kind of reward and frequency to expect? This is where I think most traders falter. Look at this chart. On the left side, you see flags and VCPs forming after a consolidation phase. High availability. Lots of these setups appearing. Altho a lot of the times with limited reward, as they often appear after a decent move from the lows. On the right side, after a downtrend and sustained selling, you see bottom bounces and Episodic pivots (EPs). Low availability. These setups are rare just because they often form after bear markets. But high reward when they appear. So you see, different setups appear at different stages of the market and require different risk profiles. If you're trading VCPs or Bases during exhaustion, you're going to get chopped up. If you're waiting for bottom bounces when the market is already in strength, you'll be in laggards. You have to know your setups deeply. Not just what they look like, but when they form, where they work, and what to expect from them. Most traders treat every setup the same. They expect the same result. And they wonder why their consistency is all over the place. Know your setups. Know when they work. Know what to expect. Adjust yourself accordingly. That's how you stay consistent across different market conditions.
Ankur Patel tweet media
English
10
38
329
17.4K
Lone Trader retweetledi
Hiren Gabani 📈
Hiren Gabani 📈@Hirengabani23·
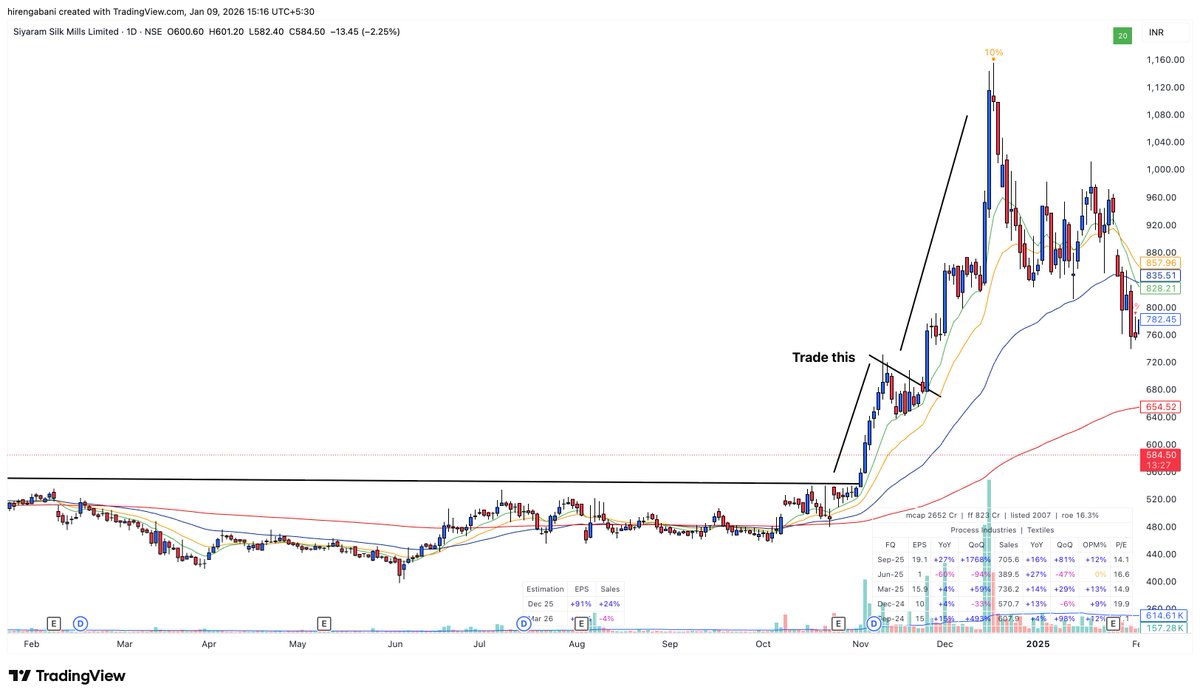
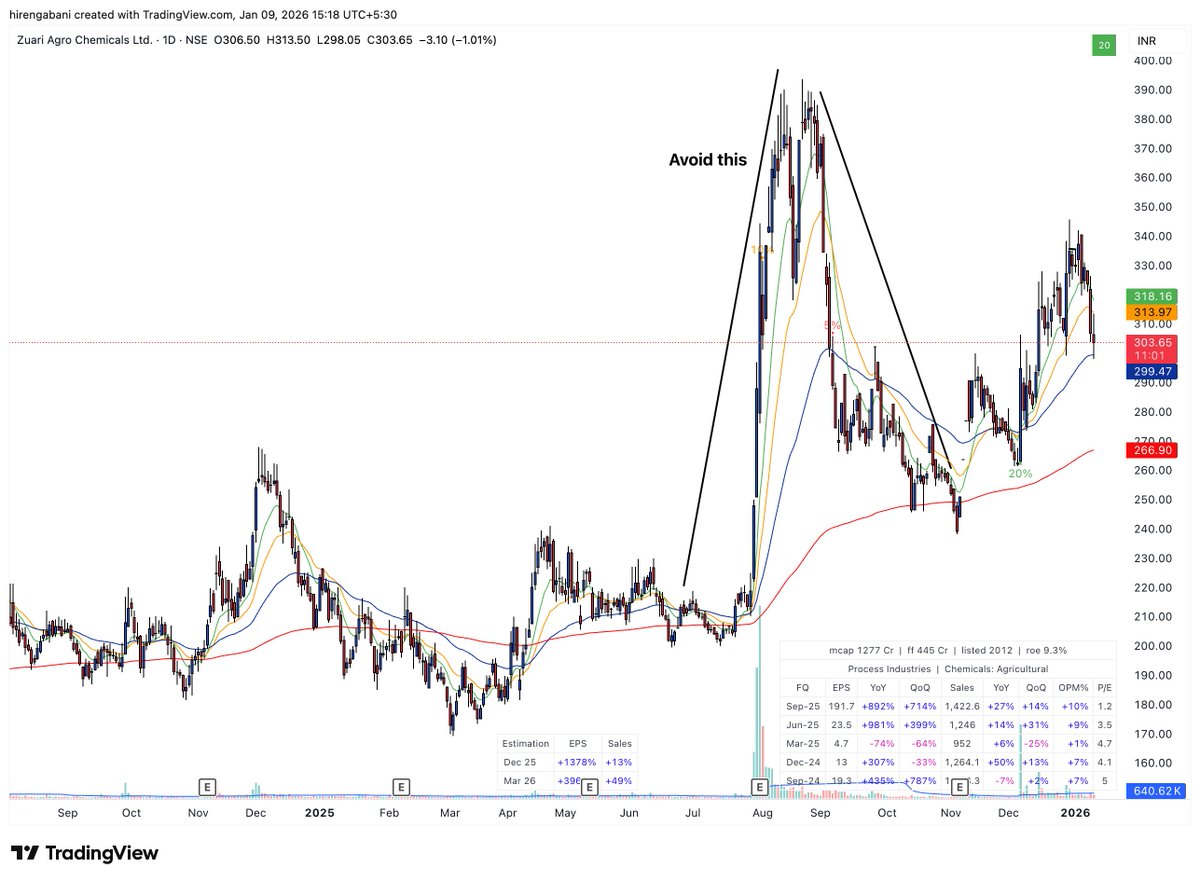
💫What to do VS what to avoid.
Hiren Gabani 📈 tweet mediaHiren Gabani 📈 tweet mediaHiren Gabani 📈 tweet mediaHiren Gabani 📈 tweet media
English
4
12
153
8.8K
JayneshKasliwal
JayneshKasliwal@JayneshKasliwal·
I’m 25 years old from India 🇮🇳 -made ₹9 crore from Indian stocks & swing trades in the last 11 months -travelled to 27 countries (yes ) -bought my dream car — and a sea-facing flat in Mumbai -built a home gym and train every single day all thanks to the Indian stock market 📈 None of this is true 😄 But posts like these create engagement !
English
84
50
1.1K
155.7K
Lone Trader
Lone Trader@lonetrader01·
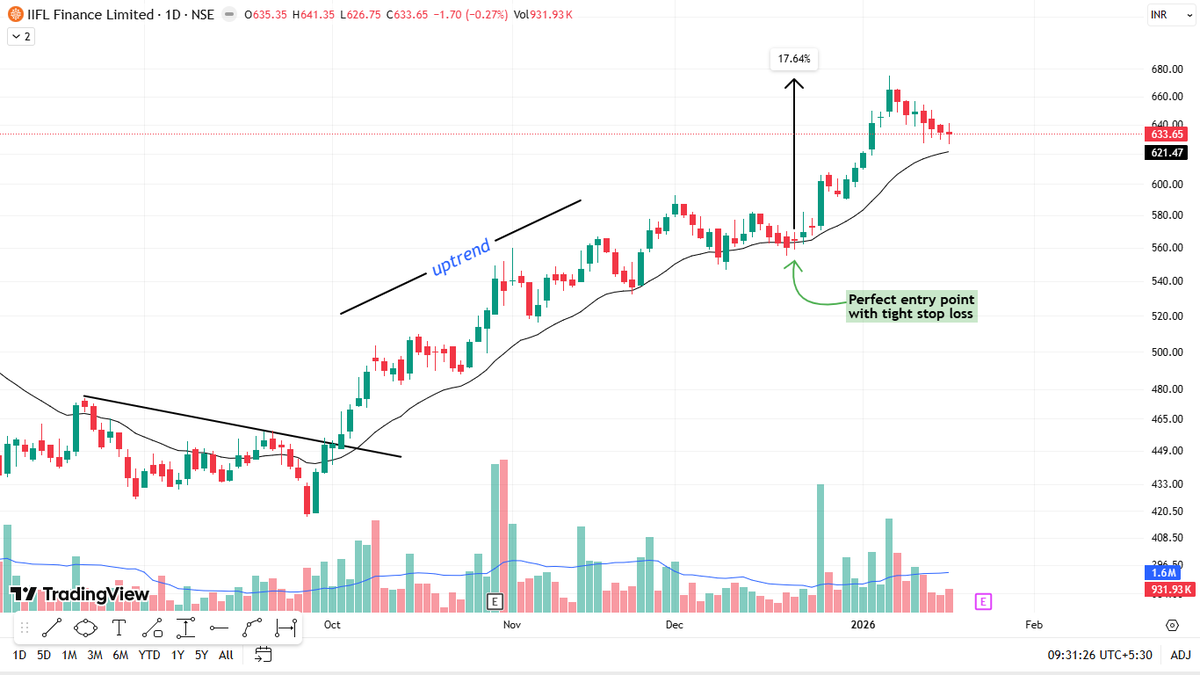
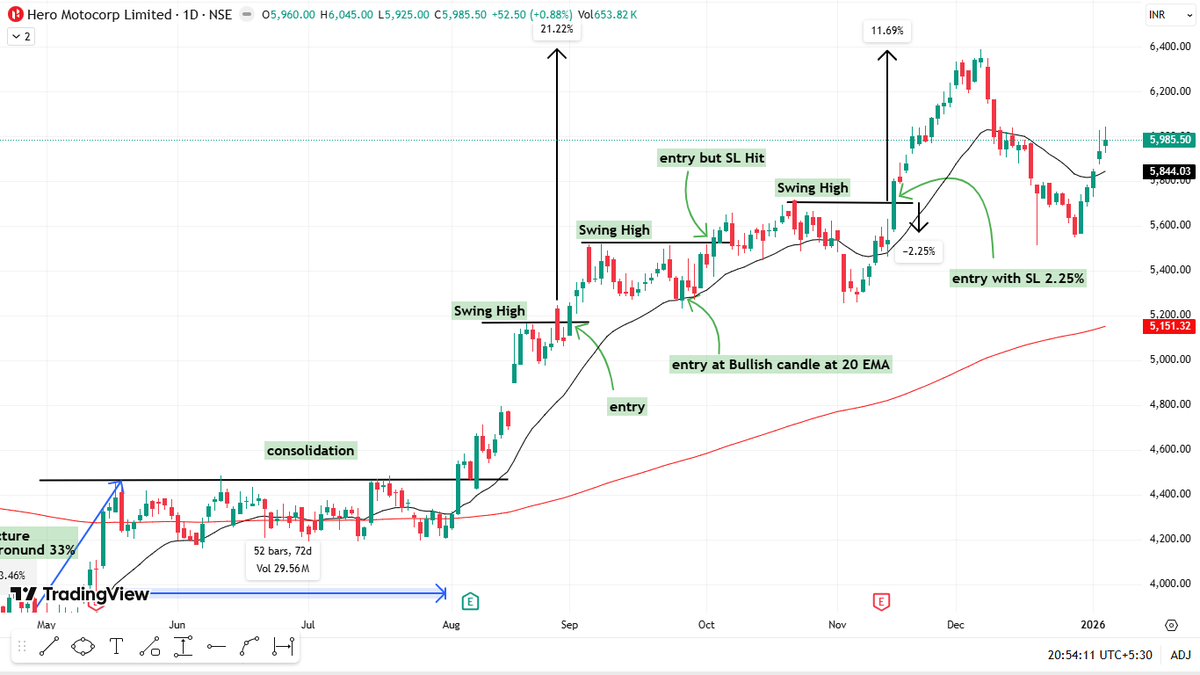
After the breakout, multiple entry opportunities were available. Focus on entries at or above the 20 EMA, as long as price structure remains intact.
Lone Trader tweet media
English
0
0
1
20
Lone Trader
Lone Trader@lonetrader01·
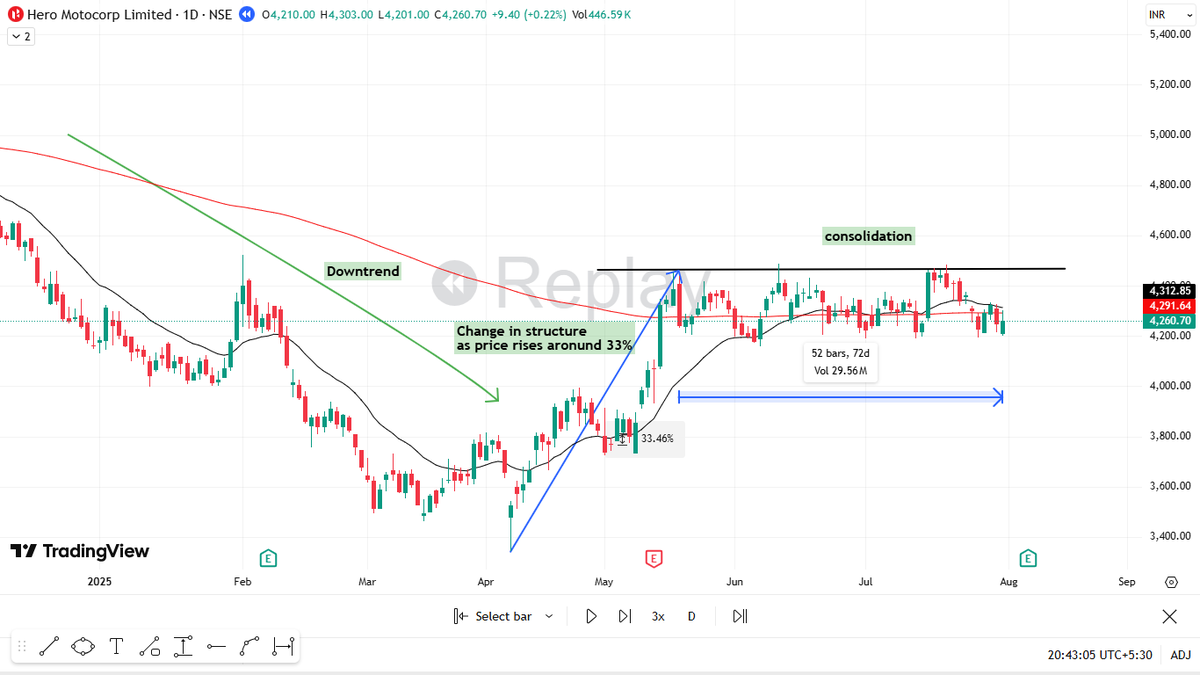
A clear change in character occurred when the prior downtrend ended, price moved higher, and then began consolidating — signaling a shift in control.
Lone Trader tweet media
English
1
0
0
19
Lone Trader
Lone Trader@lonetrader01·
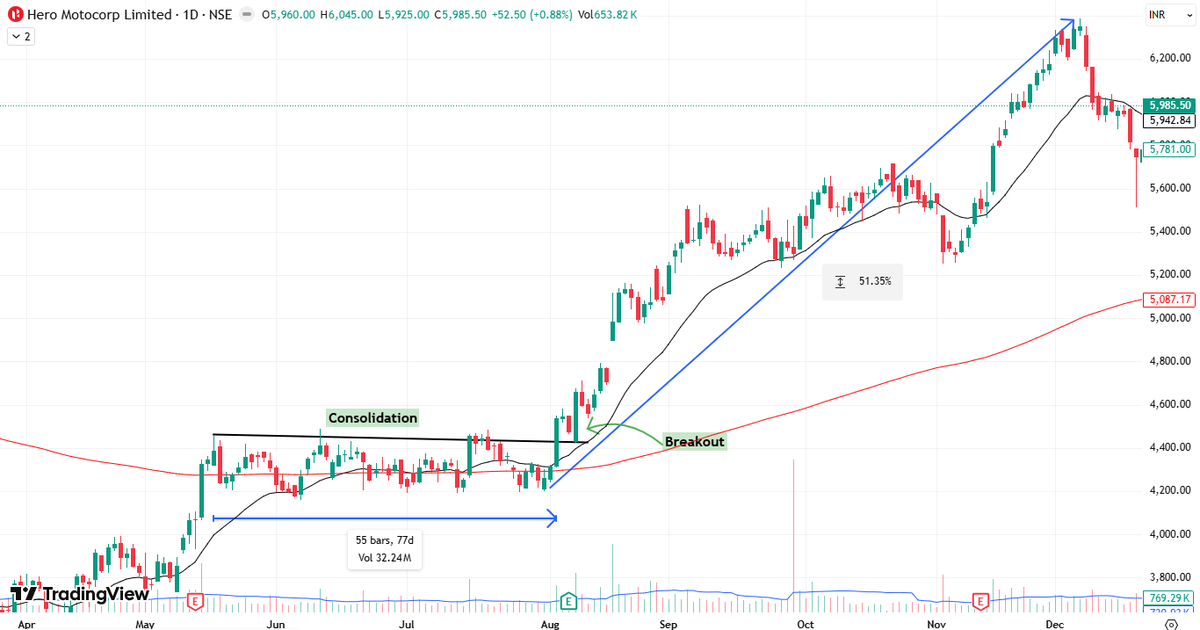
Hero MotoCorp is a clear example of why structure matters more than indicators. Let’s break down how this move could have been captured — thread 🧵 $HEROMOTOCO
Lone Trader tweet media
English
1
0
0
80