
meduzzard
162 posts

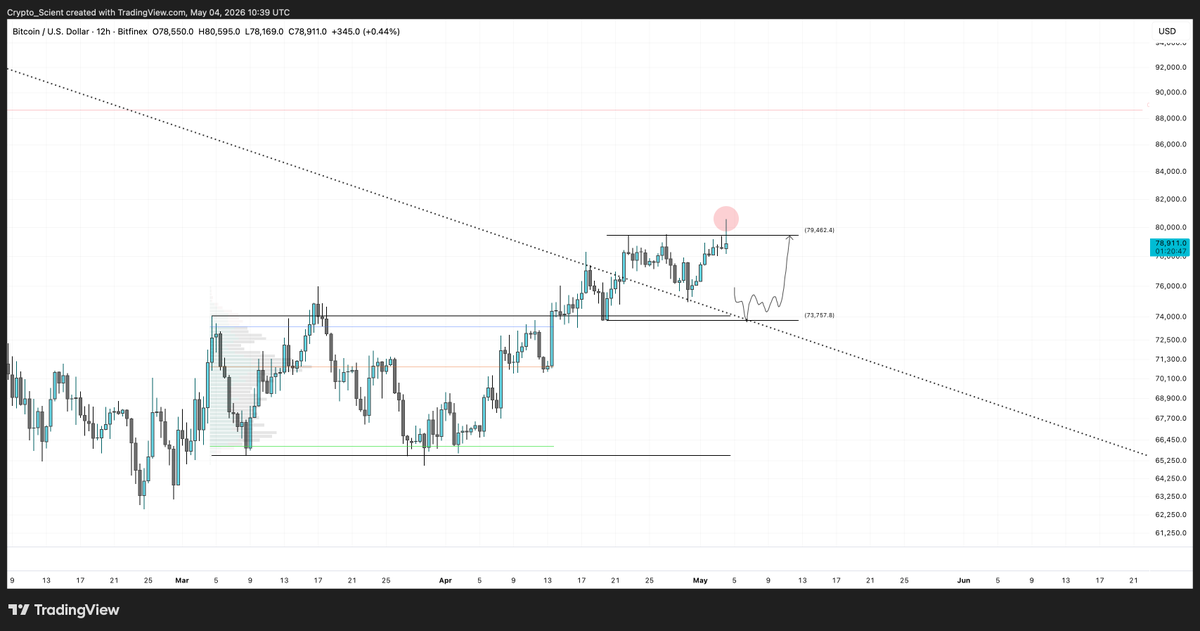
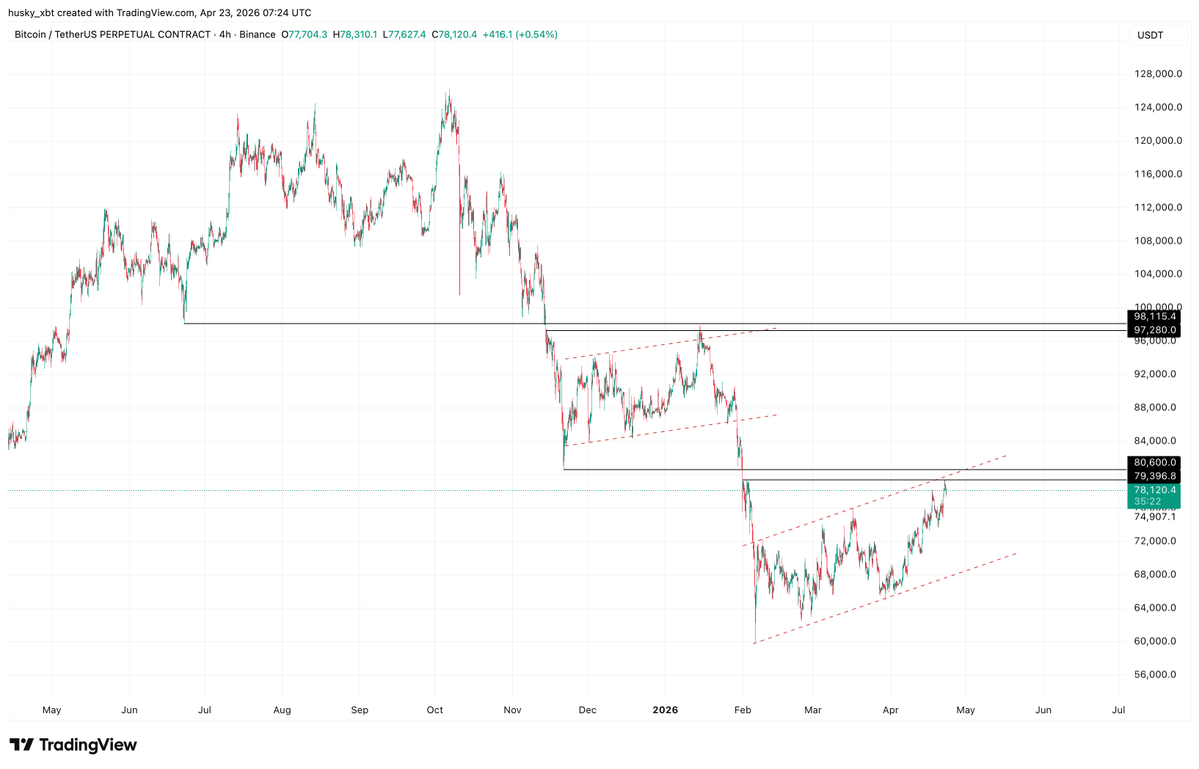
$BTC, 12H close is key here
If price wicks above $79.4k and closes back below (SFP = liquidity sweep), I’ll treat this as a liquidity grab and will look for a scalp short toward $74k
For longs, patience. Main area or interest: $73.8k–$74k
Why this zone matters:
• Diagonal trend support (flip attempt retest of ATH downtrend we broke last month)
• Previous range highs + VAH (old resistance turning support)
• Daily moving averages (dynamic support)
$74k is my LIS to keep the bullish structure intact.
#BTC #BTCUSDT
English
meduzzard retweetledi

@Crypto_Scient structure looks similar to $BNB with that range and sweep
English
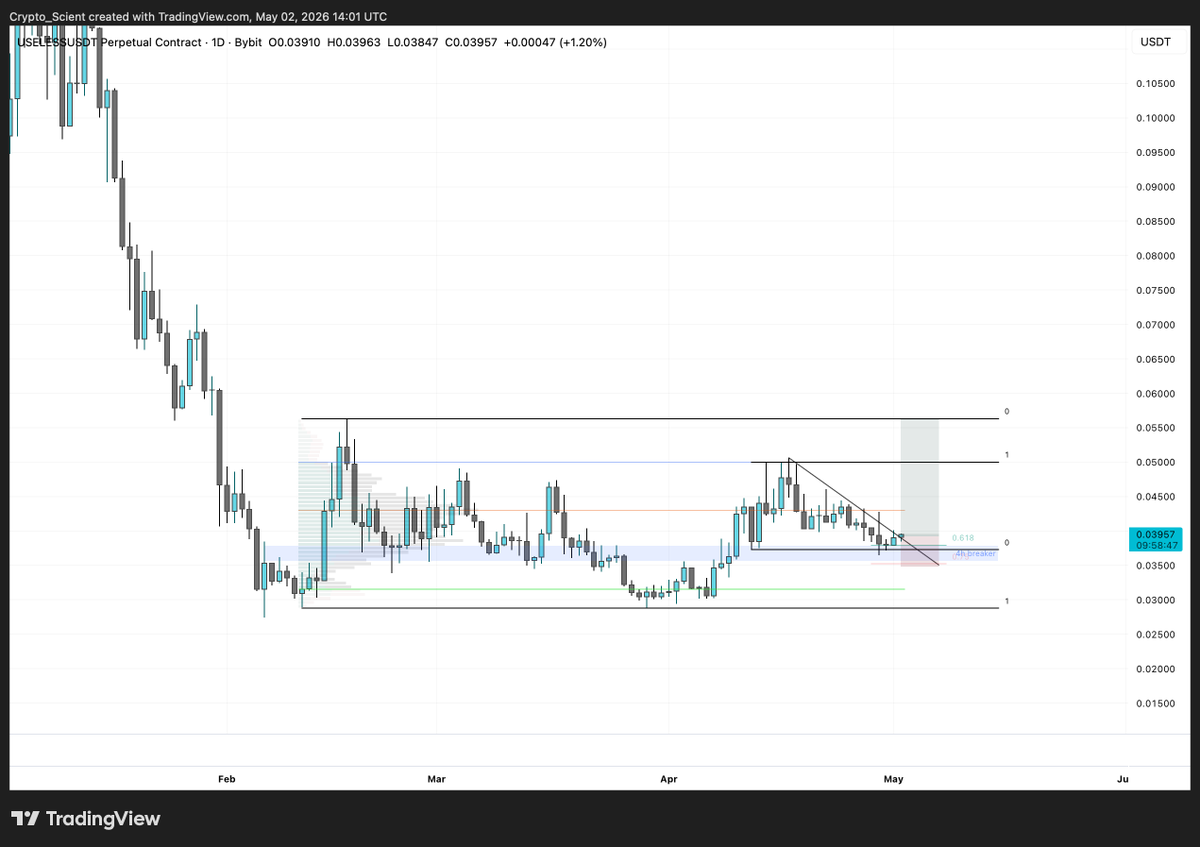
$USELESS, On the 4H, we have a well-defined range.
Price swept the range lows and deviated below VAL, then reclaimed, that’s a constructive, bullish signal.
Within this larger range, price has now broken above the 4H breaker zone and is attempting to flip it into support.
• Looks like it’s trying to build a mini range above the breaker. Currently sitting at the range lows of this mini structure.
As long as these lows hold, I’m targeting a move toward the range highs.
Simple range dynamics from here.
#USELESS #USELESSUSDT
English


$AIXBT i do want to see this go parabolic soon.....

Swiss@swisstrader09
bought a spot bag of $AIXBT around current prices.... upside potential is huge with clear downside risk wouldn't rule out a 2/3x over coming months if environment favours it
English

meduzzard retweetledi

April was a productive month for us overall.
We achieved solid results in TWC Traders. Memecoins on our radar $DOGE & $FLOKI in May.
Now the focus is on May.
With the market recovery, we plan to take stronger trades.
DM to join TWC Traders : t.me/Lstraderadmiin

LSTRADER@LSTraderCrypto
LSTRADER | April: just another week We managed the market’s upward move with strong charts and solid gains. Both Twitter and TWC Traders handled the process with discipline. No rush now. Stay patient for new opportunities. DM to join the channel: t.me/Lstraderadmiin
English
meduzzard retweetledi

meduzzard retweetledi

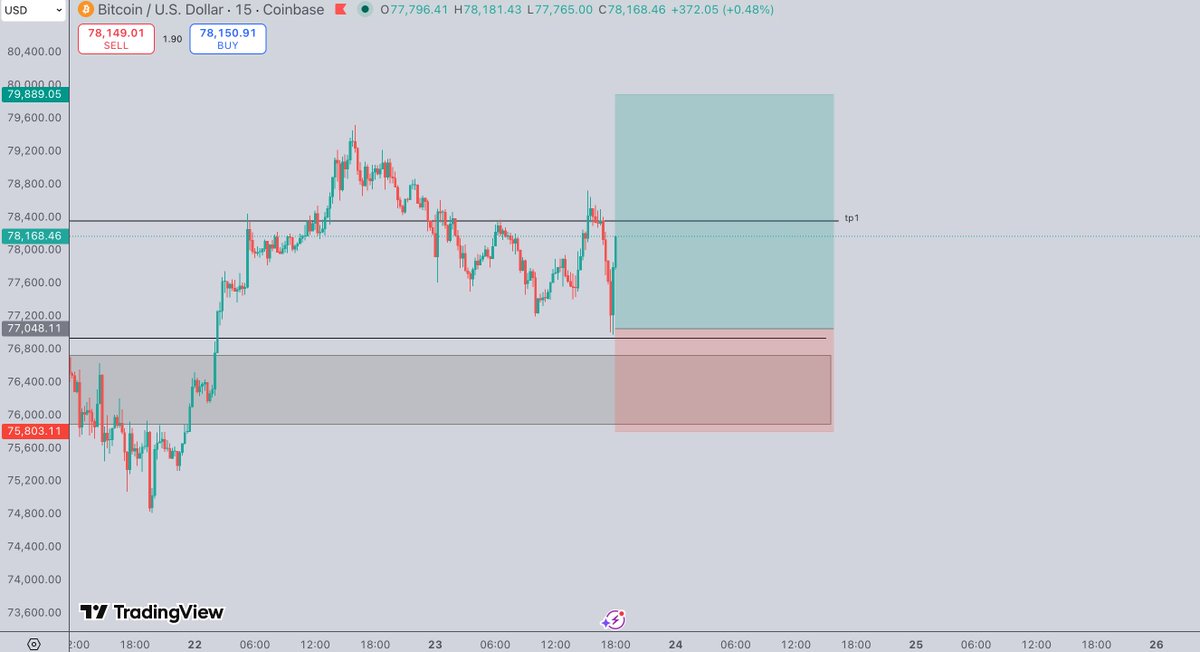
BANG! Quickly approaching tp1 and I locked in half profit for an instant 1.1k move 🔥
Gave you guys the pico bottom level yday longed it live and we V reversed minutes after
Elite execution for you guys. Hope you won
EZcharts@EZCharts_
Longed btc here as per has been the plan since yday Dip I shared played out perfectly and now close enough to my poi that I'm in Looking for new highs from here
English
meduzzard retweetledi
Educational — Strategy #1
0.75 Fib — The Only Retracement I Trust (using $FET chart for demo)
Over a decade in the market, and this is still the simplest + most consistent edge I’ve found.
Not 0.5
Not 0.618
0.75
Core Idea: After an impulsive move, price retraces.
• Most traders focus on the 0.618 (Golden Pocket)
• But in reality, price often goes deeper → into 0.75
• That’s where the real opportunity is.
— Why 0.75 Works
This level isn’t magic, it’s behavioral
• 0.618 traders enter early
• Price pushes deeper → stops them out
• Liquidity builds below
• Stronger players step in
• Price reverses from discomfort
0.75 = Maximum pain zone before continuation
— How I Trade It: I don’t blindly bid 0.75. It only works with context.
1. Identify the Impulse
• Clean displacement
• Clear BOS / MSS
• Volume expansion
2. Define the Range
• Swing Low → Swing High (or vice versa)
3. Wait for the Retracement
• No chasing
• Let price come into the 0.75 zone
4. Confluence is Key: The level alone is not the edge.
I combine it with:
• HTF S/R levels
• Range Highs / Range Lows
• RSI (reset / divergence)
• EMAs (trend alignment)
• Volume Profile (value zones)
Now, how I usually execute trades.
— Entry: Around 0.75
— SL: Below swing low / clear invalidation
— Target: Range highs / continuation
This strategy works on all timeframes but edge improves significantly on higher time frames like 1D / 3D / 1W
LTF → noise
HTF → cleaner reactions
— Reality Check—
Not a holy grail.
It will fail
It will get wicked
It can go deeper
But over a large sample size: It consistently offers better RR + cleaner entries than most retracement models
Bottom Line, Most traders try to enter early. I wait for:
• Discomfort
• Liquidity sweep
• Deep retracement
Then I act.
Simple > Complicated

English
meduzzard retweetledi


meduzzard retweetledi


meduzzard retweetledi

Thx for the play $EIGEN
this called perfection
EliZ@eliz883
$EIGEN nice spot here Invalidation very easy
English
meduzzard retweetledi
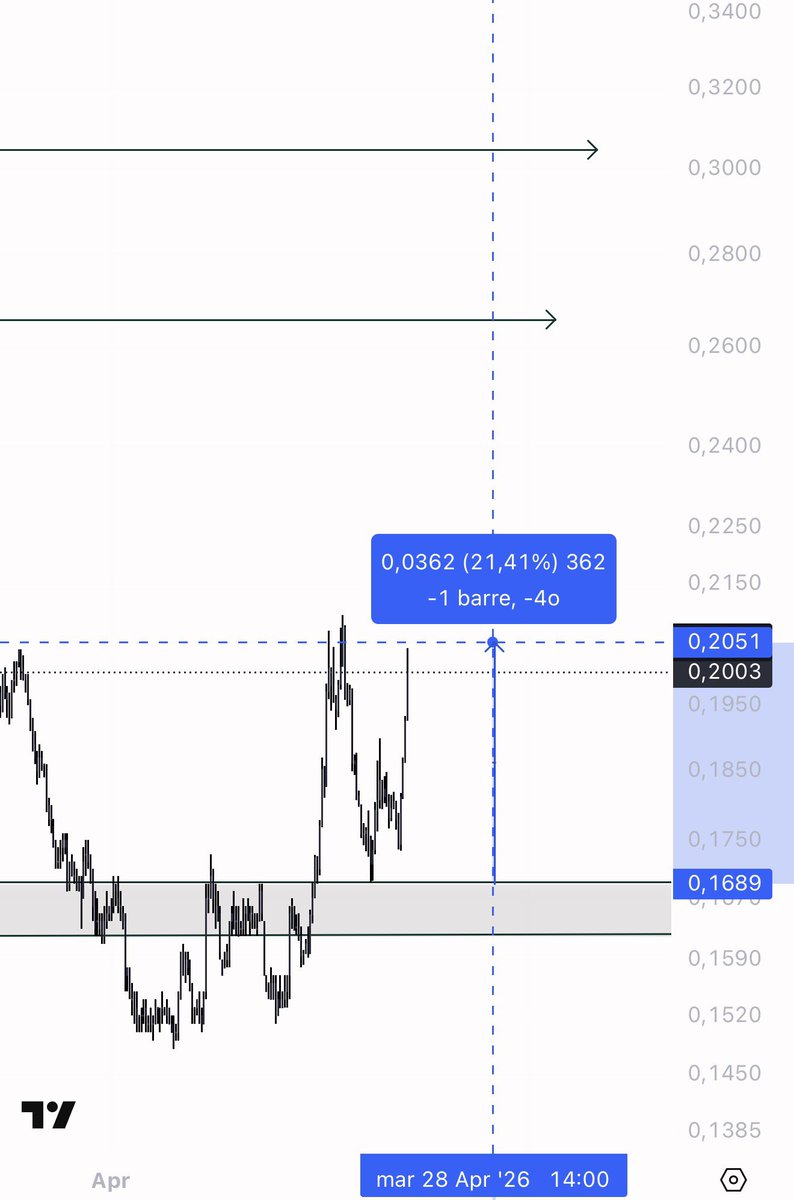
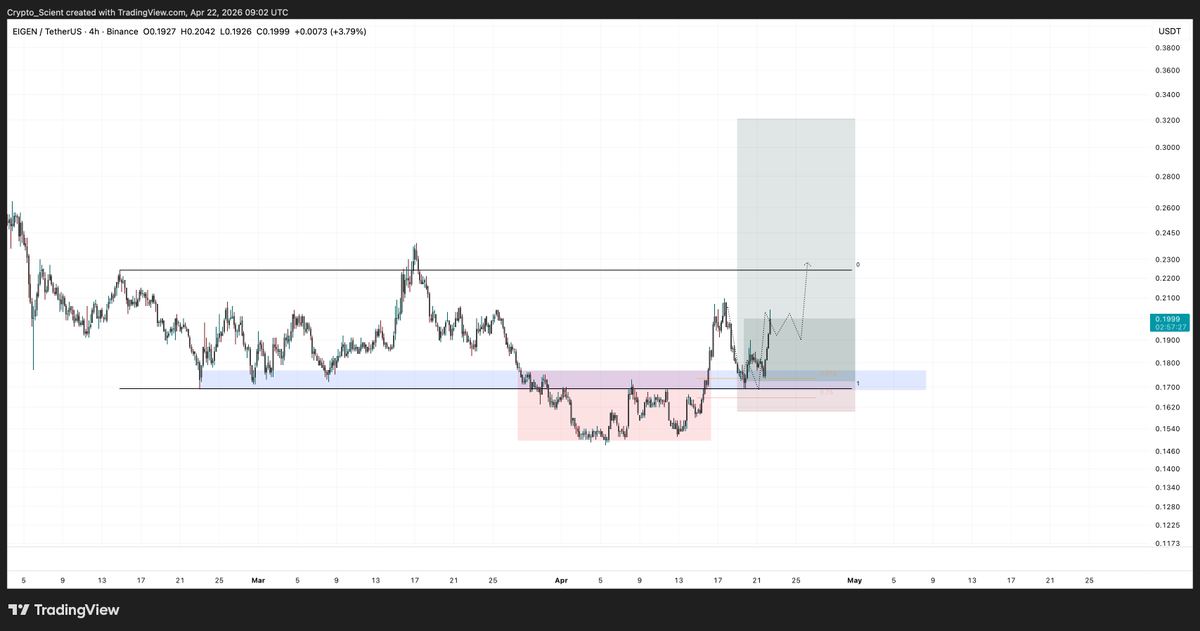
$EIGEN, Placed these limits well in advance. Shared the entry live here on X.
16% move.
A+ setup for a reason.
#EIGEN #EIGENUSDT
Scient@Crypto_Scient
$EIGEN, I am filled. This is an A+ setup for me. But...If this gets invalidated, it would mean the recent move was a fake strength, and new lows should come on the majority Altcoins and $ETH Lets see.
English
meduzzard retweetledi

$BTC
Before vs After 🎯
That's why you don't short a 10-week-long range breakout. It's an extremely simple market dynamic behavior.
Shorts here have just been fueling the move higher.
Don't be a liquidity provider! 🧠
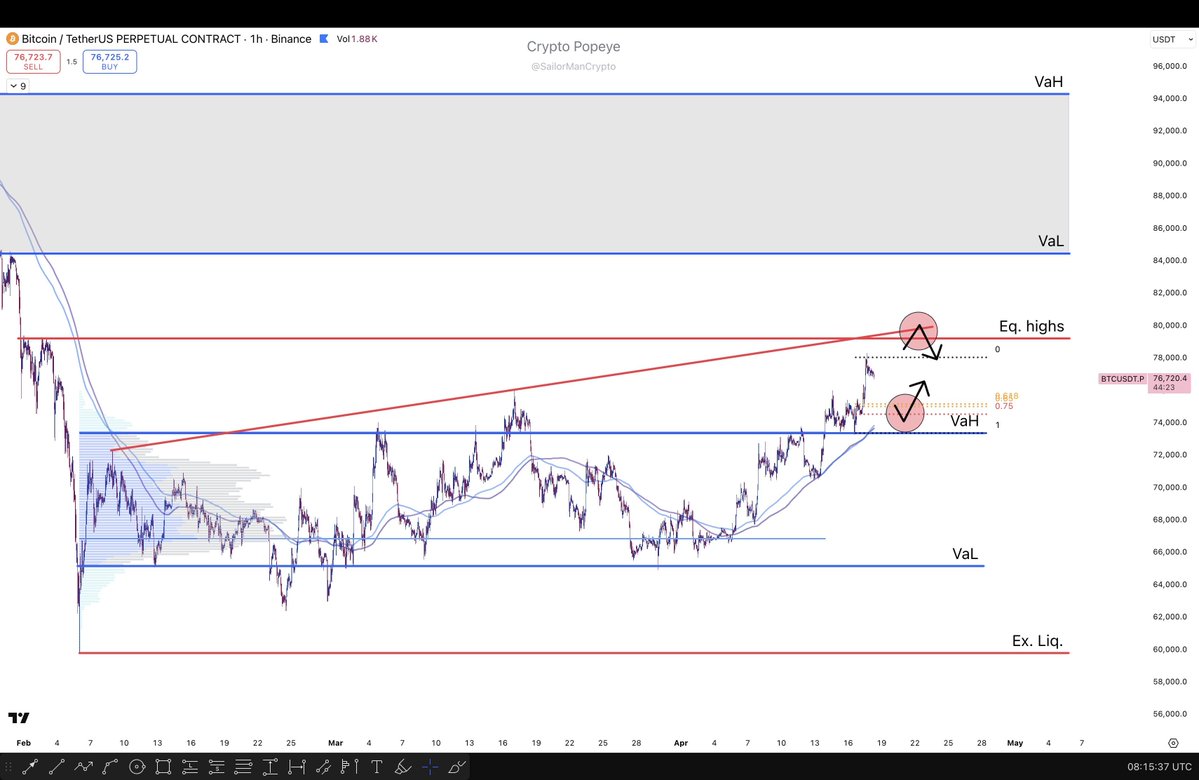

Popeye@SailorManCrypto
$BTC 1H - TP hit on this at 1.5R. Got lucky another time.... Whole process, reasoning, logic and exact trading process shared live and transparently as always.
English
@swisstrader09 @Crypto969456 straight facts swiss fuck them haters thank you for your work
English
@Crypto969456 made money and I thought i‘d share the fact with my community, as surely my community is happy for me, for a guy who‘s been sharing content on a regular basis since 3 years, right ?
English
meduzzard retweetledi
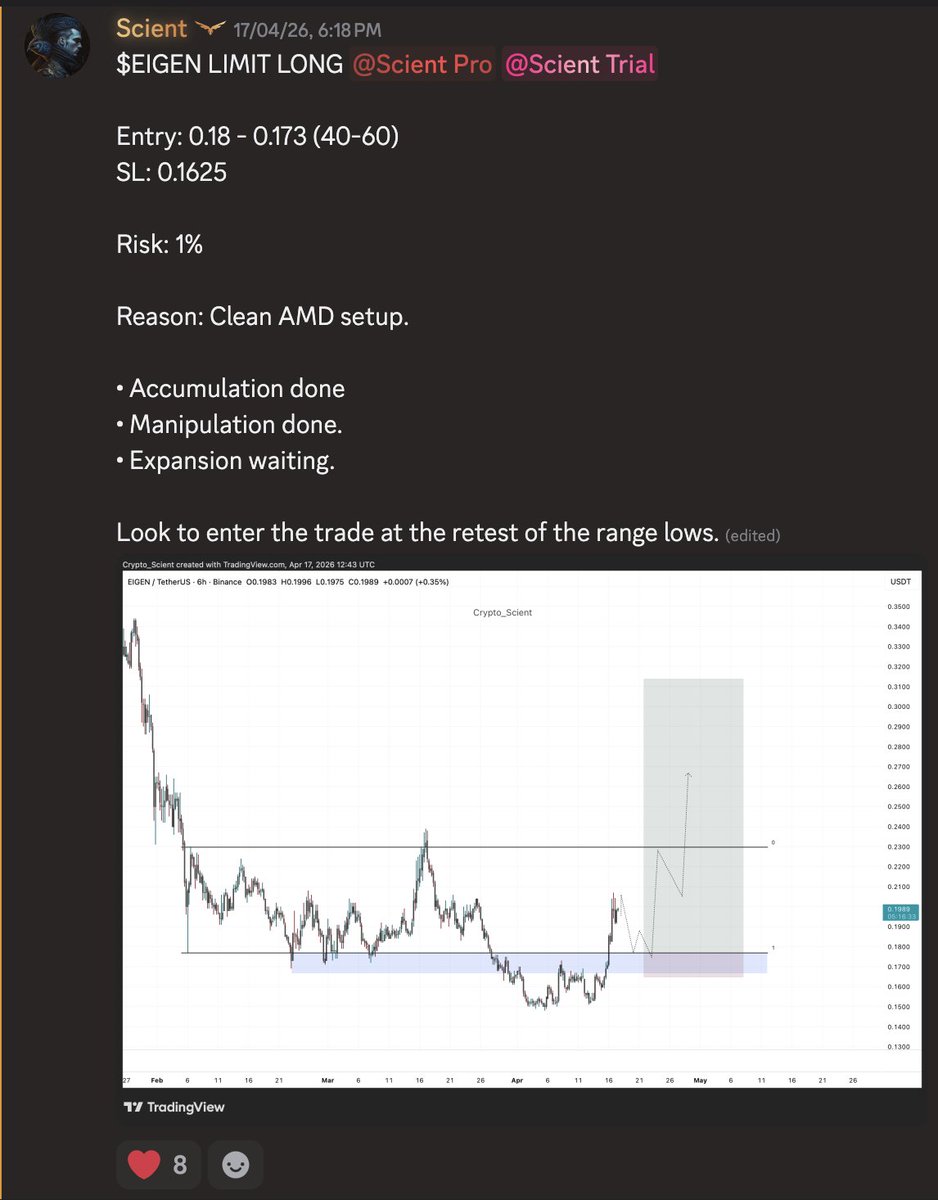
$EIGEN
Interesting structures forming across altcoins. Clean AMD on display.
This is exactly the type of structures you look for after a prolonged downtrend to signal a potential bottom (even if it’s just local)
• Wait for a retest of the range lows, aligning with daily demand + 4H FVG.
That’s where I look to enter.
Let’s see.
#EIGEN #EIGENUSDT

English
meduzzard retweetledi
#TOTAL2 attached chart speaks for itself. we nailed the last days, let's keep pushing 🔥

Swiss@swisstrader09
what do we think gang? #TOTAL2
English
@Crypto_Scient you think alts perform with either scenario? or would they dump as well if it rejects log resistance
English
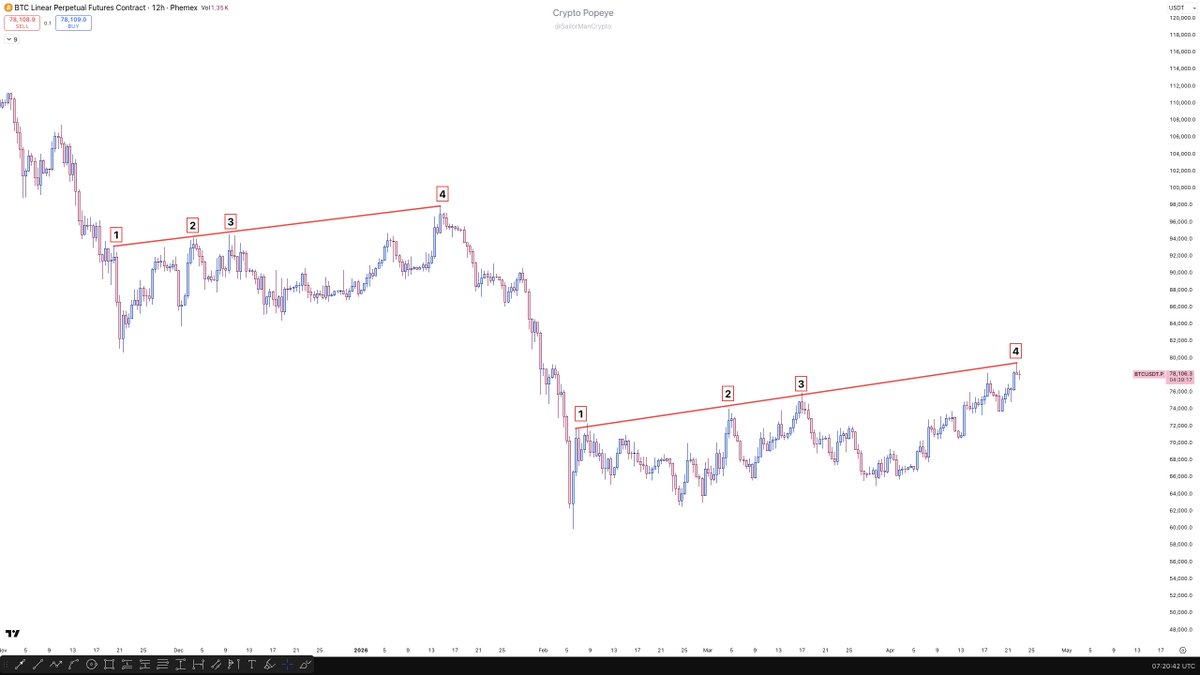
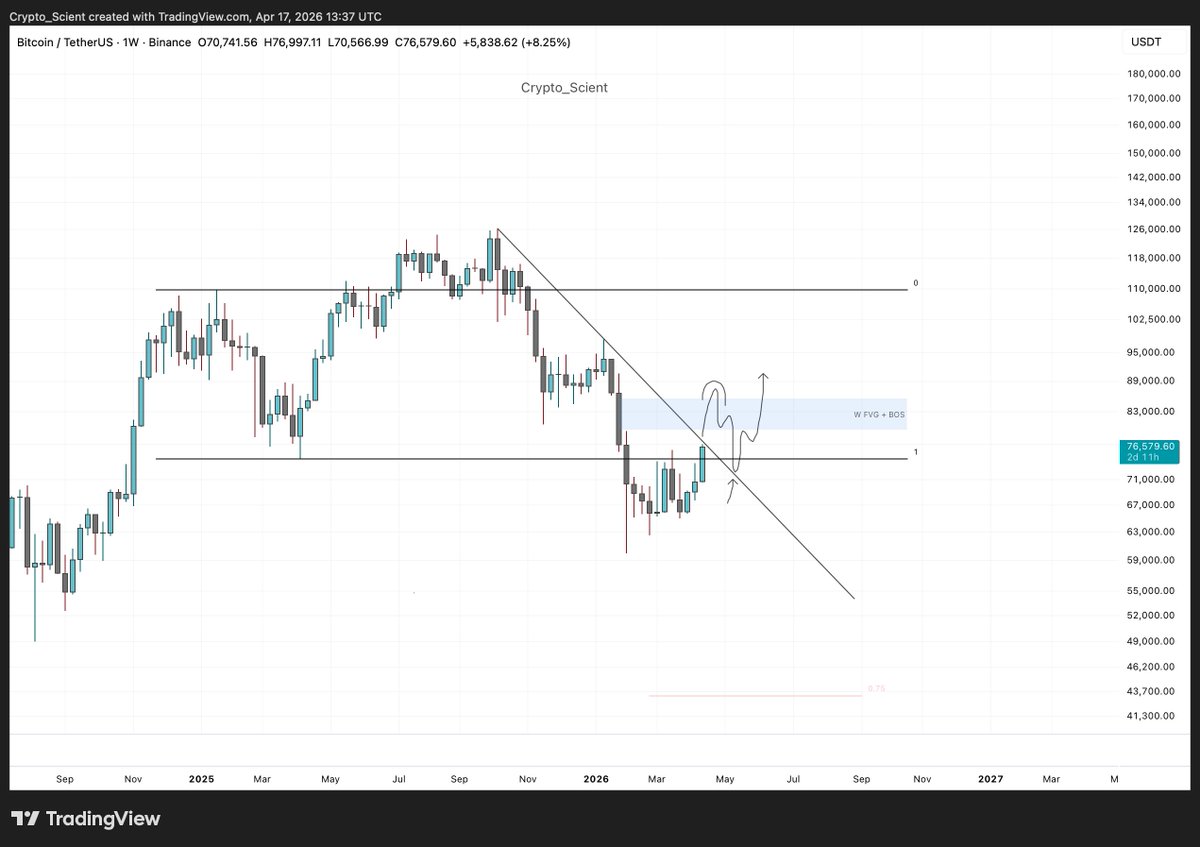
While altcoins are bouncing, most people will start ignoring the $BTC chart.
But the real question is, has BTC actually bottomed?
On the linear scale (right), the macro downtrend has already been broken on the 3D timeframe.
But on the log scale (left), BTC is now approaching a major confluence:
• Macro trend resistance
• Key weekly S/R around $74k
This is the real test.
A proper bottom confirmation would look like:
• Break above the macro log trend
• Reclaim and hold inside the $74k–$108k range
That’s when structure shifts.
If instead price rejects here and continues to stay below the log trend on the weekly, then we likely get a few weeks of altcoin strength…
…but BTC remains choppy and structurally weak.
Don’t ignore BTC while trading alts.
#BTC #BTCUSDT

English