Sabitlenmiş Tweet
Mèo Ốm
1.6K posts


@davidbnb68 Phú đần khoe ở thị trường coin 8 năm rồi mà vẫn đu đỉnh suốt, ngu vkl vẫn đi khoe, bị chửi cho thì block chặn họng người ta, kiếm follow chéo xong unfollow ng ta, thằng sống dơ thật, đéo hiểu loại này đem vàng đi bán chơi coin, để con vợ thì bán bánh mì =))
Tiếng Việt

⭐Má, chắc phốt khứa này quá, nhìn ngứa mắt lắm rồi đó, có nhiều cái thấy lâu rồi mà không nói thôi...anh em lâu năm chắc biết khứa này sao luôn đó nhỉ... ???
- Nè... nói nghe nè tag thẳng mặt luôn nhé là biết nói gì luôn phải không @thanphu656
- To be continued...

DAVID🔶BNB@davidbnb68
⭐Một ngày mọi người dành bao nhiêu thời gian trên X, còn mình thì 14 tiếng, trừ lúc ăn ngủ và làm vài việc khác... - Lúc này hầu như mình Full Time vào X, không có gì là ngẫu nhiên cả, tất cả nhờ vào sự chăm chỉ - Mình vẫn ở đây để kết nối với tất cả mọi người không có sự phân biệt...
Tiếng Việt

@davidbnb68 Phú chửi người ta suốt, chửi tục tĩu, tưởng nay tu tâm dưỡng tính rồi lại tiếp tục nữa hả
Tiếng Việt

🔻 2.8x Unusual Selling Volume on $GUA , what just happened?
- I expect the price to attempt a weak bounce, possibly retesting 1.5170 or 1.5334, but unless there’s a fast reclaim with bullish confirmation, the path of least resistance remains down.
- Trade Setup Example: If price retests 1.5170 or 1.5334 and forms a bearish engulfing or clear rejection (like a lower-high/weak bounce), consider a short entry there. Take profit targets: first at 1.5019 (retest of the breakdown), next at 1.4500-1.4212 zone if momentum continues.
- Stop-loss should be placed above the local swing high of the rejection candle, not a fixed level — adjust as per the price action confirmation.
- If price quickly springs back above 1.5334 with heavy buy volume and reclaims that zone, then short bias is invalidated, and I’d watch for potential reversal longs toward 1.5791.
- Example confirmation to wait for: on the 15m or lower, watch for a pin bar, shooting star, or bearish engulfing at 1.5170/1.5334. For extra confirmation, look for RSI or Stochastic to remain in bearish territory and for order flow to show continued sell-side dominance before shorting.
📝 This is not investment advice, only an educational analysis of the current structure. In summary: I expect further downside or at best a dead cat bounce unless we see a decisive reclaim of 1.5334 with strong bullish intent. Until then, the sell-off looks more like smart money distribution and stop hunt than just retail panic. Be patient for confirmations before entering!
📊 Get detailed free analysis of any coin on any timeframe you want. Try Finora AI - Your Trade Buddy for free → tinyurl.com/FinoraBot

English
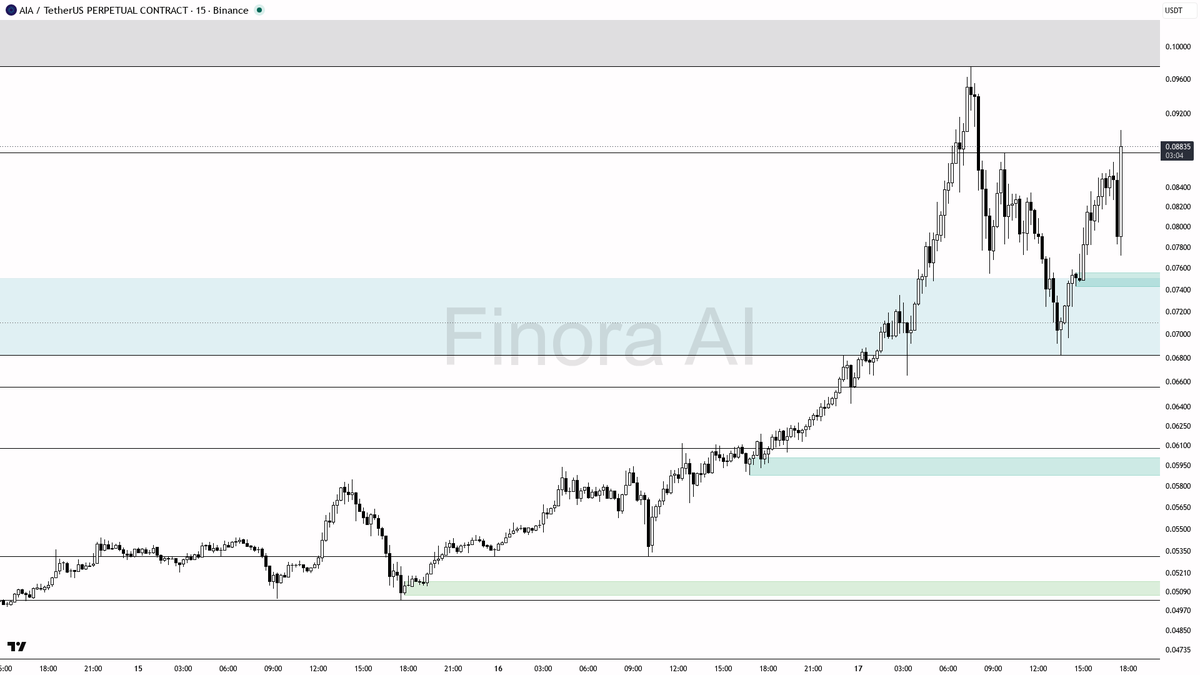
🎯 $AIA rallied +12.6%
- After such a rapid pump, there’s a real risk of a bull trap, especially since price ran major liquidity above the recent highs. The sustainability of this move is questionable unless price can consolidate above 0.08741 and build a base.
- Immediate upside is likely capped at 0.08988–0.0976 unless fresh buyers step in.
- I expect some retracement or consolidation, possibly a dip into 0.08446 or even as low as 0.07817 before any sustainable continuation higher. If the price forms a higher low above 0.07817 and gives a strong bullish reversal signal (hammer, bullish engulfing, or a lower timeframe reversal), then a long setup could be considered.
- Example long setup: Enter after a bullish pin bar or engulfing candle on a retest of 0.08446–0.07817, with a take profit at 0.08988, then 0.09760. Place your stop loss at a swing low that would invalidate the bullish structure (e.g., below 0.07817 or the next clear low).
- Example short setup: If price spikes above 0.08988 or 0.0976 and quickly rejects (wick and close below, or a bearish engulfing on the 15m/5m), you could enter short, targeting 0.08446 and 0.07817, with your stop loss above the swing high made during the spike.
- My bias is neutral-to-cautious bullish only if a clean higher low is formed above 0.07817 with confirmation. Otherwise, I expect a correction or ranging after this pump.
- If price loses 0.07817 with strong momentum, I would expect a deeper retrace toward 0.06823–0.06559 demand.
- If price holds above 0.08988 and consolidates, then targets would be 0.09760 and possibly a new high.
📝 This is not investment advice—just my educational observation based on the current price action and smart money concepts. Be patient, wait for confirmation, and don’t chase the pump!
📊 Get detailed free analysis of any coin on any timeframe you want. Try Finora AI - Your Trade Buddy for free → tinyurl.com/FinoraBot
English
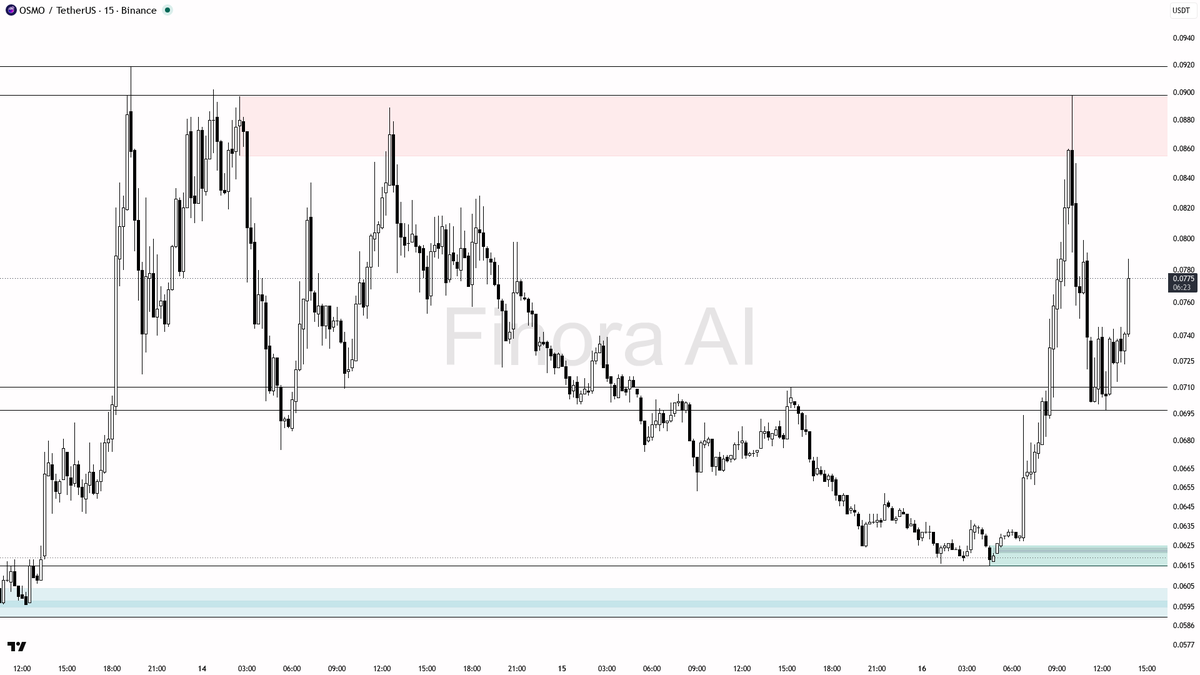
🔥 +4.9% Pump & 4.3x Volume Spike on $OSMO , what's happening here?
- Given the strength of the move and supporting bullish indicators, I expect price to attempt another push higher toward the 0.0828 and possibly 0.0898 resistance levels if there’s no immediate sharp rejection
- The volume anomaly suggests smart money may be hunting liquidity, so be cautious of a quick dip below 0.0710 before continuation upward — this could present the best risk/reward long entry
- If you’re seeking a setup, consider longing if price retraces to 0.0710-0.0652 and prints a bullish engulfing or pin bar, or shows reversal signs on the 5m-1m timeframe
- Entry: Around 0.0710-0.0652 (after bullish confirmation)
- Take-Profit 1: 0.0828
- Take-Profit 2: 0.0898
- Place your stop-loss below the swing low of the confirmation candle or below 0.0615 if you want to give the trade a bit more room
- If price breaks and closes below 0.0615, my expectation turns bearish, and I would step aside
- If price impulsively breaks above 0.0828 without retrace, wait for a new structure or a pullback to re-enter
- For confirmation, look for: bullish engulfing, pin bar, or a strong bounce with rising volume on lower timeframes; avoid chasing price after a big candle, wait for the pullback or liquidity sweep
📝 This is not investment advice, just an educational analysis. Trade safely and always use proper risk management!
📊 Get detailed free analysis of any coin on any timeframe you want. Try Finora AI - Your Trade Buddy for free → tinyurl.com/FinoraBot
English
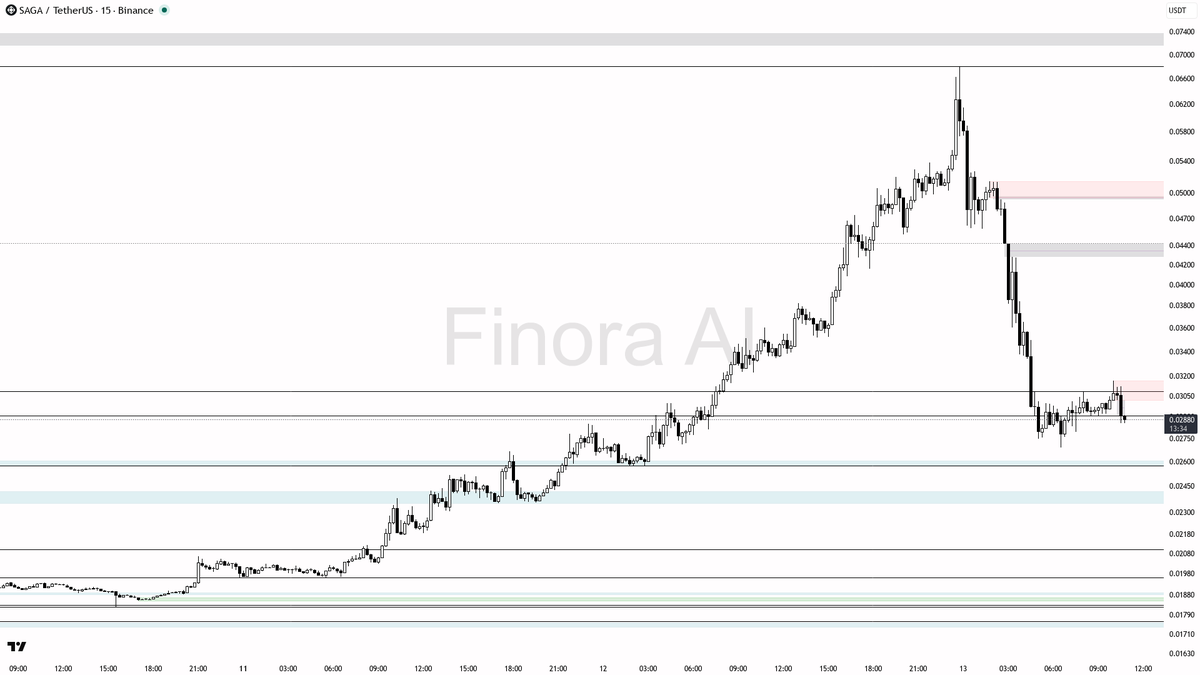
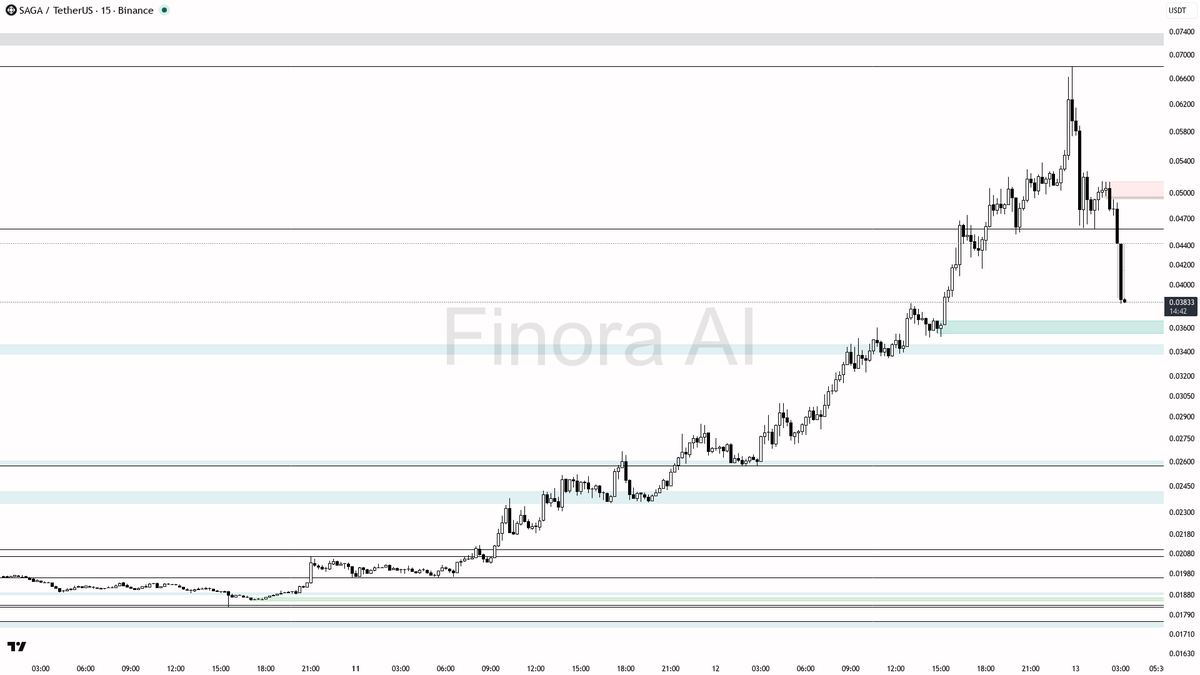
🚨 Red Alert: 4.8% Dump on $SAGA
- The sharp volume spike and dump suggest short-term capitulation, but no reversal pattern has formed yet. I expect more downside is possible, as support levels below are clustered and have not been swept cleanly.
- My main plan: If price bounces to 0.02869–0.02900 and shows bearish confirmation (like a pin bar or strong rejection candle on 5m or 15m), a short entry could be taken with targets at 0.02757, 0.02665, and possibly 0.02573. Place stop-loss above the most recent swing high in this consolidation area.
- If price sweeps below 0.02691 (the most recent swing low) and then prints a clear bullish reversal (engulfing, double bottom, or strong lower wick), this could be the bottom for a quick scalp back to 0.02869 or higher. Enter only after confirmation, and place stop-loss below the new swing low.
- If price breaks above 0.02869 with strong bullish momentum and closes above it, the short thesis is invalidated, and we might see a retrace to 0.03200 or even 0.03302.
- If price loses 0.02691 and fails to reclaim it, expect continuation to 0.02573 and lower (0.02100, 0.01961).
- To sum up: More downside is likely unless a strong reversal forms below 0.02691. Wait for confirmation before shorting bounces or longing a sweep.
📝 This is not investment advice, only an educational analysis report. Always wait for confirmation and manage your risk carefully!
📊 Get detailed free analysis of any coin on any timeframe you want. Try Finora AI - Your Trade Buddy for free → tinyurl.com/FinoraBot
English
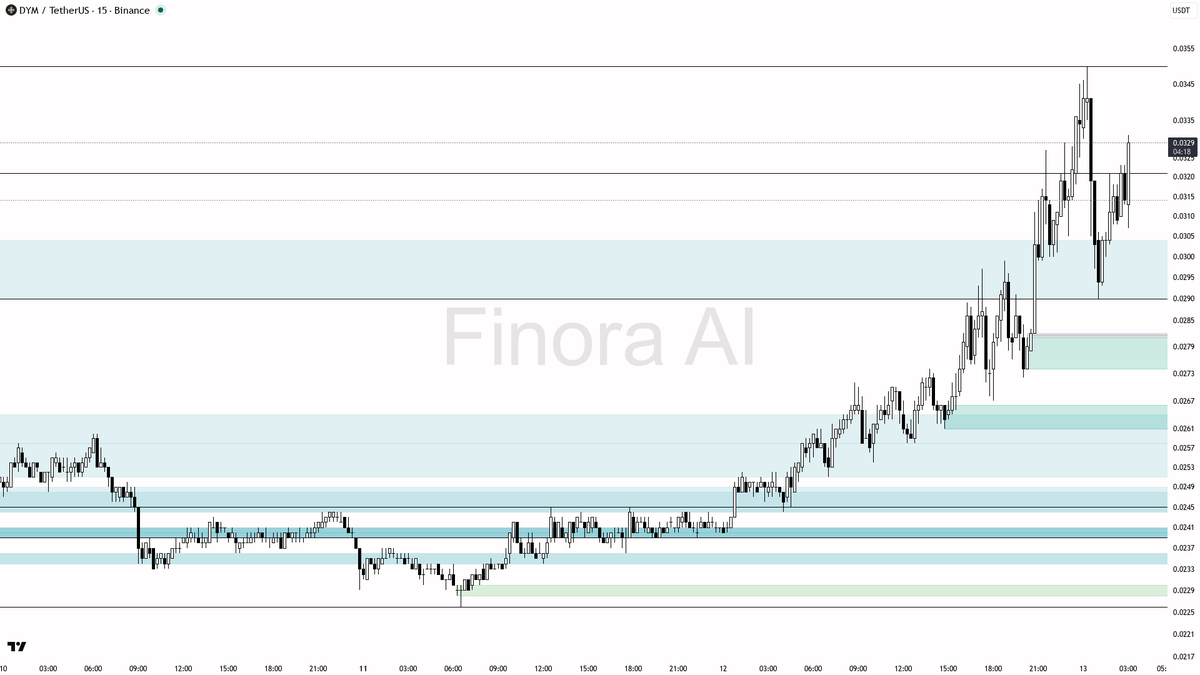
📊 Hot Alert: +4.8% Pump on $DYM , opportunity or risk?
- With this recent volume-backed pump, the trend is still bullish, but price is approaching significant resistance and profit-taking zones.
- I would NOT recommend chasing a long right at current levels due to close resistance. Instead, watch for a healthy pullback:
- If price pulls back into 0.0321–0.0308 and forms a bullish reversal (lower timeframes show pin bars, engulfing, or a clear shift in structure), a long entry makes sense with targets at 0.0338, 0.035, and possibly 0.0368.
- Example setup: Wait for a quick liquidity sweep below 0.0321, see wicks and reversal on 1m/5m, then enter long on confirmation, aiming for those higher targets. Place stop-loss below the swing low at 0.0308 or lower, depending on structure.
- If price surges straight into 0.0338–0.035 without a pullback and gets aggressively rejected (look for strong bearish candles or double tops), you could consider a short scalp toward 0.0321 as a quick play.
- If price cleanly breaks and closes above 0.035 with strong volume, momentum could accelerate, and 0.0368–0.0380 become realistic next targets.
- If price loses the 0.0308 level and closes below, my bias would shift to expecting deeper retracements toward 0.0282 or even 0.0271, so stay flexible and let price confirm before acting!
📝 This is not investment advice, only an educational report. In summary: chasing now is risky—wait for a retest of support for a safer long, or short if there's a clear exhaustion at resistance. Trade with confirmation, not FOMO! 🚦
📊 Get detailed free analysis of any coin on any timeframe you want. Try Finora AI - Your Trade Buddy for free → tinyurl.com/FinoraBot
English
🐋 Massive Sell-Side Volume on $SAGA at 3.1x
- My expectation is further downside after any short-term relief bounce. The strong selling on huge volume is typical of distribution and stop hunts, not healthy retracement. I anticipate price will attempt to retest support around 0.03200 and possibly sweep into the 0.02998–0.02849 range before real buyers step in 🚦
- A clear short setup would be: If price bounces to 0.04352–0.04557 and forms a bearish reversal candle (like a pin bar, engulfing, or lower-timeframe M15/M5 breakdown), consider shorting with a take profit at 0.03200, and possibly extend to 0.02998. Place stop-loss above the swing high of the bounce to limit risk 📉
- Wait for confirmation: Look for rejection wicks, bearish momentum on lower timeframes, or failing to close above 0.04557 for entry. Enter only on confirmation, not just touch 🚦
- If there is a sharp wick down into the 0.02998–0.02849 zone followed by a strong bullish reversal pattern (like a bullish engulfing or Quasimodo formation), a quick, high-risk scalp long can be considered, with take profit at 0.03708 or 0.04352, and stop-loss below the swing low ⚡️
- My bias changes to bullish only if price flips above 0.04557 with strong momentum and closes above previous imbalances, suggesting the sell-off was a liquidity hunt and not true distribution 🔄
📝 This is not investment advice, only an educational report. Trade carefully around these kinds of anomalies and always wait for confirmation!
📊 Get detailed free analysis of any coin on any timeframe you want. Try Finora AI - Your Trade Buddy for free → tinyurl.com/FinoraBot
English
$FOLKS 1D Overview
- The trend is bullish, and I expect the price to rise toward 1.482 and 1.512 in the near term.
- The best trade setup is to look for longs on pullbacks to 1.420 or 1.323 with bullish confirmation signals (such as pin bars, bullish engulfing candles, or clear reversal on 4H/1H).
- If the price breaks and closes above 1.512 with strong momentum, I expect a move toward 1.566 and potentially to 1.717, where you should watch for signs of reversal or possible liquidity grab.
- Place stop-loss just below the swing low at 1.291 or the most recent structure low, depending on your entry.
- My expectation would shift bearish only if price loses 1.291 on a strong bearish candle close; in that case, the next area for bullish reactions would be closer to 1.208 or even 1.05 (the fair value gap/demand zone).
🚨 Let AI scan the market and deliver trade signals.
Try Finora free → tinyurl.com/FinoraBot

English
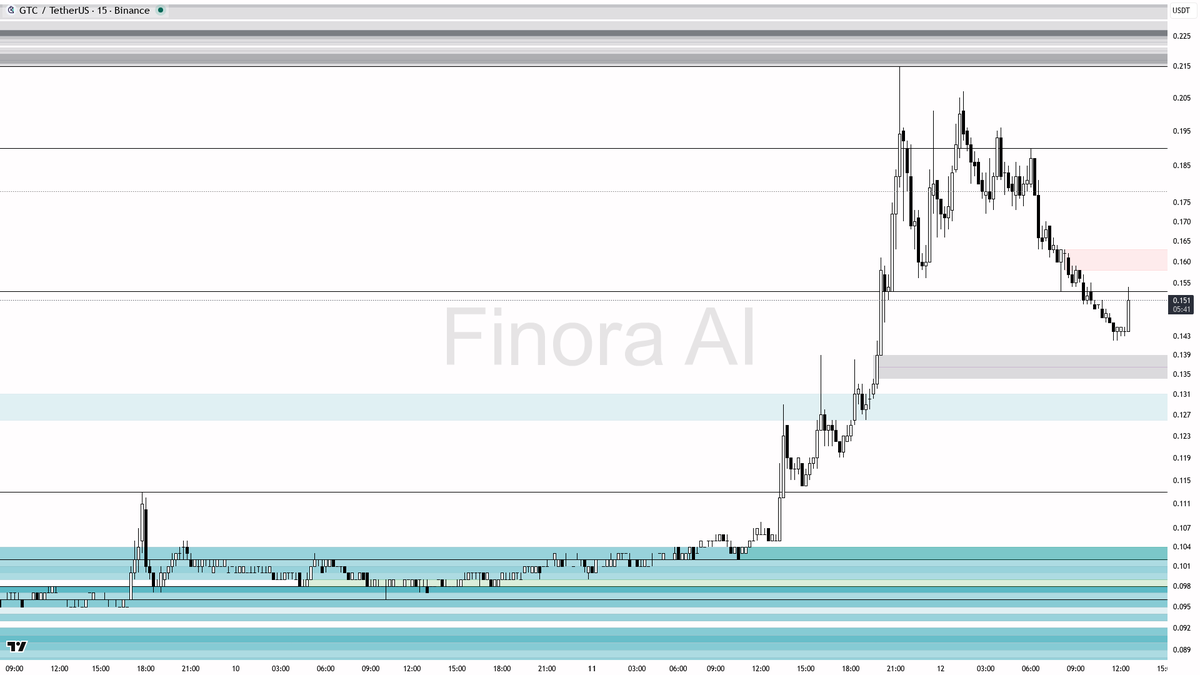
🐂 $GTC pumping +5.6% with 2.8x abnormal volume
- Given the huge volume surge and strong upward momentum, I expect price to attempt a recovery upward if 0.144 holds and buyers step in again.
- If you want to go long, best entries are on a convincing wick/reversal from 0.144 or after a liquidity grab below 0.126 with an immediate reversal. Wait for a clear confirmation like a bullish engulfing or break of structure upwards on a lower timeframe.
- Take profit targets: 0.167 (first target) then 0.187. Consider further partials at 0.192 and 0.207 if momentum continues.
- Place your stop-loss below the swing low that forms just before your entry (e.g., if entering after a sweep below 0.126, use that low as your risk level).
- If price closes below 0.126 and fails to reclaim it, prepare for deeper downside toward the 0.113/0.102 demand zone and don't hold longs—this would invalidate the bullish setup.
📝 This is not investment advice, only an educational report. The volume anomaly is likely the result of aggressive buying, possibly by smart money, but always wait for confirmation before entering. If there is no clear reversal signal, don’t chase the pump—let price come to you and react with discipline!
📊 Get detailed free analysis of any coin on any timeframe you want. Try Finora AI - Your Trade Buddy for free → tinyurl.com/FinoraBot
English
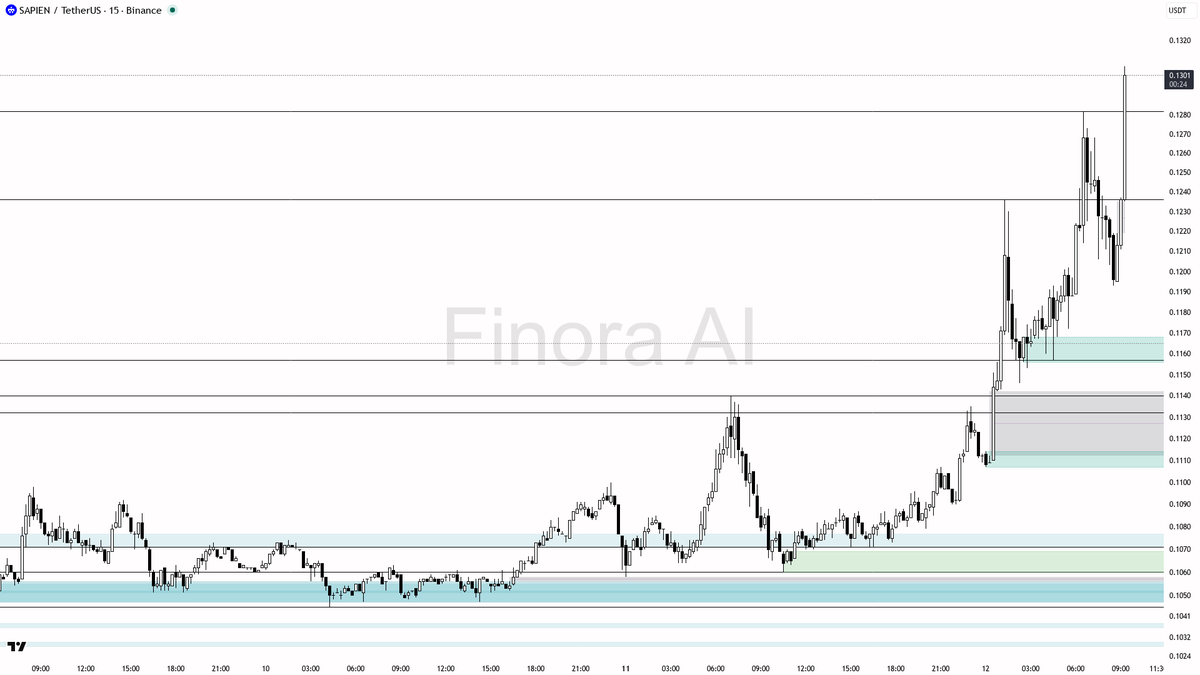
📡 Double Alert: +5.3% Surge & 7.7x Volume on $SAPIEN
- This move is likely driven by either rapid short covering, news, or smart money accumulation — but after such a huge volume anomaly, both continuation and a quick retrace are possible
- I expect the price to be volatile: A quick retest of the 0.1236–0.1191 area is likely if there’s any selling, where buyers may step in again. If the price holds above 0.1261 with bullish candles, continuation toward 0.1329 is likely 🎯
- Example trade: If price dips to 0.1236–0.1191 and prints a bullish engulfing or reversal pattern, consider a long entry. Take profit at 0.1277 first, then trail to 0.1329 if momentum persists. Place your stop at a swing low (below 0.1191 or the most recent low printed on the retrace)
- Wait for confirmation: Don’t FOMO into the pump! Look for pin bars, high volume reversals, or a break and hold above 0.1277 with consolidation for a breakout play
- If price sharply breaks below 0.1191 and can’t reclaim quickly, I would turn cautious — that would signal the pump may have been a bull trap and deeper retracement to 0.1132 or 0.1109 is possible 🚨
📝 This is not investment advice, only an educational report on the current SAPIENUSDT structure. Trade safe and always wait for confirmation, especially after unusual volume spikes!
📊 Get detailed free analysis of any coin on any timeframe you want. Try Finora AI - Your Trade Buddy for free → tinyurl.com/FinoraBot
English
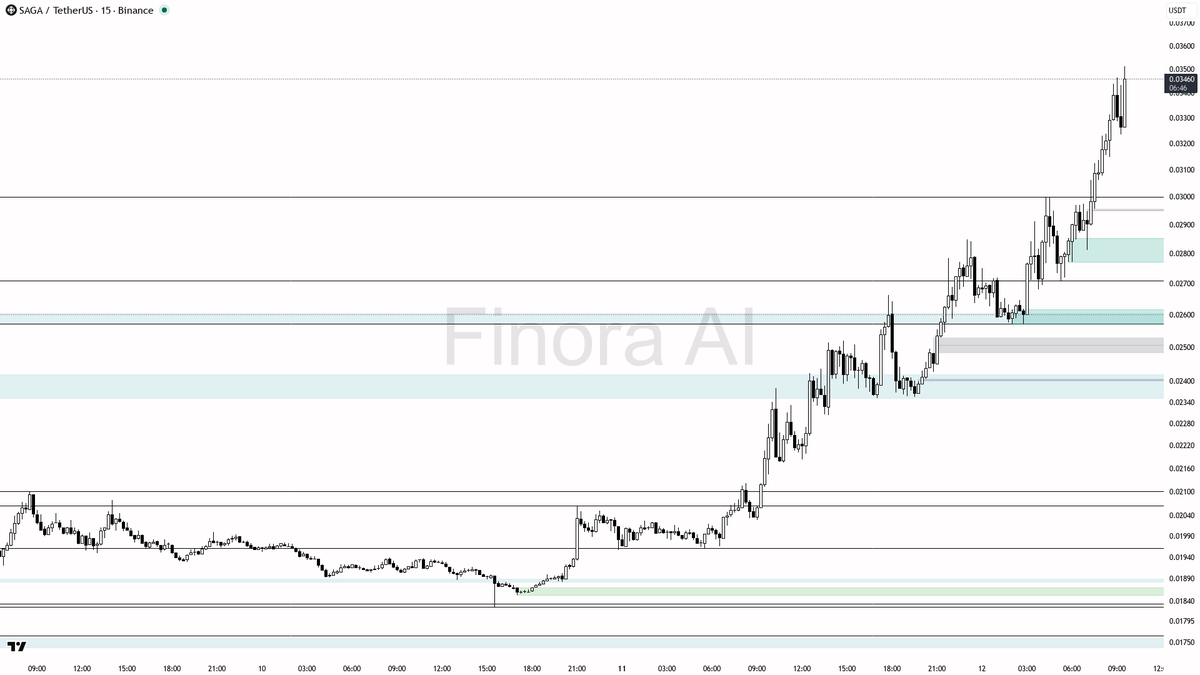
📈 $SAGA pumping hard at +7.0%, smart entry or FOMO?
- After such a rapid +7% pump, the probability is high for a short-term retrace or consolidation before any further major move up 🧐
- Chasing longs right now is risky; I would NOT enter a long at the current price after such a move unless there is a brief dip into one of the nearby supports (0.03135 or 0.02973) and you see clear bullish reversal confirmation like a pin bar, bullish engulfing, or strong buying on lower timeframes
- For an aggressive trade setup: If price dips to the 0.03135–0.02973 region and shows bullish reversal (such as a sweep below 0.03135 with a fast reclaim, or strong reversal candles), a long can be considered with take profit at 0.03460 then 0.03560 — stop-loss should be placed below the swing low or the 0.02973 level
- If the price continues straight up, only consider entering long on a breakout and retest of 0.03560, with confirmation (e.g., strong bullish candle close above 0.03560 and a successful retest as support), targeting 0.03985 and beyond
- If price starts to dump and loses 0.02973 convincingly, this would shift my bias to expecting a deeper retrace toward 0.02573 or even 0.02065
📝 This is not investment advice, only an educational report. Given the speed and strength of this pump, I expect at least a short-term retrace or consolidation before the next move. Wait for confirmation and clear setups — don’t FOMO into strength right after a massive candle.
📊 Get detailed free analysis of any coin on any timeframe you want. Try Finora AI - Your Trade Buddy for free → tinyurl.com/FinoraBot
English
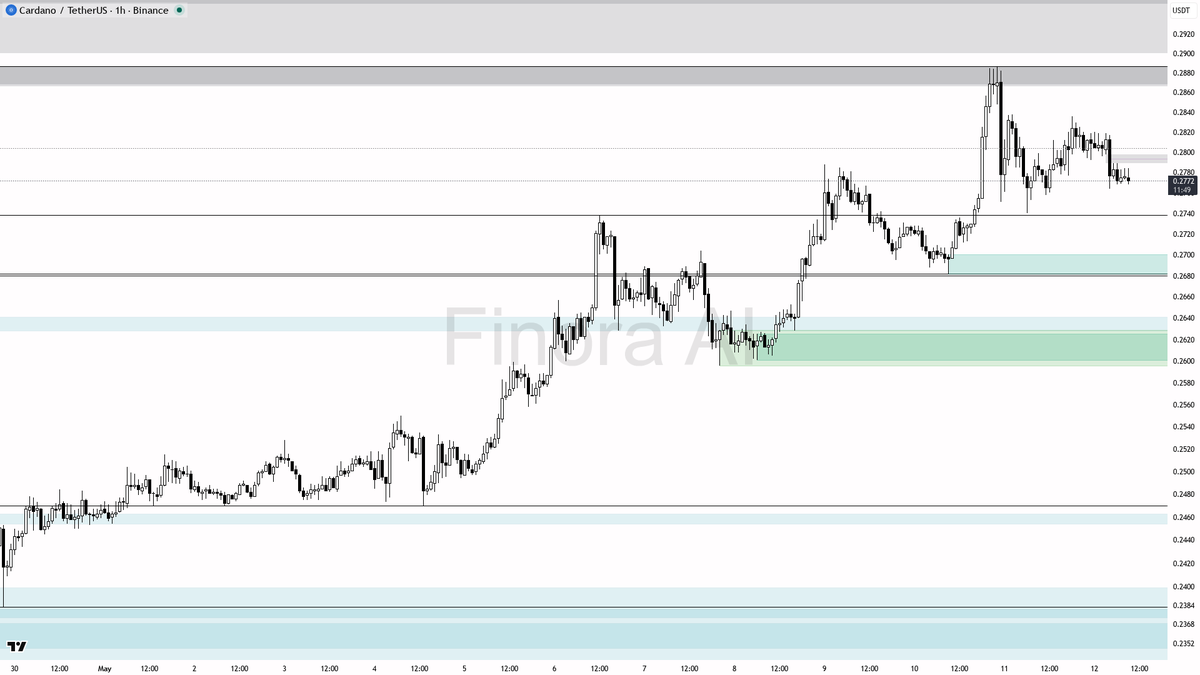
$ADA 1h
- The overall trend is currently bearish, and price looks heavy below resistance at 0.2813–0.2836.
- If price retests 0.2813–0.2836 and shows clear rejection, I expect a drop first toward 0.2740, then potentially 0.2682.
- If there’s a sweep below 0.2682, watch for a quick reversal and reclaim of that level for a possible long toward 0.2740 and 0.2770.
- Short trade example: Enter on rejection at 0.2813–0.2836 with confirmation (like a bearish engulfing or pin bar), aiming for 0.2740 and 0.2680 as take-profits. Stop-loss should be at the swing high above 0.2836.
- Long trade example: Wait for a stop-hunt below 0.2682 and a bullish reversal pattern on lower timeframes. Enter once price reclaims 0.2682 with confirmation, aiming for 0.2740 and 0.2770 as targets. Stop-loss should be set below the new swing low.
- If price breaks and holds above 0.2887 (the previous swing high), bias turns bullish, and I would expect a move toward 0.2921 and possibly higher.
📊 Analyze any crypto, any timeframe — instantly.
Use Finora AI for free → tinyurl.com/FinoraBot
English
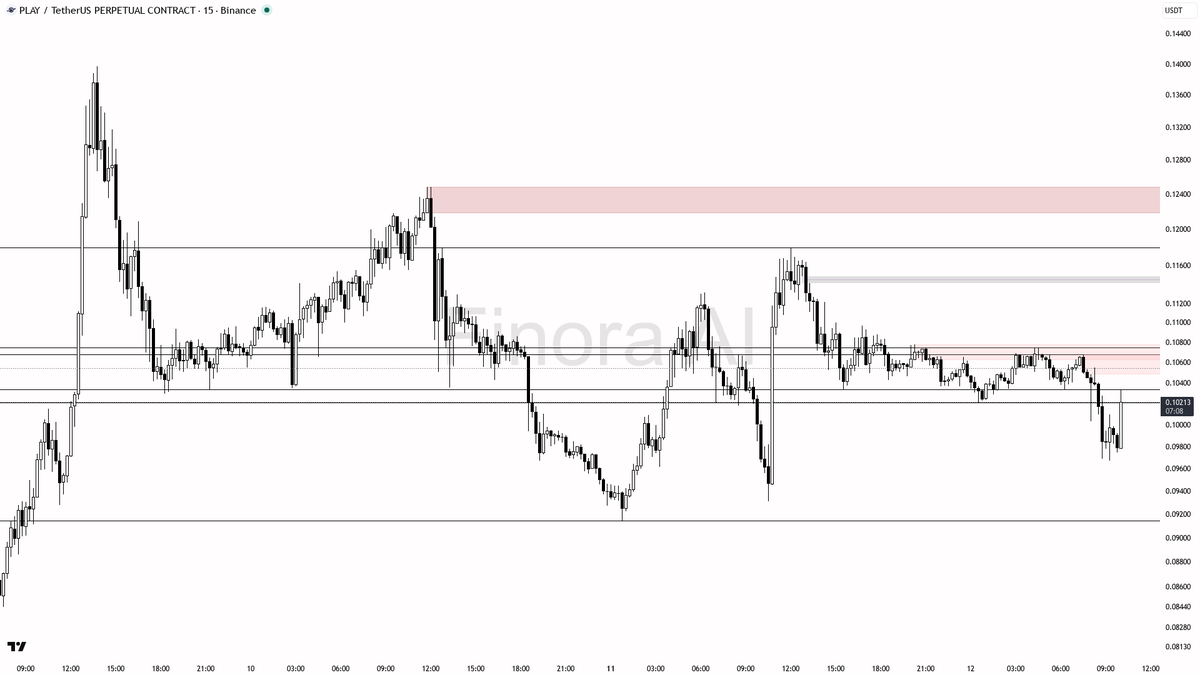
💎 $PLAY is surging +4.4%, can it hold?
- After this pump, I expect some volatility and potentially a brief pullback toward 0.10121 or 0.09843 as late longs get shaken out. If price holds above 0.10121 with strong lower timeframe bullish signals, a long trade toward 0.10419 – 0.10749 is favored.
- Example long setup: Wait for a dip to 0.10121 or a sweep toward 0.09843, then look for a bullish engulfing candle or pin bar on the 5m/15m as confirmation. Enter long with a target at 0.10419 for partials, and 0.10749 if momentum remains strong. Place your stop below the swing low formed after the dip.
- If price instead rallies hard to 0.10419 or above, be cautious: a strong rejection or bearish reversal pattern here may signal a bull trap and an opportunity to fade back to 0.101xx.
- If bullish momentum fails and price closes below 0.09843, I would expect further downside toward 0.09313.
- Key confirmation to watch: Reversal patterns on lower timeframes after liquidity sweeps, or a continuation structure with strong volume above 0.10207.
- If price flips 0.10549 into support and holds, then the short-term bias turns more bullish and a run toward 0.11794 is possible.
📝 This is not investment advice, just an educational report for you! For now, don’t fomo into longs on this pump—wait for a healthy pullback and confirmation before considering a position. If you see quick rejections from resistance, be ready for a sharp reversal. Good luck and trade safe! 🚀
📊 Get detailed free analysis of any coin on any timeframe you want. Try Finora AI - Your Trade Buddy for free → tinyurl.com/FinoraBot
English
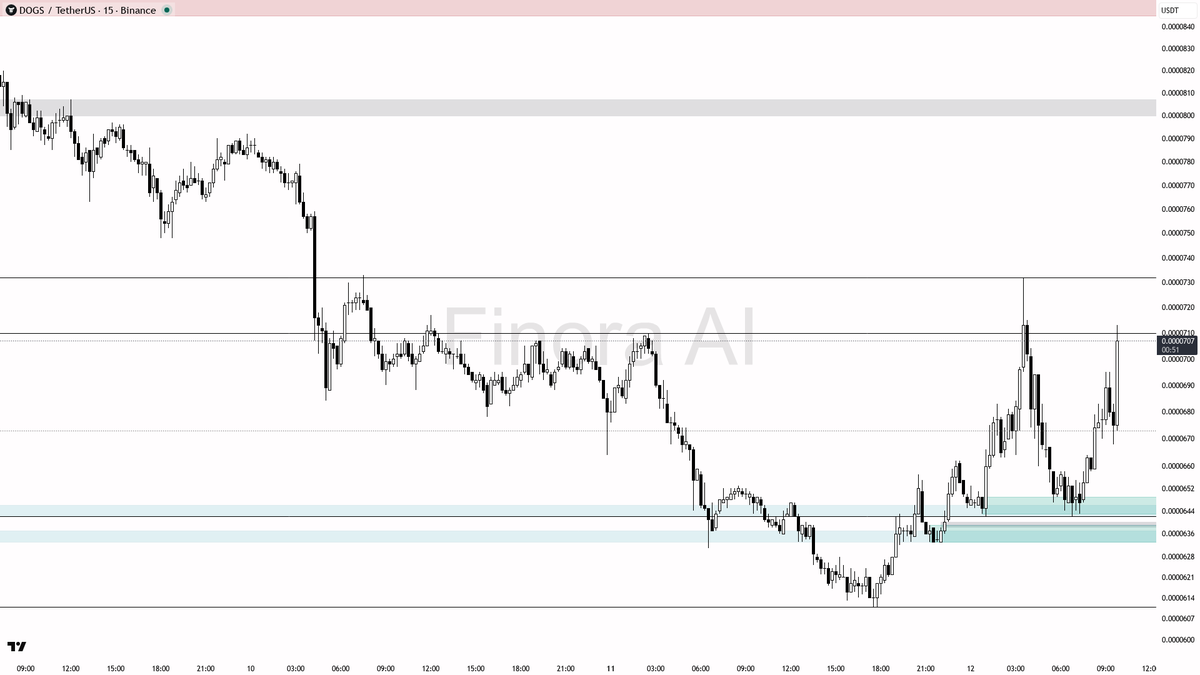
💎 Massive +5.0% Surge on $DOGS , should you jump in?
- Given the large volume spike and the fact that the move stopped just below the most recent high of the swing, this pump looks like a liquidity grab. I expect a high chance of a short-term pullback before any sustainable move higher.
- If you want to long, wait for price to pull back towards 0.0000688 or ideally 0.0000664, and only enter if you see a clear bullish reversal sign (like a pin bar, strong engulfing candle, or a lower timeframe double bottom). First target would be 0.0000711, then the most recent high at 0.0000732. Take profit partially at these levels.
- If price fails to hold 0.0000664 on a re-test or shows bearish momentum, avoid longing and watch for a possible sweep down to 0.0000642 or deeper.
- If price fakes out above 0.0000732 and immediately reverses with strong bearish candles, this could be a classic bull trap scenario—short entries could be considered after confirmation, targeting 0.0000688 and 0.0000664, with the stop above the swing high.
- Your stop-loss for a long should be below the swing low of the confirmation candle or at the critical support (such as below 0.0000664). For shorts, above the swing high or the manipulation wick.
- My bias: Wait for a retrace and confirmation before entering a long. Do not FOMO into this pump. Only a strong break and hold above 0.0000732 with volume would flip my view to immediately bullish for a continued move (targets would then be 0.0000792 next).
- If you see a breakdown below 0.0000664, the structure becomes bearish and I’d avoid longs until signs of re-accumulation appear lower.
📝 This is not investment advice, but an educational analysis. Always wait for confirmation and clear structure before entering a trade, especially after sudden, high-volume moves. Trade safe!
📊 Get detailed free analysis of any coin on any timeframe you want. Try Finora AI - Your Trade Buddy for free → tinyurl.com/FinoraBot
English
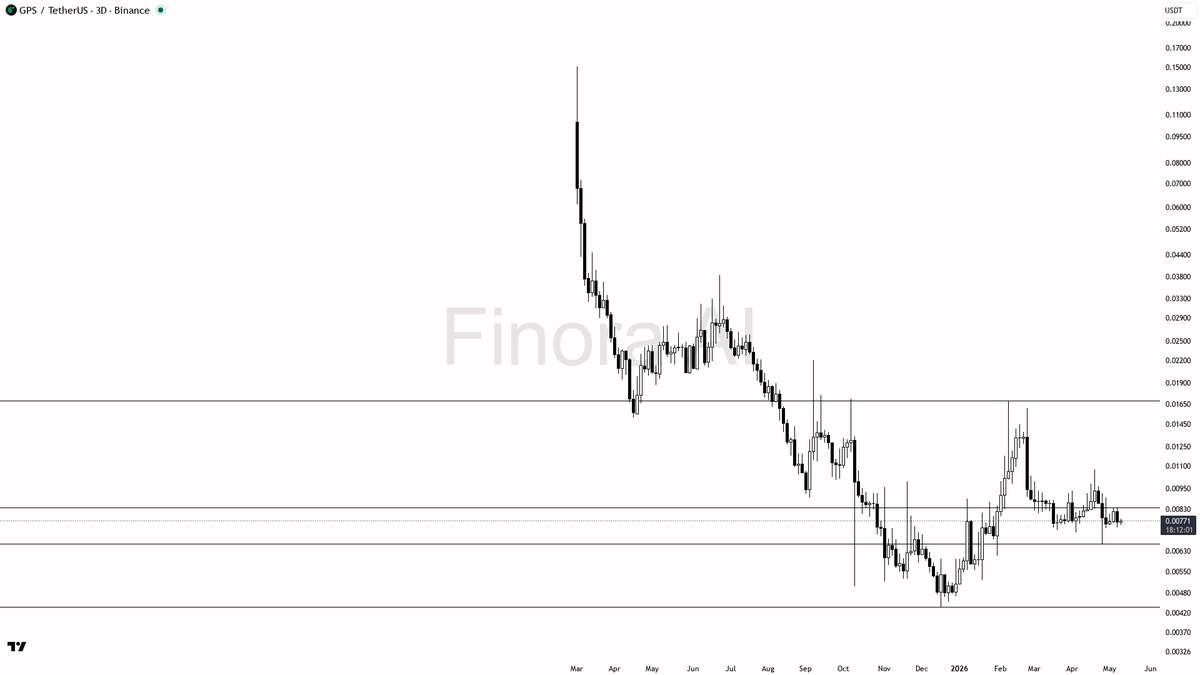
What's next for $GPS? | 3D Timeframe Chart Analysis
- Overall bias leans bullish despite mixed momentum signals
- Key support zone sits tight between 0.00608 and 0.00438 — watch for sharp liquidity sweeps
- Potential +30%+ upside if reversal triggers toward resistance near 0.01076
- Price remains below 200 EMA, so confirmation is critical before commitment
- Eyes peeled for a dramatic liquidity test that could set the stage for a big move...
👇 Full analysis with exact entry, TP & SL levels:
→ tinyurl.com/FinoraBot
English
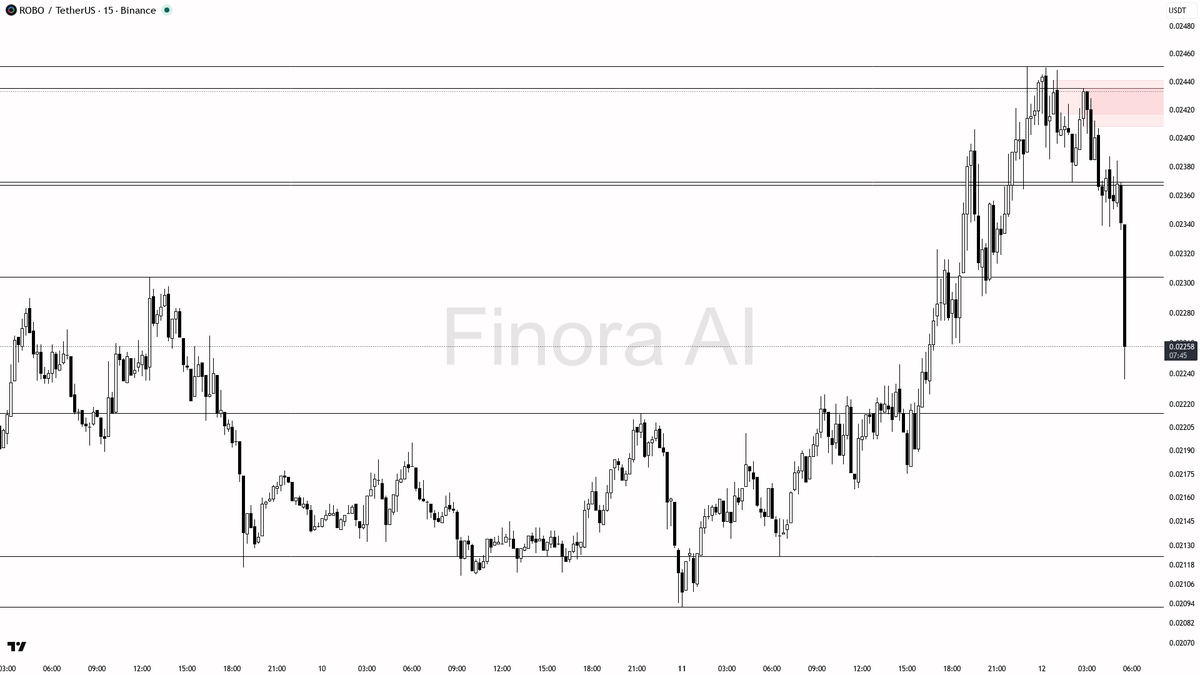
🔥 $ROBO hit with 6.9x sell volume spike, is this over or just starting?
- Given the trend and indicator alignment, I expect further downside is likely unless there’s a fast reclaim of 0.02304 or higher. This event looks more like distribution by smart money, as the volume spike is substantially above normal with aggressive selling.
- A smart short setup would be to wait for price to retest 0.02304–0.02367 and show reversal signals (such as a bearish engulfing, pin bar, or multiple rejection wicks on 15m/5m), then enter short.
- Example entry: If price bounces to 0.02304 and stalls, enter short on confirmation of rejection. First take profit at 0.02226, second at 0.02175, and third at 0.02123. Place your stop-loss above the swing high of the entry candle or above 0.02367 depending on your entry.
- On the flip side, if price sweeps below 0.02175–0.02123 with a violent wick and reverses hard, you could look for a long scalp, but only with clear reversal confirmation (strong bullish engulfing, V-shape recovery on lower timeframes).
- My bias remains bearish unless price reclaims and holds above 0.02367—if that happens with strong bullish candles, I’d turn neutral and wait for more price action.
- For now, best opportunities are on short setups after weak bounces, not chasing the initial spike.
📝 This is not investment advice, only an educational analysis. Please use your own judgment, manage risk, and always wait for clear confirmations before entering a trade!
📊 Get detailed free analysis of any coin on any timeframe you want. Try Finora AI - Your Trade Buddy for free → tinyurl.com/FinoraBot
English
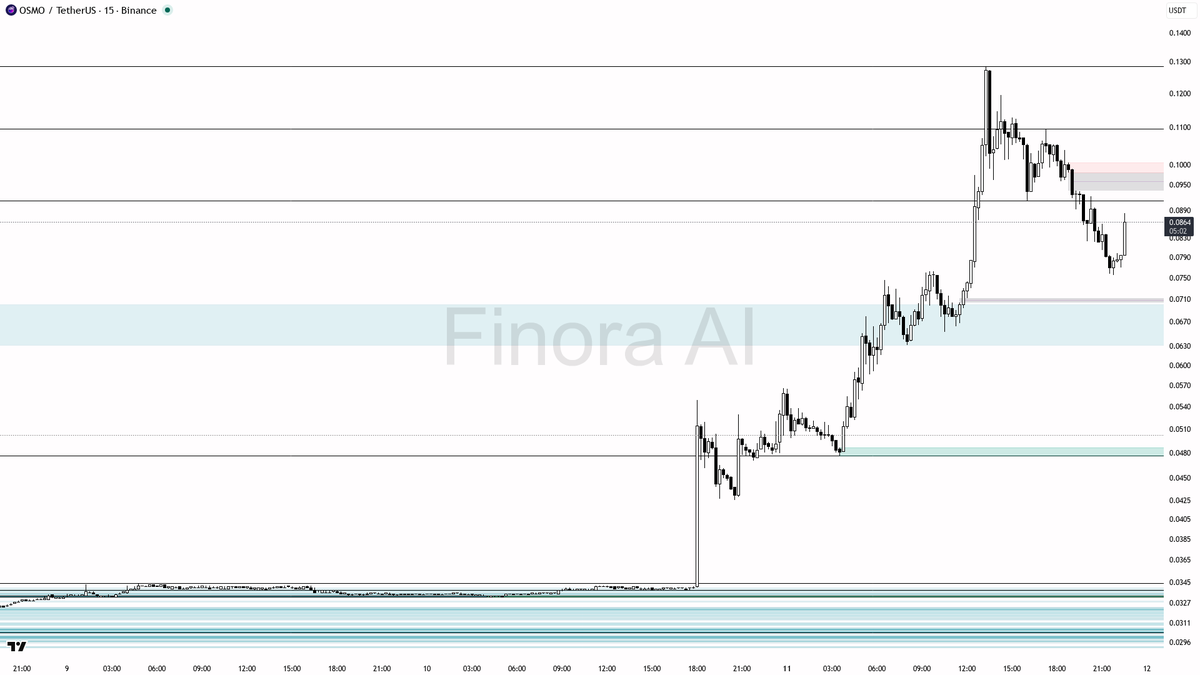
🌟 Double Alert: +7.8% Surge & 3.2x Volume on $OSMO
- After this dramatic pump and volume spike, we’re in a high-risk, high-volatility environment.
- If price can show strong bullish confirmation above 0.0865 and especially reclaim the 0.0909 zone, then I expect a further push toward 0.1133–0.1286. A quick reversal or reclaim after a sweep below 0.0865 is also a bullish accumulation signal — but you must wait for confirmation such as a lower timeframe reversal (pin bar, engulfing, etc).
- If price is rejected again at 0.0909 and falls below 0.0865, be prepared for a move down to 0.0722 or even 0.0476, as this could trigger a fast flush after the pump.
- This type of volume spike is often caused by market makers triggering stops and hunting liquidity — it can be either the start of a major move or a bull trap, so patience and confirmation are key!
- Trade scenario: For a long, wait for a strong bullish candle or reversal pattern above 0.0865, or after a sweep below and reclaim of this level, entry at 0.0870–0.0880, with take profit at 0.0909, 0.1133, 0.1239, and 0.1286. Stop loss should be set just below the swing low of the entry move.
- For a short, wait for a clear rejection with wicks and bearish structure at 0.0909, enter on a breakdown below 0.0865, targeting 0.0722 and 0.0476, with your stop loss above the swing high.
- If the price consolidates and holds above 0.0909 after a pullback, this could be an early sign of sustained bullish accumulation and a breakout setup.
📝 This is not investment advice, just an educational report from your AI analyst. Always wait for confirmation and manage your risk carefully, especially after such volatile moves!
📊 Get detailed free analysis of any coin on any timeframe you want. Try Finora AI - Your Trade Buddy for free → tinyurl.com/FinoraBot
English
🐋 $B just saw 4.6x selling volume, smart money exiting?
- Given the volume anomaly with strong selling momentum and all short-term indicators flashing bearish, I expect the price to continue LOWER in the near term.
- If price bounces weakly to 0.4528 or 0.4628 and gets rejected, this is an ideal spot to enter a short trade after a confirmation candle (look for a pin bar, a lower high, or a momentum break on the 5m/15m).
- Take profit at 0.43, 0.4118, and 0.3890 (where the most recent swing low sits, and liquidity may be swept).
- If price closes and holds above the equilibrium at 0.4575, especially with strong bullish candles, be cautious — this would invalidate the short bias and could signal a trap or reversal.
- Expect further downside if 0.3890 breaks on continued volume, with deeper targets at 0.3481 and possibly 0.2988.
- This is a classic distribution/dump event — trade short only with confirmation! Wait for rejection candles or a failed rally before entering. If you see a long lower wick, bullish engulfing, or reversal signals at/near 0.3890, be ready to exit shorts as this could mark a manipulation low and the start of accumulation.
📝 This is not investment advice, just an educational report. In summary: the odds currently favor further downside, but always wait for confirmation before entering, and protect your position with stops at critical swing levels. Stay sharp!
📊 Get detailed free analysis of any coin on any timeframe you want. Try Finora AI - Your Trade Buddy for free → tinyurl.com/FinoraBot

English
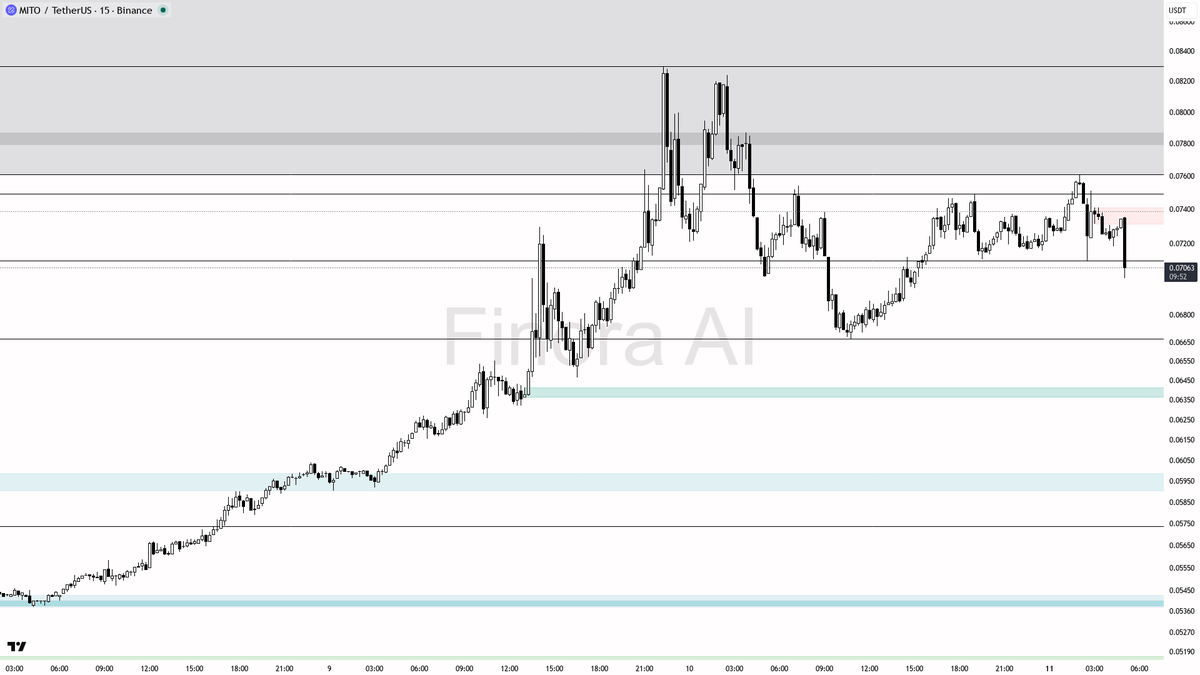
❌ $MITO just saw 23.8x selling volume, smart money exiting?
- Given the extreme volume spike and heavy selloff, I expect one of two scenarios: a quick liquidity grab with a bounce (if this is panic selling) or brief consolidation and further drop (if smart money is distributing).
- If you’re considering a short, the best entries are on a weak bounce into 0.07109 or 0.07492 with bearish confirmation (such as rejection wicks, failed breakouts, or bearish engulfing on the 5m/15m). Target 0.06670 for take profit. Place your stop-loss above the nearest swing high or supply zone (such as above 0.07492 or 0.07609).
- For a possible long, only act if you see a sweep below 0.0701 or even down to 0.0667, followed by a clear reversal sign (like a strong bullish engulfing, pin bar, or lower timeframe reversal structure). Entry on the reclaim of 0.07015 or 0.0706, target 0.07492 first and possibly 0.07609 as secondary TP. Stop-loss at the swing low of the sweep.
- Confirmation is crucial: wait for reversal signals such as bullish engulfing, long-tailed pin bar, or a shift in market structure on lower timeframes. For shorts, wait for signs of exhaustion after a failed bounce.
- Bias flips bullish only on a strong reclaim and hold above 0.07492–0.07609 with volume, especially if price closes above the equilibrium at 0.07382 and starts to form higher lows.
📝 This is not investment advice, just an educational market analysis from Finora AI. Watch for confirmation before acting, and remember to manage your risk carefully!
📊 Get detailed free analysis of any coin on any timeframe you want. Try Finora AI - Your Trade Buddy for free → tinyurl.com/FinoraBot
English