Karan
59 posts


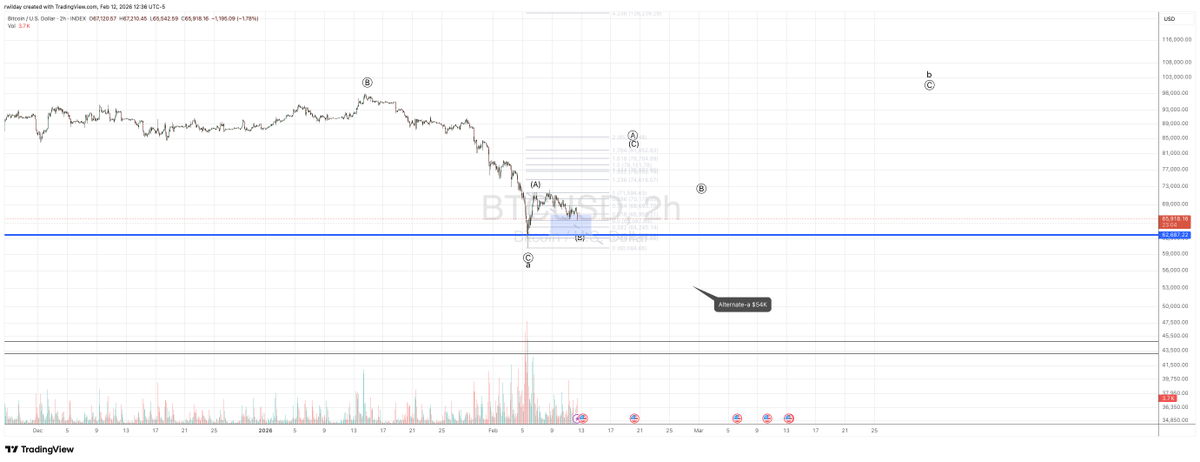
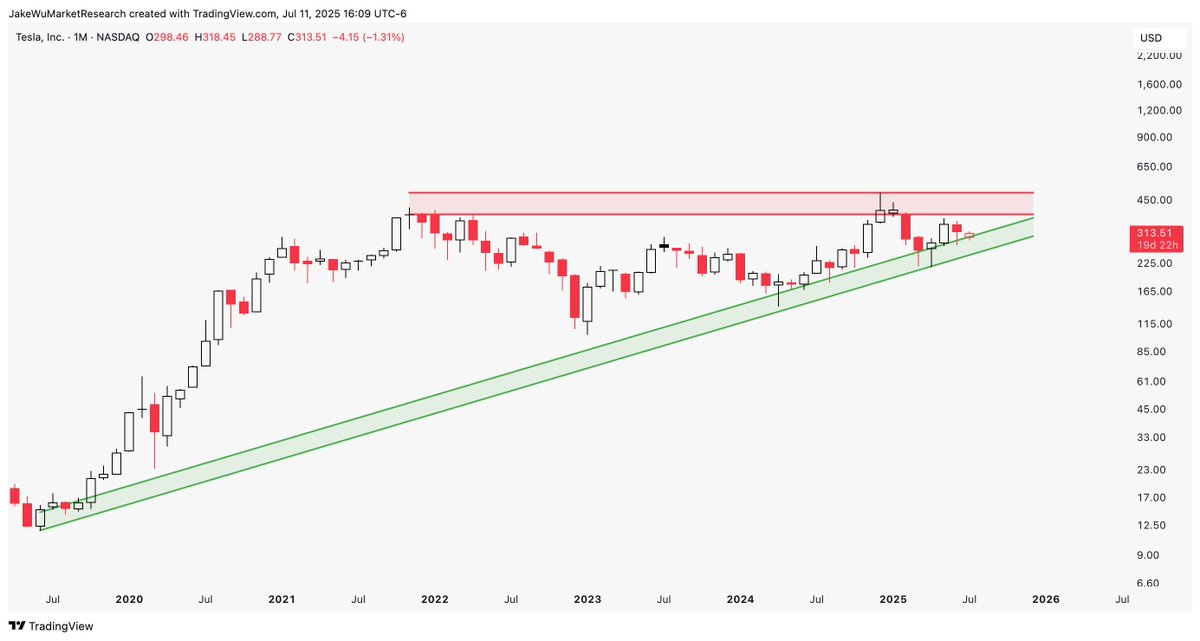
@mickybahl One month range that can break upward or downward at this point. In other words, I don't have anything with high probability at the moment.
English

BREAKING: My OPTIONS Selling Trading University Completed
5 Courses + Scanners + Indicators NO CHARGE
Comment " ME " and I will sent it directly on your DM
English
Karan retweetledi

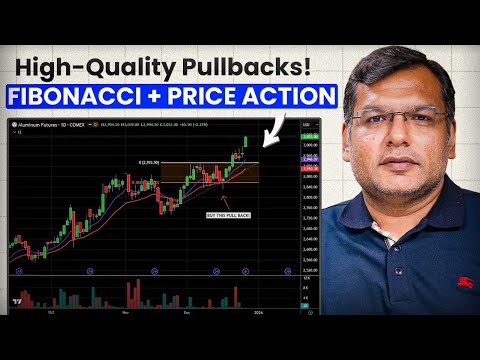
Watch here 👉 youtu.be/O8Tdru_J-Es
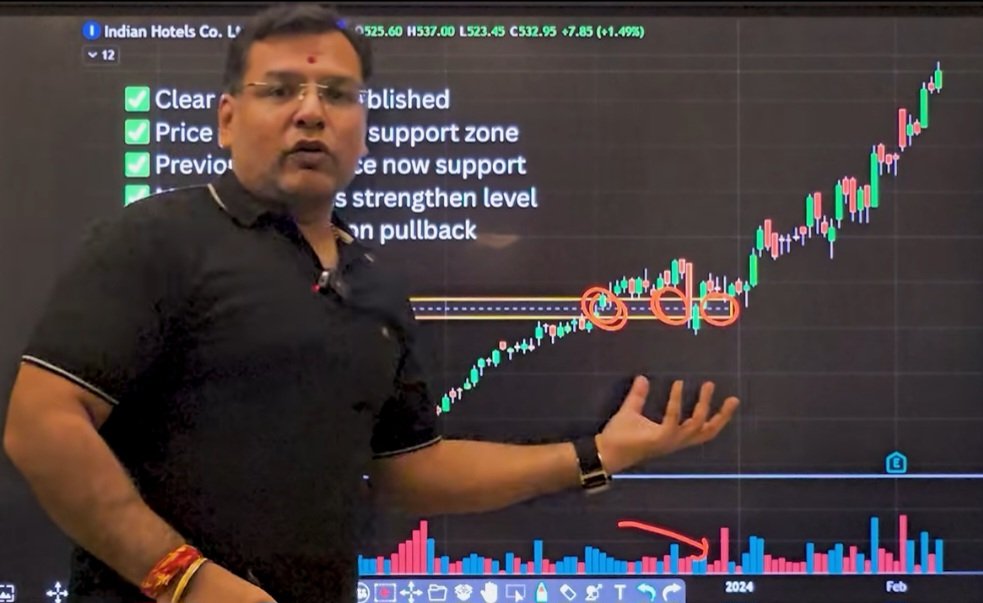
Most traders fail because they don’t use a high probability pullback trading strategy ❌
Markets trend more often than they reverse, and professional traders know this. Instead of chasing breakouts, they wait for pullbacks that offer discounted entry points into strong trends.
This high probability pullback trading strategy combines: • Flag pullbacks
• Fibonacci retracement pullbacks
• Moving average pullbacks
• Price action confirmation
• Volume analysis
This powerful mix filters only the best pullback opportunities so you can avoid fake retracements and late entries.
If you struggle with: ❌ Failed pullbacks
❌ Fake retracements
❌ Late or weak entries
This video will help you: ✔ Identify healthy pullbacks
✔ Confirm trend strength
✔ Time entries with confidence
This strategy works across: 📈 Stocks
🪙 Crypto
📊 Indices
💱 Forex
🛢 Commodities
— and is widely used by pro and institutional traders.
📌 What you’ll learn (no dots): ✅ Why pullbacks fail without a high probability strategy
✅ How professionals use pullbacks
✅ Flag pullback trading explained
✅ Fibonacci pullback levels that matter
✅ Moving averages that confirm pullbacks
✅ Price action rules for high probability entries
✅ Volume rules that validate setups
✅ Clear entry, stop loss & target logic
✅ How to avoid fake pullbacks
✅ Real chart examples
Save this. Study this. Trade smarter.
#HighProbabilityPullbackTradingStrategy #PullbackTrading #FlagPullback #FibonacciTrading #MovingAverageTrading #PriceActionTrading #VolumeAnalysis #TrendContinuation #ProfessionalTrading #StockMarket #CryptoTrading #ForexTrading #Commodities #TechnicalAnalysis #ProTrader
YouTube
English
🚨 BREAKING: I’m launching a NEW SERIES
“How to Trade $SPY for a LIVING”
📈 10-Part Training LIVE on X Spaces NO CHARGE.
MULTI-BAGGER Fibonacci plays showed the blueprint… Now I’m going to TEACH YOU the exact system step-by-step!
Want in?
Drop a 👍 resources below — CLASS STARTS SOON.
English

$Gold at one point earlier today was up 100% from last year's low
and still parabolic since Powell's speech at Jackson Hole
amazing
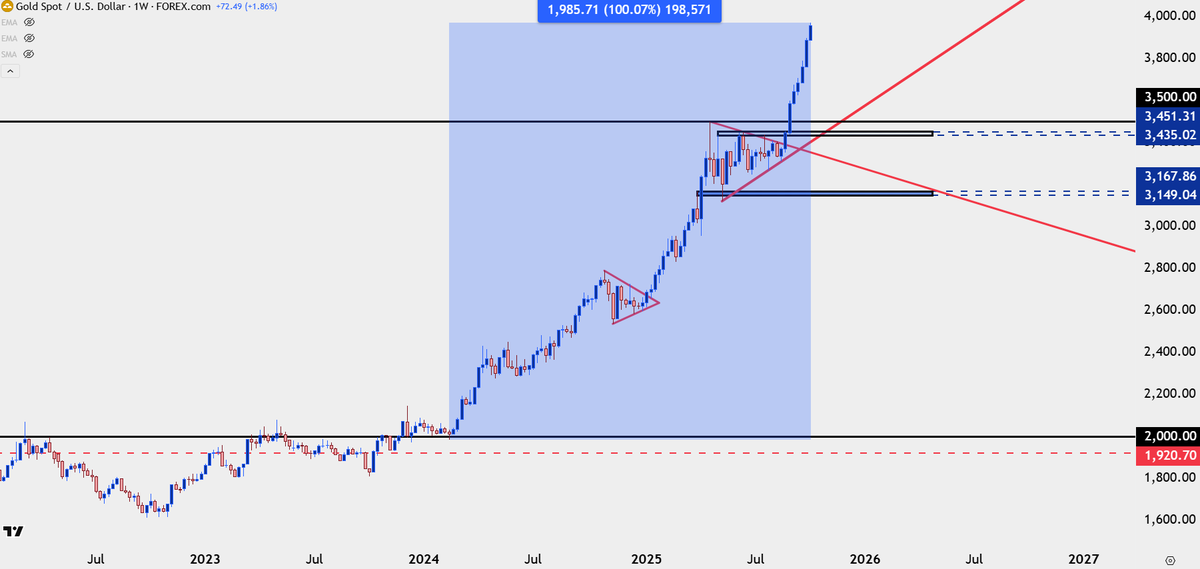
James Stanley@JStanleyFX
$Gold no problems at 3900 at the weekly open next res the $4k handle, and 3895-3900 now support 3871 below that
English

My Option Selling rules:
✅ RULE 1 - Quality Stocks
✅ RULE 2 - Delta Sweet Spot
✅ RULE 3: Diversification
✅ RULE 4 - Weekly/Monthly Options
✅ RULE 5: Position Sizing
✅ RULE 6 - Liquidity
I regularly sell options on 5-20 names and keep repeating
English

@TraderTammy1 @Jake__Wujastyk I always appreciate you always responding. Would love to hear your updates as this week goes along.
English

@mickybahl @Jake__Wujastyk You're welcome...wanted to make sure I gave you an update.
English

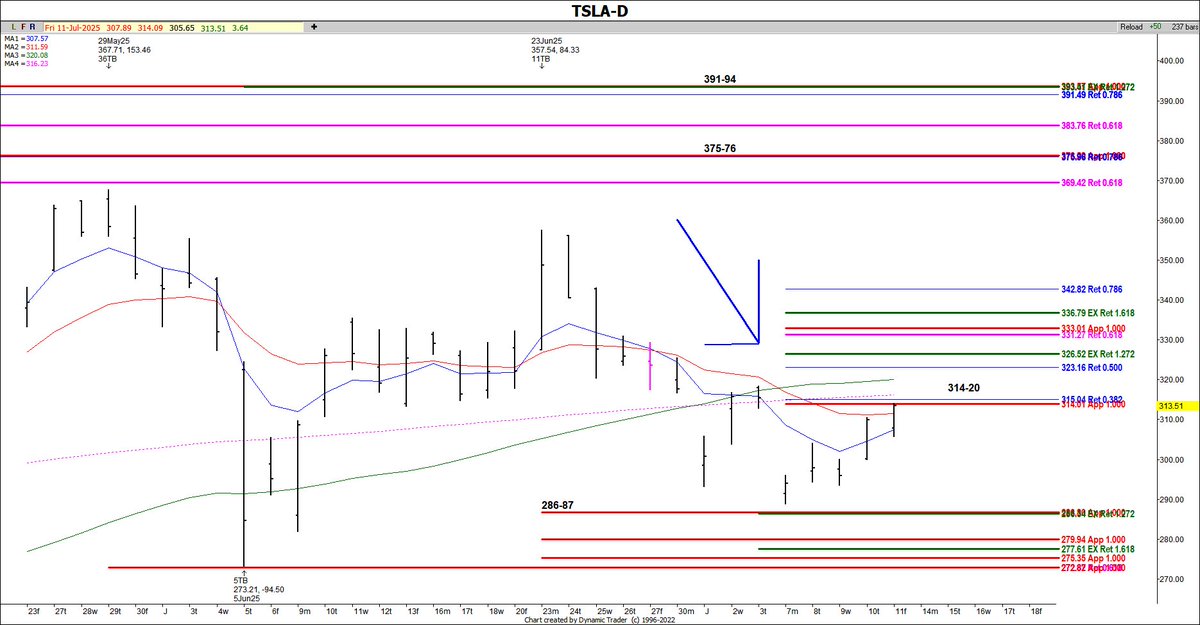
@mickybahl @Jake__Wujastyk $TSLA busted my Fibonacci zone of risk that correlates with the 200SMA...we're now testing the 50SMA (green line). I would like to see us be able to stay above those moving averages. The next zone of resistance is 331-33.

English
@TraderTammy1 @Jake__Wujastyk Thanks. Would you look for Bearish position as price is below both 50 and 200SMA
English
@Jake__Wujastyk I have Fibonacci resistance that correlates with the 50SMA and 200SMA zone 314-20.
English
@TraderTammy1 @TraderTammy1- When you say a 2step bearish setup zone? What does imply
English
$TSLA did fail from the 200SMA correlating with the .382 retracement I mentioned last week in the post below. Right now, it's testing the 50SMA that's correlating with the .618 retracement of this smaller swing up. We could fail here at 296, but if we push through, the next area of resistance includes the 200SMA and a 2 step bearish setup zone 304-14.
Fibonacci Princess aka Trader Tammy@TraderTammy1
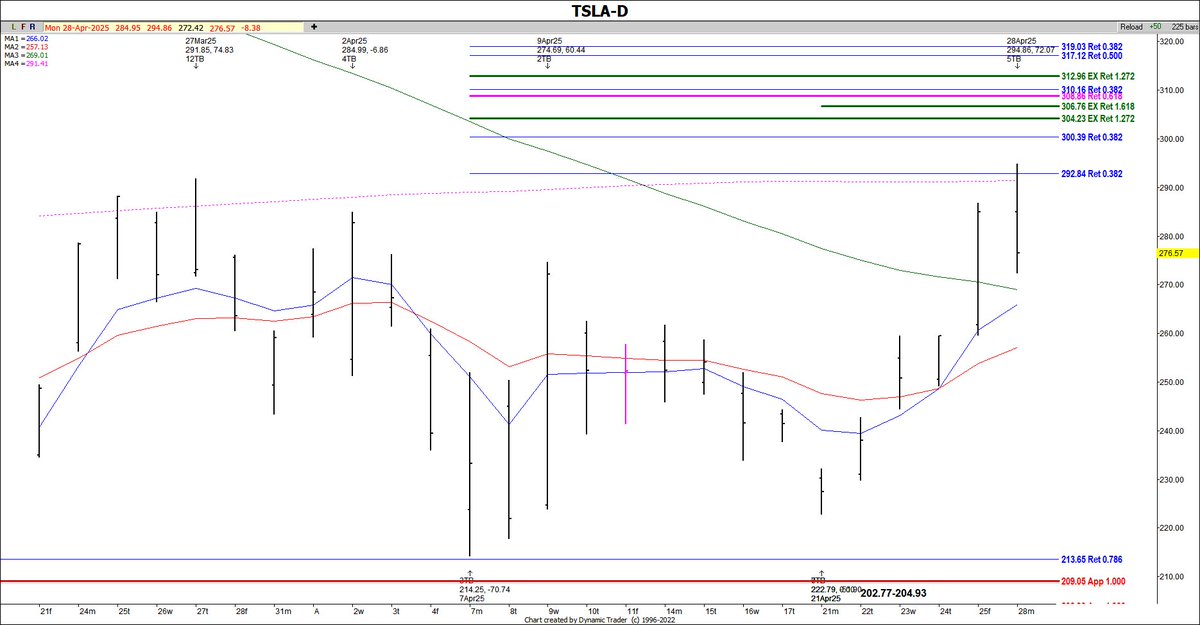
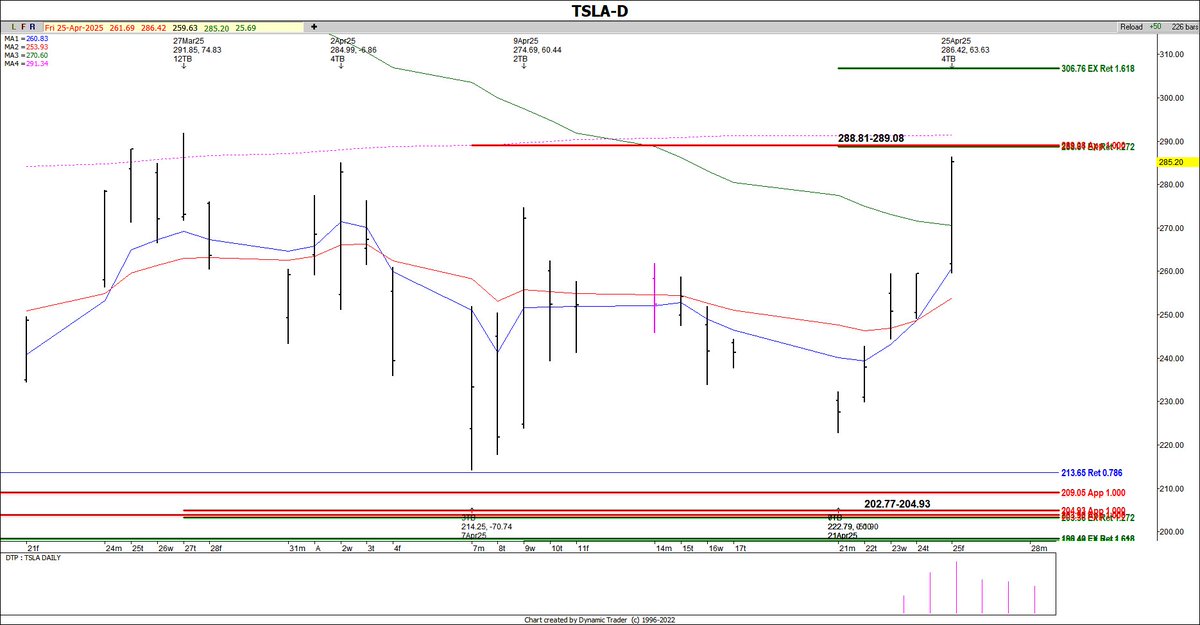
$TSLA had quite the pullback yesterday and all of the moving averages turned to the side of the bears. This morning, it was able to find price support around 272 which includes price symmetry and a .618 retracement. We're currently back above the 50SMA, but need to cross back over the 200SMA which correlates with the .382 retracement of this swing up for this move to continue up. @traderDanielle @TradingBruce @marketminute
English
@TraderTammy1 Hello trader Tammy, what are you seeing as your fib retrace
English
$TSLA met target extensions and has timing for a high. If you're looking to add more conracts, we could see a pullback opportunity from this resistance and timing. The moving averages are all on the side of the bulls now, so buying on a pullback is the trend trade.

English
@TraderTammy1 @TradingBruce @traderDanielle Thank you. Missed entering on your perfect support entry
English
@mickybahl @TradingBruce @traderDanielle We failed off of the .382 retracement on $TSLA daily. Since I don't have any meaningful Fibonacci resistance until much higher on $TSLA, I see it as a good opportunity to get bullish off of the support on my 30 minute chart (both attached).

English
$TSLA is looking much better on the daily. We're now above the 50SMA. However, I do have Fibonacci timing for a high today along with price resistance that correlates with the 200SMA. @TradingBruce @traderDanielle
English
@mickybahl I use Dynamic Trader to run my Fibonacci charts. @QueenOfFibs and I both have YouTube channels with great videos to explain our work. (Mine is in my LinkTree on my X profile page).
English
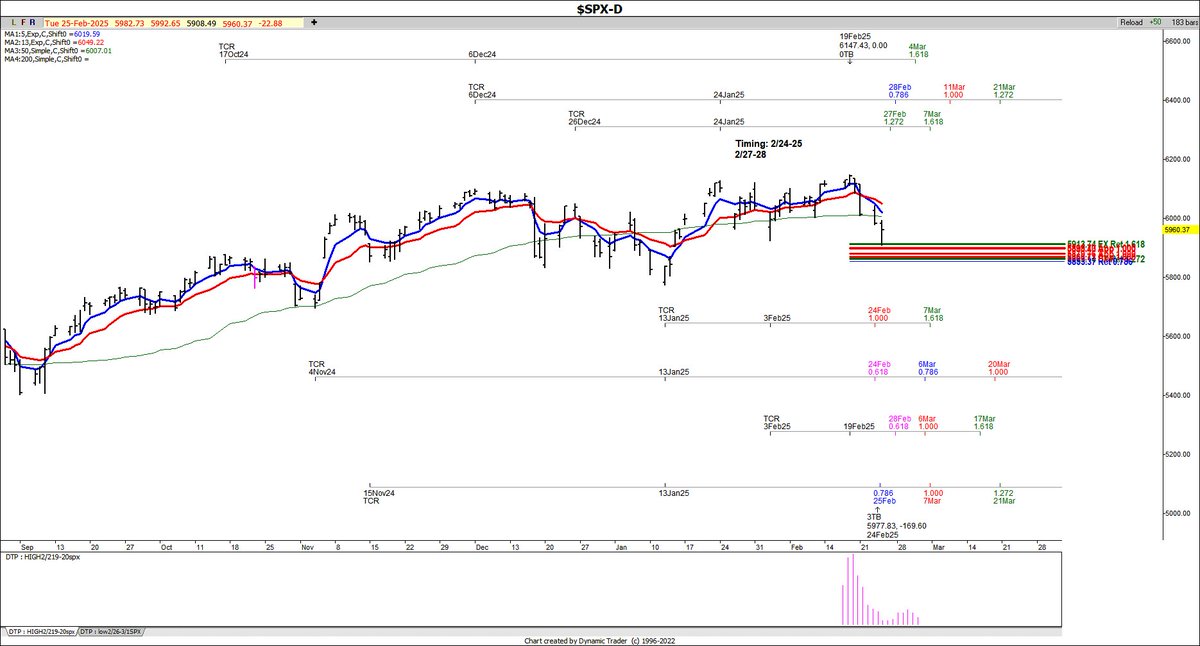
ES and NQ 120 minute overhead resistance $SPX and $NDX If you have questions, please be sure to ask. I want you to understand how to use my Fibonacci work.


English
@QueenOfFibs @QueenOfFibs- what time frame do you watch for 5/13 trigger
English

Timing gave us the $SPX pullback.... Now watching next cycles for a possible bounce. With the averages bearish at this time, we have to watch for a possible failure if we get a rally. The 5/13 combo is bearish and we are also currently below the 50 SMA....We are vulnerable to more on the downside via those!!
English


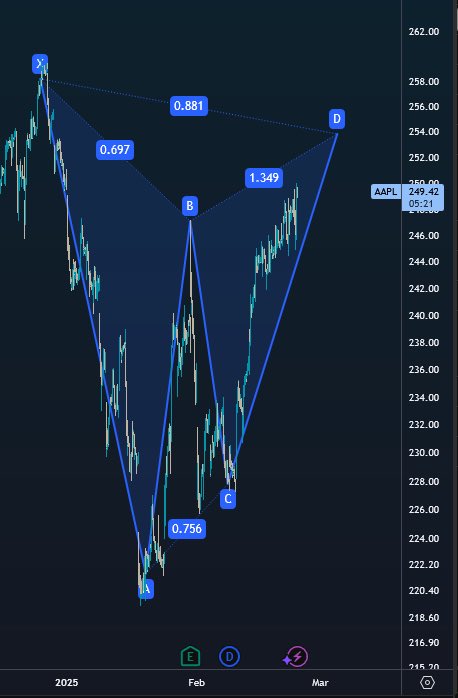
$AAPL so far so good
Often green in a red market
Real Blonde Broker@blondebroker1
I mentioned $AAPL holding $225 earlier this month was support. Moving into the C to D leg as we are coming into the February 19th announcement. $247, $249.5 Above those looking for $253-5
English