Irving MA

39K posts

Irving MA banner
Irving MA

Irving MA

@moaimx

Director de Datos Abiertos en @AgenciaGobMx. Construyo cosas con datos. Los datos no son recurso para generar valor, son herramienta para entender nuestro mundo
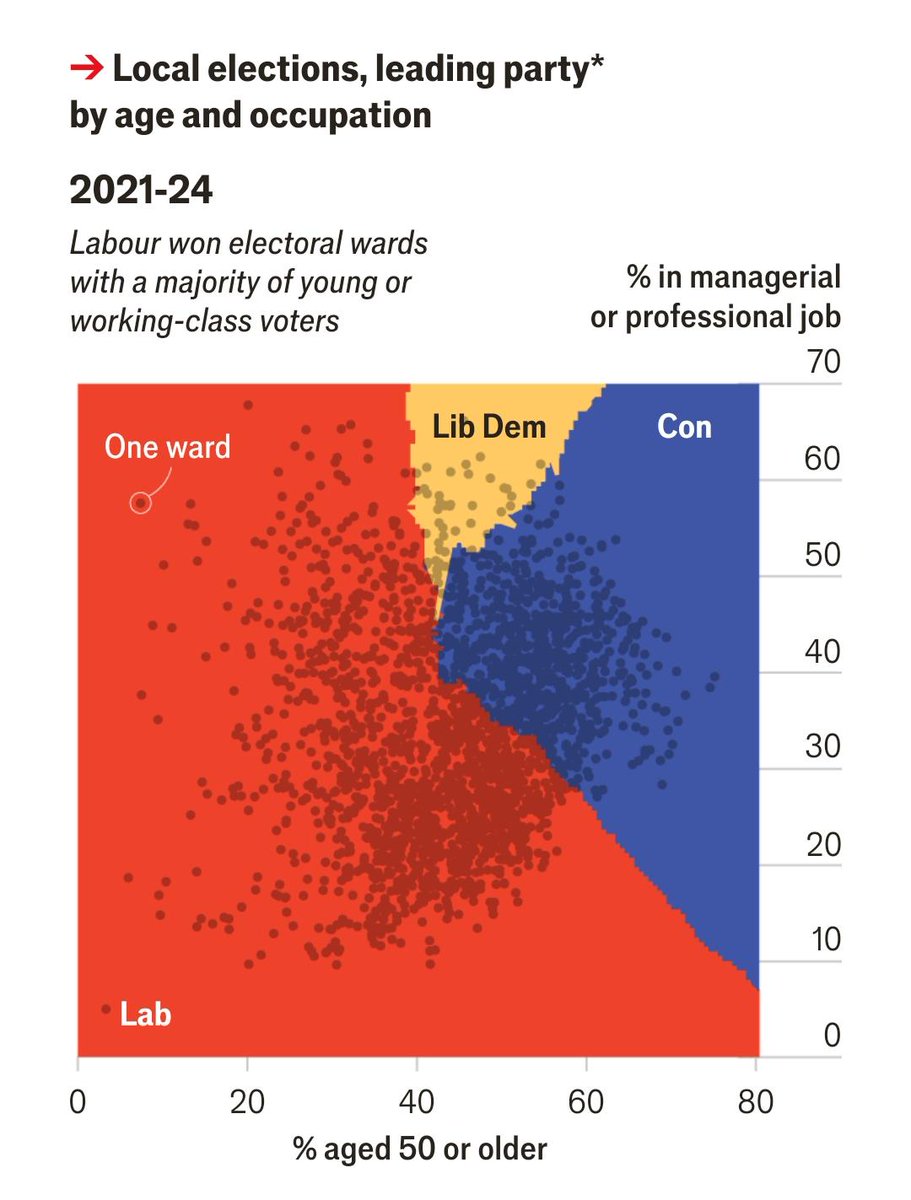
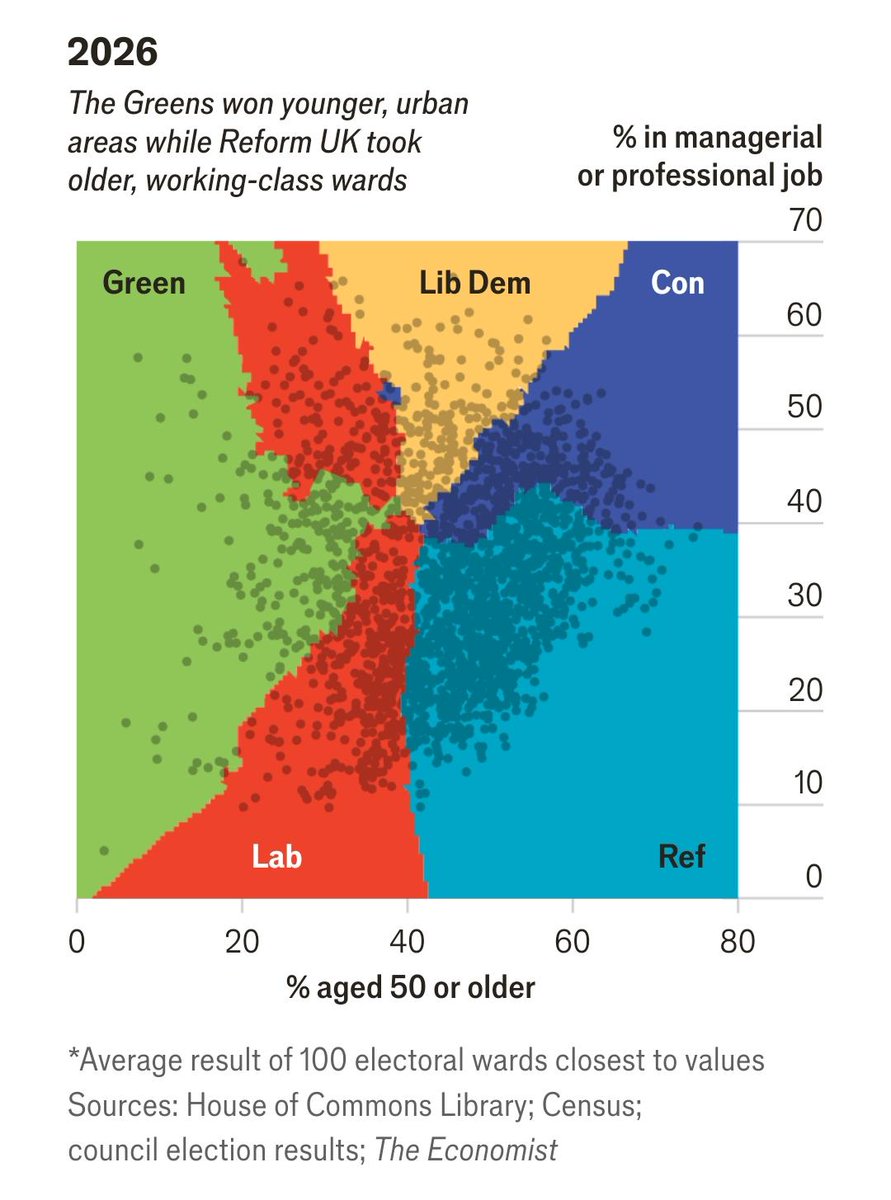
Mexico, DF Katılım Nisan 2009
5.8K Takip Edilen9.8K Takipçiler
Sabitlenmiş Tweet
Irving MA
Irving MA@moaimx·
Hoy toca abrir datos desde acá! Caíganle al #OpenDataDay...
Irving MA tweet mediaIrving MA tweet mediaIrving MA tweet mediaIrving MA tweet media
Español
3
9
63
5.2K
Irving MA retweetledi
PIRAH
PIRAH@pirah_data·
En México solamente el 43% de la población tiene acceso a agua potable segura para beber. 75 millones de personas sin acceso seguro de acuerdo a OMS/UNICEF y al banco mundial. Empty Glass es un proyecto de #dataviz del agua disponible para beber hecho por Inumimo Idowu
PIRAH tweet media
Español
1
9
14
473
Irving MA
Irving MA@moaimx·
Se agradece que compartan o cualquier información.
Irving MA tweet mediaIrving MA tweet media
Español
0
14
0
371
Irving MA retweetledi
PIRAH
PIRAH@pirah_data·
El día de hoy The economist muestra un par de gráficas magníficas para explicar una elección. Gran acierto!
PIRAH tweet mediaPIRAH tweet media
Español
3
23
128
115.6K
Irving MA retweetledi
Civixplorer
Civixplorer@Civixplorer·
The Mesoamerican civilizations.
Civixplorer tweet media
English
4
119
589
15.9K
Irving MA retweetledi
Angeles Salgado 🇲🇽
@Alcaldia_Coy @giogutierrezag hagan algo con este árbol q representa un riesgo para quienes vivimos en la Candelaria. Ya se reportó infinidad de veces xq está seco y no hacen nada. Esta tarde casi me cae encima y ahora el cableado esta comprometido @GobCDMX @SGIRPC_CDMX ayudaaa!
Angeles Salgado 🇲🇽 tweet mediaAngeles Salgado 🇲🇽 tweet mediaAngeles Salgado 🇲🇽 tweet media
Candelaria, Coyoacán 🇲🇽 Español
0
5
4
363
Irving MA retweetledi
SESNSP
SESNSP@SESNSP·
📉 Gracias a la Estrategia Nacional de Seguridad Pública de la Presidenta @Claudiashein, se logró reducir el 40% en el promedio diario de homicidios desde el inicio de la administración. Esta reducción representa 34 homicidios menos al día, al pasar de 86.9 homicidios a 52.5 homicidios.
SESNSP tweet mediaSESNSP tweet media
Español
2
36
50
2.3K
Irving MA retweetledi
Yohan
Yohan@yohaniddawela·
A pre-trained model with no feature engineering, no hyperparameter tuning, and no domain expertise just matched 14 days of computation on a 500-node CPU cluster to forecast crop yields. And it did it in 2 hours on a single GPU. A team at the European Commission's Joint Research Centre spent 14 days running 500 CPU nodes to forecast South African maize yields. A different model, given the same data, did the job in 360 seconds on 4 CPUs. The accuracy gap was 2 percentage points. The 14-day pipeline is the standard machine learning workflow for crop forecasting. You start with raw satellite and weather data: • dekadal time series of FPAR (a measure of green biomass) • soil moisture • rainfall • temperature • solar radiation. Then you engineer features: Monthly averages, monthly maxima, monthly sums, different windows over the growing season. Then you test 14 different feature sets across 6 model types (XGBoost, GBR, Random Forest, LASSO, GPR, SVR), with optional principal component analysis, optional MRMR feature selection, and one-hot encoding of region. That's 96 pipeline configurations per model, each with its own hyperparameters to tune, all wrapped in nested leave-one-year-out cross validation to avoid leaking information from the test year. 14 days on a high-throughput cluster with hundreds of nodes. The alternative is TabPFN, a transformer pretrained on millions of synthetic tabular datasets. You hand it the raw features. No selection, no reduction, no tuning, no engineered aggregates beyond what you've already computed. One forward pass. Done. For maize, the best ML pipeline (Gaussian Process Regression with reduced remote sensing and soil moisture features, PCA, yield trend, and one-hot encoded region) hit 6.8% rRMSE with R² of 0.91 at the national level. TabPFN hit 8.8% with R² of 0.86. ANOVA found no statistically significant difference between them. Both beat the trend baseline (12.9%) and the peak FPAR baseline (14.8%). For soybeans, the gap was even tighter: 13.51% vs 15.1%. For sunflowers, no significant difference between any of the models tested. The data setup tells us why this is important. South Africa has 23 years of yield statistics across 5 to 8 provinces. That's 184 labelled observations for maize, 138 for soybeans, 115 for sunflowers. This is obviously small data territory, where deep learning traditionally fails. TabPFN's pretraining on synthetic data lets it sidestep the small-sample problem because it's not really learning the task from your data. It's pattern-matching against everything it's already seen. The 2024 operational test was the real validation. Both models forecast yields in early April, at 75% of the growing season. Both tracked the official Crop Estimates Committee figures within roughly 10% on maize and 22% on soybeans across 8 provinces. Both flagged the same anomaly in North West province, where they predicted higher yields than CEC, with environmental indicators supporting the model view. TabPFN also produced 95% confidence intervals natively, something the ML pipeline doesn't give you without extra work. The cost asymmetry is what changes the picture. A government statistical office in Mozambique or Zambia can't justify 14 days on 500 CPUs to fit a maize model. They can run TabPFN on a laptop in 6 minutes. The accuracy penalty is 2 percentage points of rRMSE on a forecast that already sits well inside the noise of the official CEC trend-and-survey methodology. For most operational purposes, that's a free upgrade from no forecast to a usable forecast. There's a broader pattern here that goes beyond crop yields. Foundation models for tabular data are doing for small structured datasets what large language models did for text. The expensive, bespoke, expert-tuned pipeline used to be the only path to good performance. Now a generic pretrained model gets you 90% of the way for 0.05% of the compute. The remaining gap between TabPFN and the 14-day pipeline is the value an experienced ML engineer adds. That's still positive. It's also small enough that for most users in most settings, it isn't worth paying for. The authors are now scaling the approach across multiple African countries. If TabPFN holds up in Ethiopia, Kenya, Burkina Faso, the implication is that operational subnational yield forecasting just stopped being a specialist service. It became a default capability anyone with a laptop and the public ASAP environmental data feed can run. Link to paper: nature.com/articles/s4159…
Yohan tweet media
English
10
65
422
28.4K
Irving MA retweetledi
Serendipia
Serendipia@SerendipiaData·
La maternidad en México cambió. En 1960, las mujeres tenían en promedio 6.7 hijos. Hoy, la cifra cayó a 1.8. Mientras tanto, las mujeres dedican casi 50 horas semanales al trabajo no remunerado. serendipia.digital/datos-y-mas/ma…
Serendipia tweet media
Español
1
9
20
506
Irving MA retweetledi
México, ¿cómo vamos?
México, ¿cómo vamos?@MexicoComoVamos·
🟣 De acuerdo con la Encuesta Nacional sobre Uso del Tiempo (ENUT) 2024, las mujeres mexicanas de 12 años y más destinan el 64.8% de su tiempo total de trabajo a actividades no remuneradas — el doble que los hombres.
México, ¿cómo vamos? tweet media
Español
2
16
29
1.2K
Irving MA retweetledi
Luis Martínez
Luis Martínez@Luis_MartinezRz·
¿Sabían que la Cuauhtémoc es el municipio* con mas jefas de hogar del país? Además uno de cada 3 hogares en el país cuenta con esta condición. #DíaDeLaMadre #DíaDeLasMadres *con más de 50 mil habitantes.
Luis Martínez tweet media
Español
0
4
13
732
Irving MA retweetledi
Yohan
Yohan@yohaniddawela·
A satellite image tells you what the Earth looked like at one moment. COP-GEN tells you what it could look like, and why that distinction matters more than it sounds. Most Earth observation models are deterministic. If you feed in a DEM and a land-cover map, and they produce one output: the most likely optical image. It's basically one question, one answer. The problem is that the real world doesn't work that way. The same terrain on the same coordinates can look completely different depending on cloud cover, season, soil moisture, atmospheric scattering, and a dozen other variables that aren't in your input. There's no single "correct" image. There's a distribution of plausible images. Deterministic models collapse that distribution to its mean, and they call it a prediction. COP-GEN, from researchers at Edinburgh and ESA, is built around this problem. It's a multimodal latent diffusion transformer trained on Copernicus data: Sentinel-2 optical, Sentinel-1 SAR, elevation, land cover, timestamps, and geolocation. Rather than predicting the most likely output, it samples from a learned distribution of physically plausible outputs. Ask it the same question sixteen times, and you get sixteen different but coherent answers. The benchmark numbers make this quite concrete. Against TerraMind, the existing benchmark model, COP-GEN achieves a spectral recall of 0.900. TerraMind achieves 0.028. That means COP-GEN's generated samples cover 90% of the real observation manifold. TerraMind's cover just 2.8%. Its sixteen outputs are nearly identical to each other, clustered near the conditional mean, and effectively invisible to the real data distribution. It wins on precision (each individual sample is close to a plausible real image) but fails entirely on recall (it can't reproduce the range of valid observations). The authors call this diversity collapse, and it's not a minor flaw. It's a structural consequence of deterministic training objectives. When you optimise for "produce the most accurate single output", you end up with a model that produces almost the same output every time. That's fine if you want a point estimate. It's a problem if you're trying to model uncertainty, simulate counterfactuals, or generate training data for downstream tasks. COP-GEN trades some of that per-sample precision for real coverage. Its intra-set diversity is 9.1 times higher than TerraMind's in spectral space. Its MMD (maximum mean discrepancy from the real distribution) is roughly half. It covers 63% of the real per-band reflectance range; TerraMind covers 18%. The practical implications aren't subtle though. Cloud gap-filling is the obvious one: when optical imagery is missing, you can't just impute a mean. You want a sample from the distribution of what the surface probably looked like, not a blurred average. Change detection across seasons has the same problem. Uncertainty quantification for downstream land-use models, water stress mapping, disaster monitoring. These tasks all require knowing not just what's most likely, but what range of outcomes is physically plausible. Band infilling is another demonstration of what the architecture can do. Feed COP-GEN only the four high-resolution visible bands (B2, B3, B4, B8) and it reconstructs the remaining Sentinel-2 spectral bands, the Sentinel-1 SAR, elevation, land cover, timestamp, and geolocation. It's inferring the full observational signature of a location from a narrow slice of it. The architecture treats each sensor and each spectral group as an independent modality with its own latent encoder. Resolution-aware tokenisation means Sentinel-2's 10m, 20m, and 60m bands are handled separately, preserving native sensor characteristics instead of resampling everything to a common grid. The diffusion process runs independent timesteps across modalities, which is what enables zero-shot any-to-any conditional generation without task-specific retraining. The paper is honest about where it falls short. Geolocation and timestamp conditioning have limited influence on outputs. Snow appears near the equator. The spatial modalities dominate the diffusion loss because they're represented by far more tokens than a latitude-longitude pair or a date. That's a training imbalance problem, and the authors flag it as a clear direction for future work. What COP-GEN establishes, beyond the model itself, is an argument about evaluation. Standard pointwise metrics like MAE and PSNR reward deterministic solutions. A model that always produces the conditional mean will score well on those metrics and will have near-zero recall. The stochastic benchmark in this paper, comparing the full distribution of outputs rather than the best single sample, is closer to the right question. The EO community will need to adopt that framing if it wants to properly evaluate generative models. The architecture is available. The Major Tom dataset it trained on is public. The gap between "what the Earth looks like" and "what the Earth could look like" has a model now. Link to the full paper: arxiv.org/pdf/2603.03239
Yohan tweet media
English
1
7
46
3.2K
Irving MA retweetledi
PIRAH
PIRAH@pirah_data·
¿Cómo se reparte el poder en México? A nivel municipal, el poder es un mosaico de fuerzas mucho más fragmentado de lo que parece. Ahora puedes explorar este mosaico en nuestro mapa interactivo. Abrimos hilo con algunas de las posibilidades 👇
PIRAH tweet media
Español
10
115
422
21.4K
Irving MA retweetledi
Yohan
Yohan@yohaniddawela·
Physics-based weather models still beat AI when it matters most. Not on average. On the most extreme days. This is the opposite of what we've been hearing... A new paper in Science Advances ran every major AI weather model: GraphCast, Pangu-Weather, Fuxi, against ECMWF's HRES across 162,751 record-breaking heat events, 32,991 cold records, and 53,345 wind records in 2020. On average conditions, the AI models win. GraphCast, Fuxi, and the rest outperform HRES on standard temperature and wind benchmarks across most lead times. This matches what every prior benchmark study has shown. AI weather forecasting is genuinely impressive. Then the researchers asked a different question. What happens when the event is unprecedented? Not extreme. Not the 95th percentile. Actually beyond anything in the training data. HRES won every single category. Heat records. Cold records. Wind records. Nearly every lead time. The performance gap was largest at short lead times, where AI models should have the most information and the least uncertainty. The bias pattern is pretty massive. The AI models systematically underestimated how extreme the events were. The bigger the record exceedance, the larger the underprediction. The researchers describe it as an implicit 'soft cap': the models behave as if they can't forecast values much beyond the most extreme thing in their training data. The bias grows almost linearly with how far the event exceeded the record. HRES showed no such pattern. This isn't a fluke. The same result held in 2018 and 2020, which had opposite ENSO conditions. It held across the tropics, subtropics, mid-latitudes, and high latitudes. It held for all three variables. It held when the researchers ran an alternative evaluation specifically designed to avoid the forecaster's dilemma. The mechanism is pretty straightforward. AI weather models are trained on ERA5 reanalysis data from 1979 to 2017. They learn to interpolate between historical weather patterns. When a new initial condition arrives, they find the nearest analogues in training and produce something in between. Record-breaking events, by definition, have no close analogues. The model has never seen anything quite like this, so it regresses toward the most extreme things it has. Physics-based models like HRES don't work this way. They solve partial differential equations describing atmospheric dynamics. They don't need a historical analogue for a 48°C heatwave in Siberia. The physics doesn't care whether it's happened before. The authors are careful about what this means. AI models remain faster, cheaper, and competitive on average conditions. Probabilistic AI forecasting is developing rapidly. Data augmentation with simulated extreme events and hybrid physics-AI architectures are plausible paths forward. This isn't a verdict on AI weather forecasting broadly. But the policy implication is quite important. The events where AI models fail hardest are exactly the events where accurate forecasting matters most. Record-shattering heat. Unprecedented wind storms. The scenarios that overwhelm emergency response, strain infrastructure, and kill people because no one expected them to be that bad. The authors wrote it plainly: it remains vital to fund and run physics-based NWP and AI weather models in parallel. I find it an unusually direct recommendation in a methods paper. Climate change means record-breaking events are becoming more frequent, not less. The training distribution is shifting. AI models trained on 1979 to 2017 data will see more and more out-of-distribution events as the climate diverges from that baseline. The extrapolation problem the researchers identified isn't going away. It's getting harder. The models that can't forecast records are being asked to forecast a world that's setting them constantly. Link to full paper: science.org/doi/10.1126/sc…
Yohan tweet media
English
11
104
349
29K
Irving MA retweetledi
Datawrapper
Datawrapper@Datawrapper·
🚀 Curious to learn the basics of Datawrapper? Join our "Getting started" webinar *tomorrow*, May 12 (6pm CET/12pm EDT)! Shaylee from our support team will walk you through the #dataviz tool: watch.getcontrast.io/register/getti…
English
0
2
6
673
Irving MA retweetledi
Mercedes Sánchez Plascencia
Mercedes Sánchez Plascencia@cartodynamics1·
Porcentaje de hogares con persona de referencia mujer respecto al total de hogares por alcaldía ♀️💁🏻‍♀️ Fuente: INEGI, Censo de Población y Vivienda 2020.
Mercedes Sánchez Plascencia tweet media
Español
1
18
40
1.7K
Irving MA retweetledi
Codeando México
Codeando México@CodeandoMexico·
📺YouTube: Ayer presentamos la Metodología Abierta para el Mapeo de Transporte Público, que nace porque muchas ciudades en México y ALC necesitan infraestructura digital de transporte público, y que pueden lograrlo sin necesidad de tener muchos recursos. youtube.com/watch?v=hxrBx3…
YouTube video
YouTube
Codeando México tweet media
Español
0
18
43
1.3K
Irving MA retweetledi
Astronomía Magazine
Astronomía Magazine@astronomiamag·
📷 Evolución de la distribución de longitudes de los genes que codifican proteínas a lo largo de la historia de la vida. (Fernando J. Ballesteros) 📕 Revista N.º 323 Sección: Astrobiología Autor: Jorge Pla García
Astronomía Magazine tweet media
Español
5
47
135
8.8K