mw retweetledi

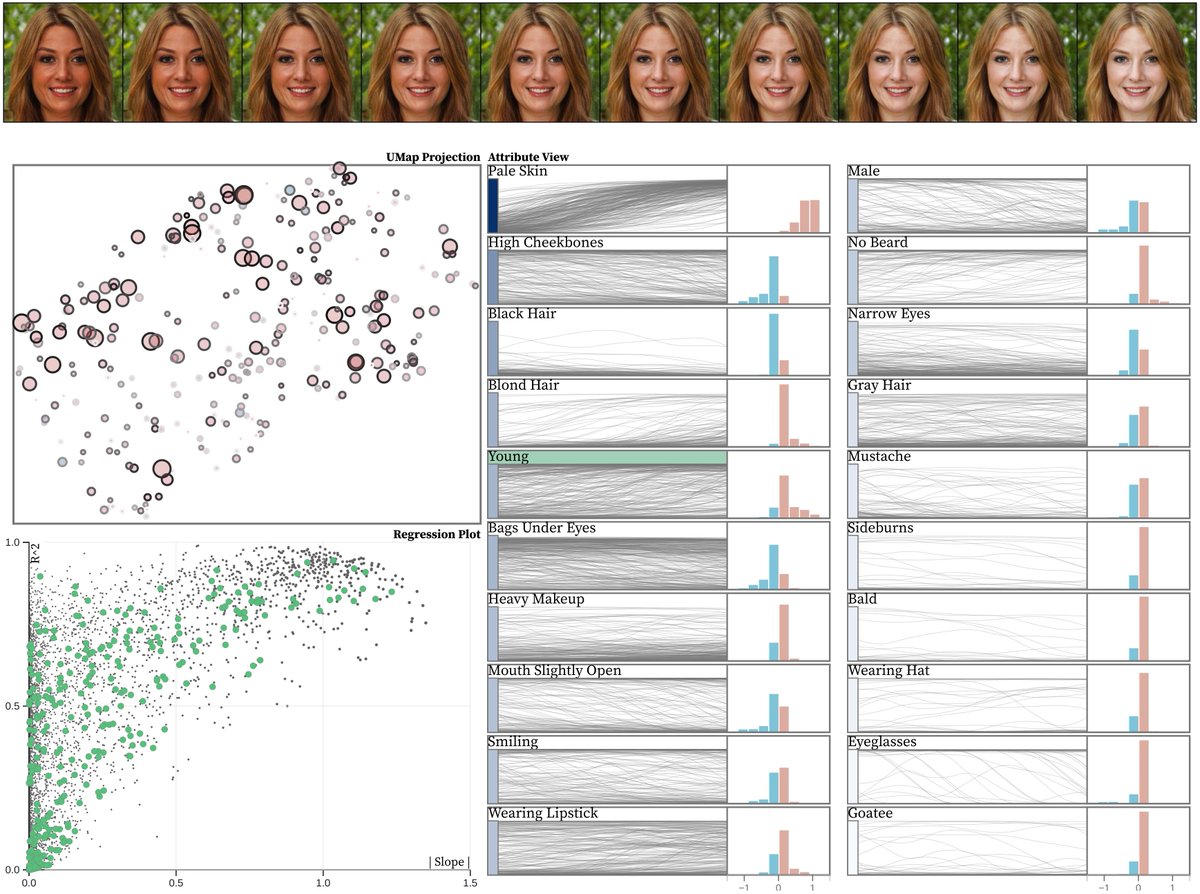
📜 Check out this work that gives easy access to GAN users who want to understand relationship between semantic features!
✍️ @Top1Jeong, Shusen Liu, Matthew Berger
#FullPaper #EuroVis #EuroVis2022
English
mw
28 posts


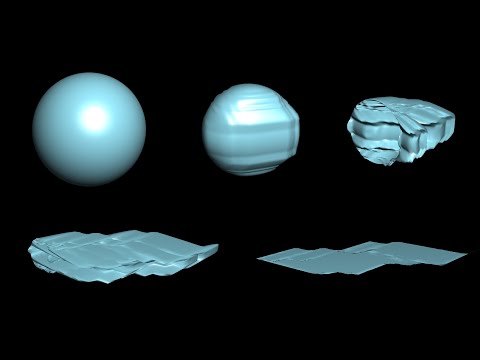
New on Multiple Views: Josh Levine talks about how vis and ML can peacefully coexist. Check out this post to learn how deep learning can help us build better spatial visualizations. medium.com/multiple-views…


How do you proceed with a Design Study amidst Pitfalls in the very first stages? And one of them is that you don't have any real data?? arxiv.org/pdf/1905.13135… @hdc_arizona @8clique @KT_Williams22 @accidental_PhD #ieeevis