myDataClique

281 posts

myDataClique banner
myDataClique

myDataClique

@myDataClique

myDataClique is a data community dedicated to helping beginners and aspiring data analysts grow into confident, independent professionals.

Katılım Ekim 2024
4 Takip Edilen61 Takipçiler
Sabitlenmiş Tweet
myDataClique
myDataClique@myDataClique·
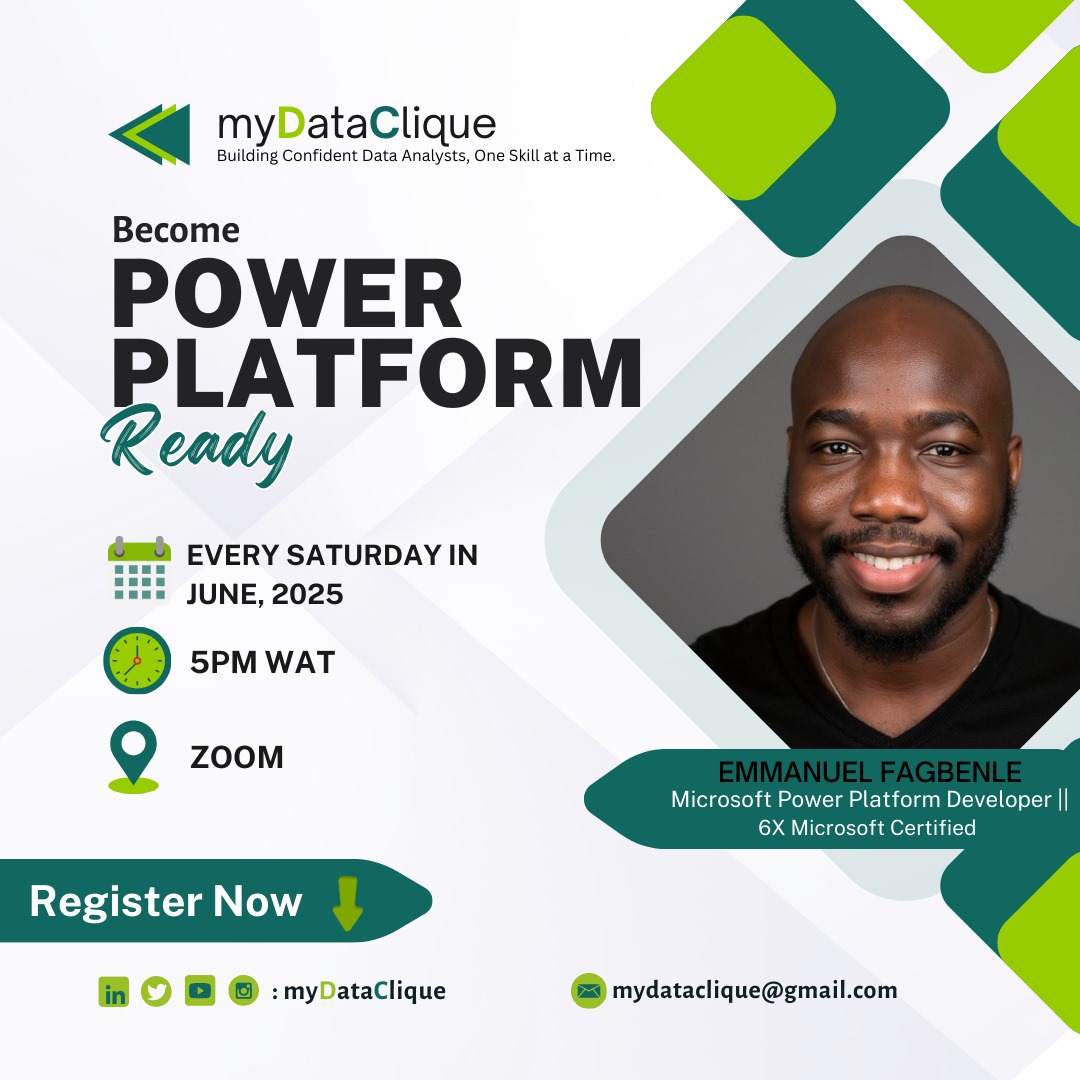
Are you curious about Microsoft Power Platform? Join us this June for a power-packed insight session with Emmanuel Fagbenle — a 6x Microsoft Certified Developer. 📍Zoom 🕔Every Saturday, 5PM WAT REGISTER HERE - shorturl.at/8VjX0
myDataClique tweet media
English
0
1
2
124
myDataClique
myDataClique@myDataClique·
One underrated skill in data analytics? Communication. You can have the best analysis, but if your audience is confused… it is wasted effort. Data storytelling helps you: * Turn data into clear insights * Keep your audience engaged * Make your message easy to follow
myDataClique tweet media
English
1
0
0
5
myDataClique
myDataClique@myDataClique·
This includes things like: * Cleaning messy data * Handling missing values * Standardizing formats * Joining multiple datasets If your data is not clean, your insights won’t be reliable. This is a skill every data analyst must learn #dataanalyticstips #beginnerfriendly
English
0
0
0
2
myDataClique
myDataClique@myDataClique·
A lot of people jump straight into visualization. But the real work of data analysis often happens before that. Data wrangling involves preparing your dataset so it can actually be analyzed.
myDataClique tweet media
English
1
1
0
23
myDataClique
myDataClique@myDataClique·
Hello, March. A new month. A fresh start. Another opportunity to grow. This month, let’s focus on building real data skills, staying consistent, and making steady progress. Small improvements every day lead to big results. Let’s make March count. #myDataClique #JointheClique
myDataClique tweet media
English
0
1
2
41
myDataClique
myDataClique@myDataClique·
One tool is no longer enough. Surface-level knowledge is no longer enough. Depth. Integration. Real understanding. At myDataClique, we believe in building analysts who can think, not just click. Which of these skills are you strengthening this quarter? #datafam
English
0
0
0
5
myDataClique
myDataClique@myDataClique·
The modern data analyst must understand the entire data workflow: * Data extraction and transformation * SQL and database management * Python or R for analysis * Dashboarding and storytelling * Cloud platforms and big data tools * Data governance and security
English
1
0
0
9
myDataClique
myDataClique@myDataClique·
A SHORT THREAD 🧵: Almost two months into the year. The real question is not “What should I learn this year?” The real question is “Am I building the right skills?”
myDataClique tweet media
English
1
0
0
15
myDataClique
myDataClique@myDataClique·
Happy birthday to our community manager. @Jay_theanalyst We see all that you do for us and we are grateful. We pray God grants you every of your heart desires and blesses you beyond measures. Thrive.💚
myDataClique tweet media
English
0
1
2
49
myDataClique
myDataClique@myDataClique·
Click on the link below to register: forms.gle/5bR5LR61X6P19k… No more guessing. No more fear of statistics. By the end of this training, you will know exactly what you are doing with your project data.
English
0
0
0
2
myDataClique
myDataClique@myDataClique·
What you will learn: * How to structure and understand your research data * How to analyze project data using SPSS and R. * How to choose the right statistical tests * How to interpret results correctly * How to present tables, charts, and findings in your project
English
1
0
0
7
myDataClique
myDataClique@myDataClique·
We are hosting a 3-Day Hands-On Training designed specifically to help final year students analyze their research projects confidently using R and SPSS.
English
1
0
0
15
myDataClique
myDataClique@myDataClique·
FINAL YEAR STUDENTS — THIS IS FOR YOU Struggling with how to analyze your final year project data? Confused about SPSS, R, statistical tests, or how to interpret your results?
myDataClique tweet media
English
1
0
0
9
myDataClique
myDataClique@myDataClique·
They were researching better ways to help people see and understand data, because many existing tools made data difficult to explore. Their research focused on using interactive visuals to make patterns and insights easier to notice.
English
1
0
0
2
myDataClique
myDataClique@myDataClique·
Did you know @tableau started as a research project? Before Tableau became a popular data visualization tool, it began as a research project at Stanford University. The project was led by Professor Pat Hanrahan, along with his students Chris Stolte and Christian Chabot.
myDataClique tweet media
English
1
0
0
17