NeffXBT
6.1K posts

@Neffxbt
On-Chain, Market Structure & Fundamentals • DeFi • RWA • AI Not investment advice.


Bitcoin pullback would be expected if we get one.


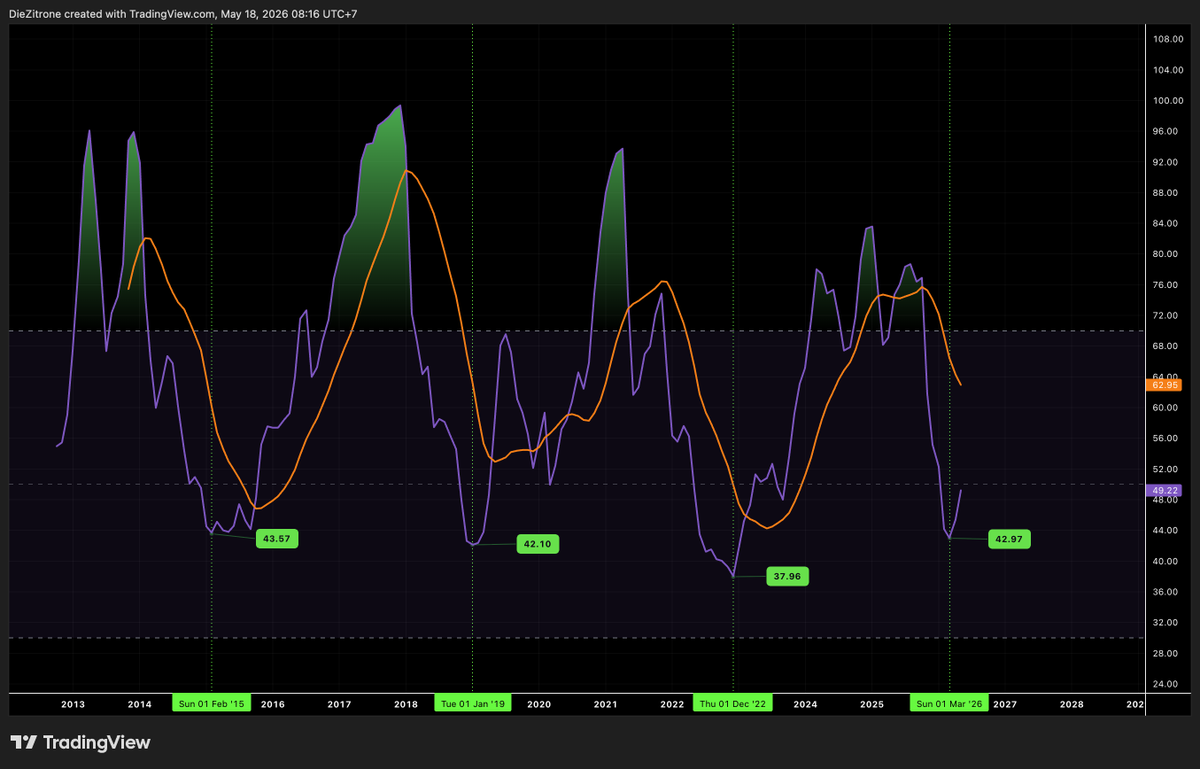
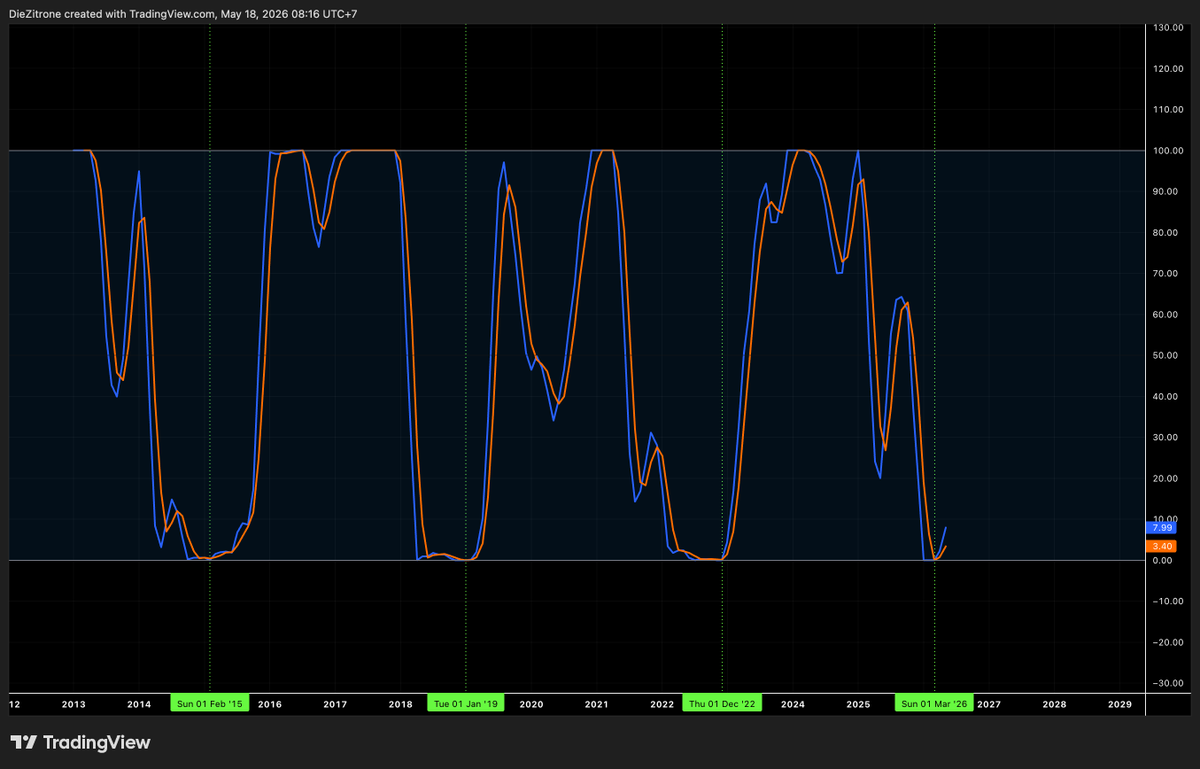
I just analyzed the $BTC monthly chart using Heikin Ashi candles along with several key indicators. Here's what I noticed. In the previous 2 market cycles, the monthly RSI marked major cycle lows as follows 1⃣ January 2019 Monthly RSI reached 41–42, coinciding with a clear bottom. The RSI Div. indicator shown a Pivot signal at that time, plus bullish crossover on Stoch RSI 2⃣ December 2022 Monthly RSI dropped to 37–38, again marking the cycle low, with the RSI Div. indicator once more showing a Pivot signal, plus bullish crossover on Stoch RSI 3⃣ In the current cycle, as of March 2026 The monthly RSI has reached 42–43. However, the RSI Div. indicator has not yet showed a Pivot signal but bullish crossover on Stoch RSI has already occurred. Across all 3 cycles, Stochastic RSI, RSI falling below the 43 level, and the Pivot signal from the RSI Div. indicator have consistently aligned before a trend reversal, reliably marking the bottom of each cycle.


All you need is a vodka cranberry, but without the cranberry, and patience $OTHERS.D


I've been saying for months now... Where we are is almost identical to 2019/2020.... NOT 2022. And as we can see, 4 months on from this post, OTHERS.D is playing out just how it was back in 2019/2020, starting to uptrend. Not just in 2019/2020, but also 2016. Each period has a: - Bottoming chart on HTF - 2W MACD curling up - Business cycle entering expansion Exact same as now. The cycle tops we have had have the total opposite conditions: - Blow off top chart - 2W MACD turning down - Business cycle in expansion for 18 months Each time OTHERS.D has bottomed like this, everyone has called alts dead, and then it has gone on a 18 month run. Take a clear look at this chart.... where does it look like we are now? Are we in a similar position to a cycle top, or a cycle bottom? It is obvious is it not? The craziest thing is that everyone will see a chart like this and tell me its stupid. It is just objective data that shows the overall market position and shows how each chart looked at different phases in the past cycles. To me, it is very clear where we are.

🧵The strongest Alt season in history is beginning to unfold before our eyes. But I need to be clear. No, I don’t think this will be in the immediate short term, 1-4 weeks, but the higher timeframe setup is strongly aligning for one to begin in Q1-Q2 2026. I post many different charts every week but wanted to take the time to compile what all of this truly means, where I believe we are currently at and why.


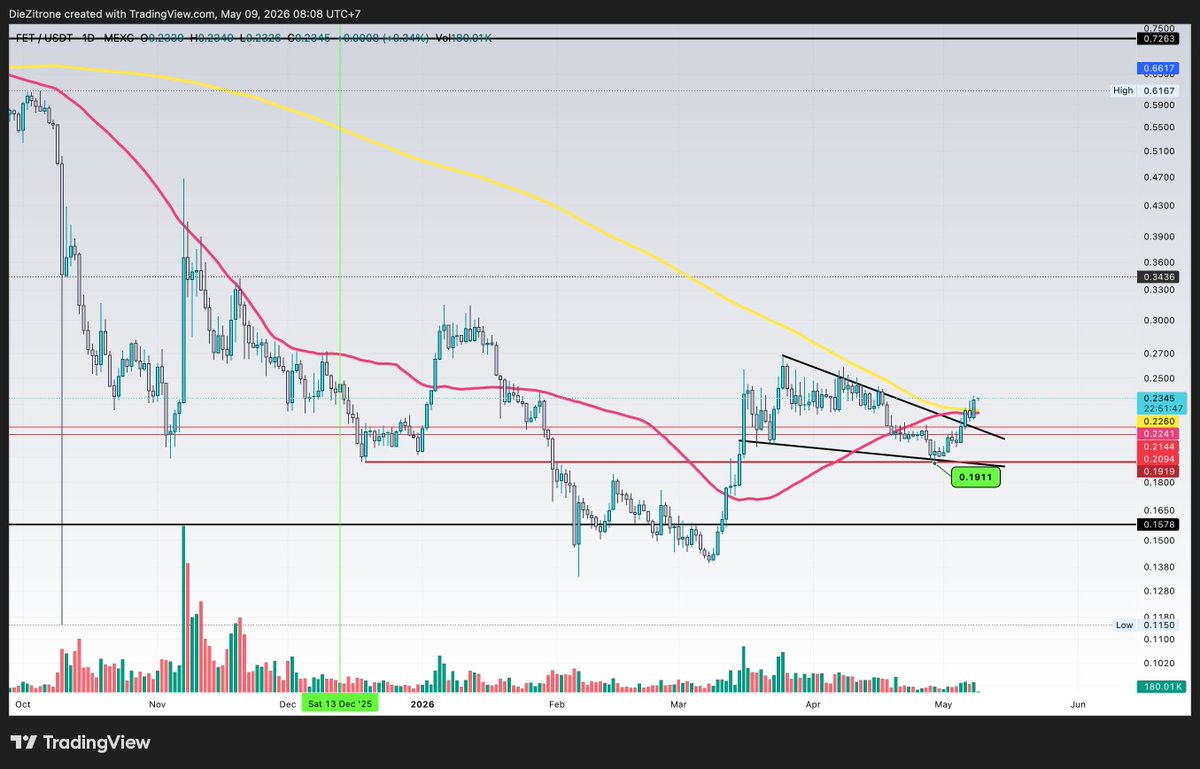
$FET l @Fetch_ai Price is still struggling to flip the daily 50MA into support. On the 12H timeframe, it looks like a falling wedge pattern has formed, followed by a breakout. Price is now in the retesting phase. If a golden cross fails to play out, we could see a retracement toward the $0.205–$0.21 zone in the coming days. This area would likely act as a demand zone before a potential bounce and the next leg higher.


$HBAR I like the daily and weekly chart.. Price is currently flipping 1D MA50 into support. Good entry zone between 0.088-0.09


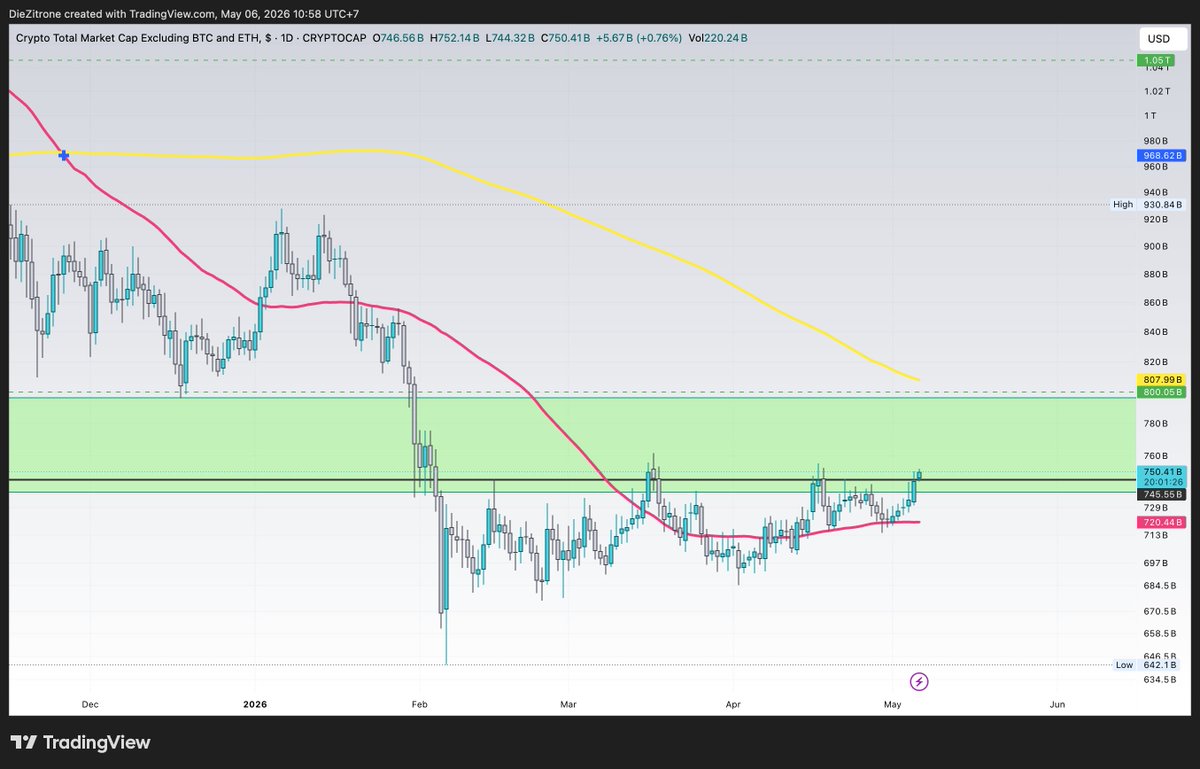
#TOTAL3 TOTAL3 breakout attempt from the consolidation phase.


$BTC $79,000+ / Weekly RSI 47-48 A potential hidden bullish divergence update


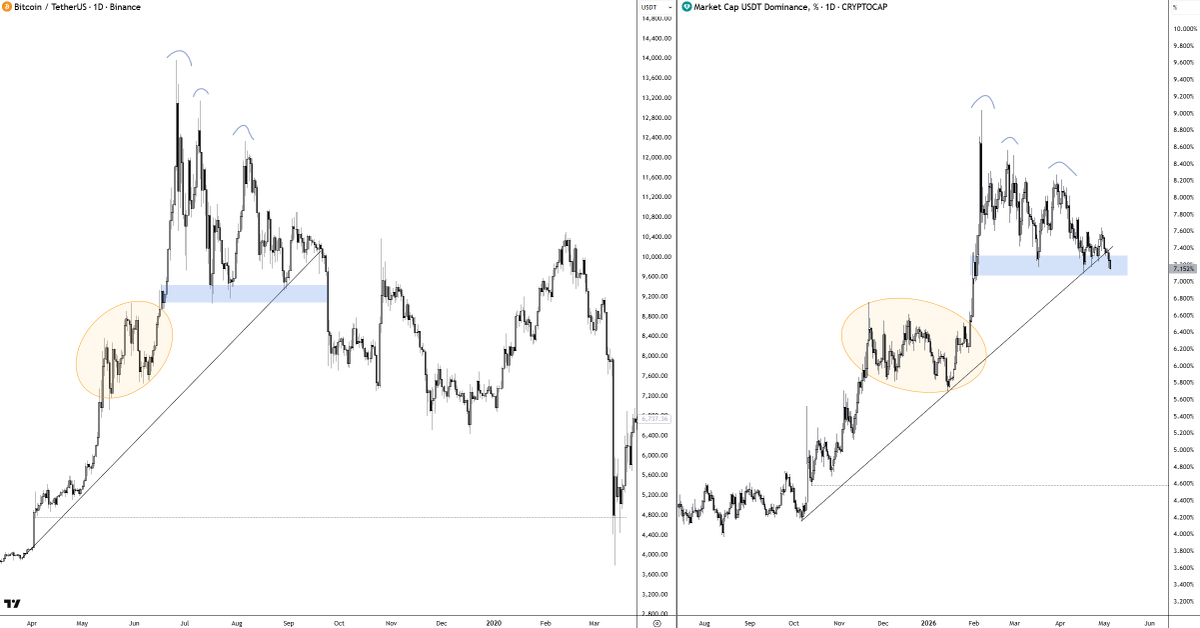
It is all about perspective USDT.D vs #Bitcoin


A massive breakdown is brewing here. USDT.D has lost its HTF uptrend and the 1W MACD has rolled over. When this combination has happened over the last recent years, it has led to a minimum 70% pump for Bitcoin. There is no two ways about it - USDT.D is now highly bearish. Typically, these weeks as USDT.D is beginning to break down are the best times to get bullish on the market and allocate. The time for shorts is running out fast. Yet another strong bottom signal confirmed.