
SOLIDJELLO
1.1K posts

SOLIDJELLO
@nillionare
I may never hold dominion over great men but I shall forever remain master over this one. It takes balls to trade this market and size does matter, follow the $
District Of The Americas Katılım Şubat 2011
94 Takip Edilen501 Takipçiler


IPO VWAP -vs- Earnings Report VWAP
The IPO VWAP (Volume-Weighted Average Price anchored from the initial public offering date) represents the average cost basis for investors who participated in or entered the stock since its public debut. It often serves as a key long-term support level, particularly for stocks within 1-3 years of IPO, as institutions tend to defend this level to protect their cost basis. Price bounces or rejections at this level can indicate overall market control since the IPO, with price above it signaling buyer dominance and below it seller dominance.
The VWAP anchored to the last earnings report focuses on a shorter-term period, capturing the average price since the earnings release (or the following trading day). This highlights post-earnings sentiment, such as accumulation after positive results or distribution after negative ones. It is useful for assessing how the market has digested the latest financial update, with price holding above it suggesting sustained optimism and below it potential weakness.
These two indicators are correlated in that they both reflect institutional cost bases from significant events but over different time horizons. Traders use them together to gauge multi-layered sentiment: for instance, a stock trading above the earnings-anchored VWAP but below the IPO VWAP may indicate recent buyers are profitable while early IPO holders are underwater, potentially signaling fading momentum or a setup for mean reversion. Conversely, price above both can confirm strong upward trend continuation, while below both points to bearish control. In practice, their intersection or divergence can mark confluence zones for support/resistance, helping identify entry/exit points or shifts in buyer/seller dynamics.

English
SOLIDJELLO retweetledi

SOLIDJELLO retweetledi

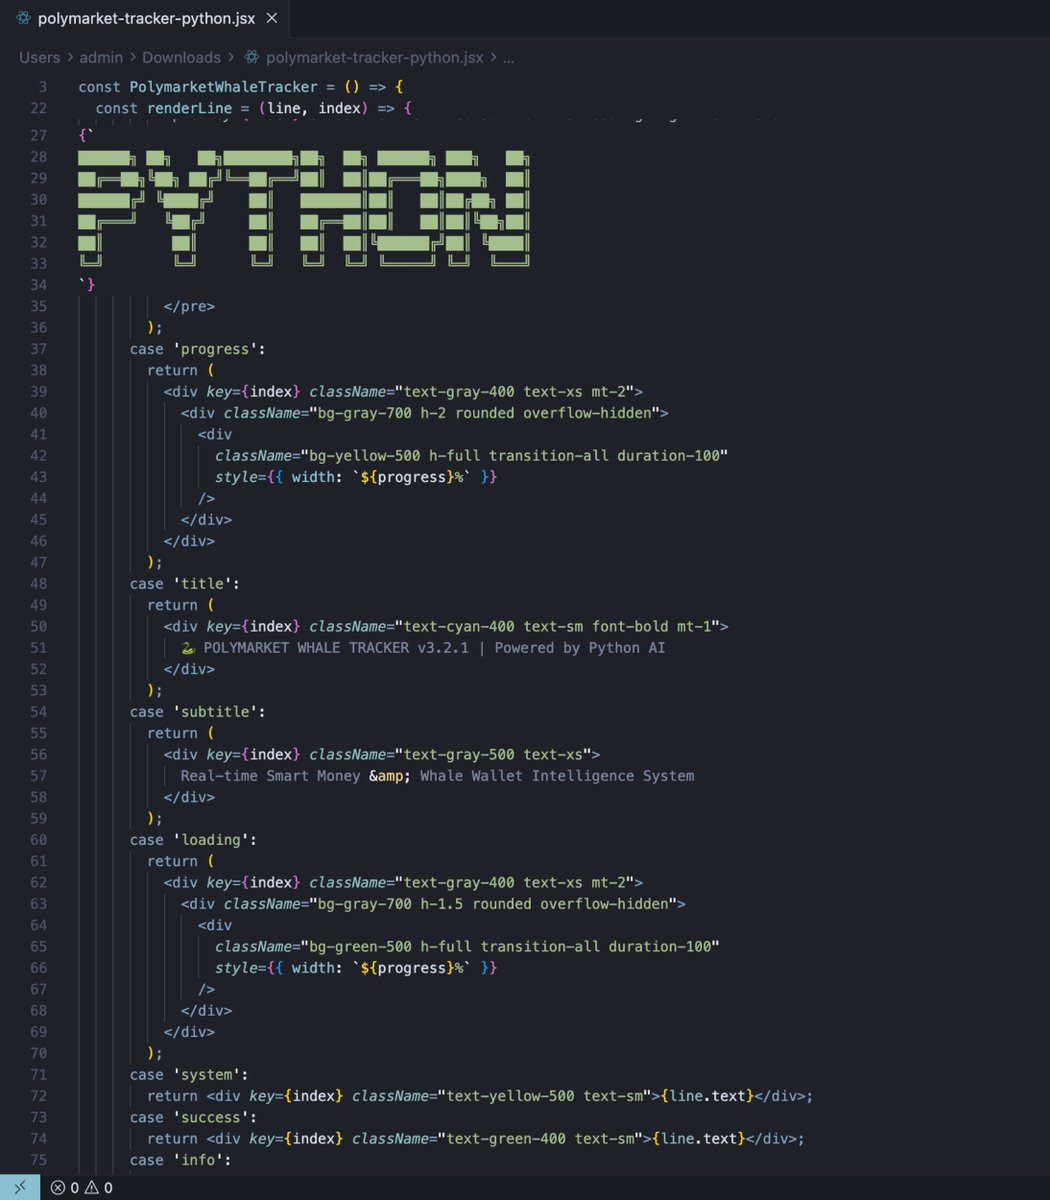
A Polymarket bot developer mass deleted his code last week. I found his Reddit confession before it disappeared.
I'm done. Not because the money stopped. Because I can't sleep anymore.
He built prediction algorithms for 3 years. Made $2.1M. Then wrote 47 paragraphs explaining why he's walking away.
The part that haunts me:
Every time you place a bet, you're not competing with other humans. You're feeding data to systems that learned your patterns months ago. Your hesitation. Your favorite markets. The exact moment you check your phone after news breaks. We have all of it.
He described the architecture:
Layer 1: Sentiment scrapers reading 140,000 tweets per minute. Before a rumor becomes a headline, the position is already built.
Layer 2: Exchange bridges. The bot sees BTC move on Coinbase, calculates Polymarket impact, and executes. Total latency: 80ms. Your finger hasn't touched the screen yet.
Layer 3: Behavioral modeling. They know retail traders panic-sell at -15%. So they push prices to -14.8%. Wait. Then buy your shares at discount when you finally crack.
The worst part? We call regular traders yield. Not competitors. Not opponents. Yield. Like crops we harvest seasonally.
Stop being yield: thetradefox.com/?ref=JUSTBLAZE
He ended with this:
The only retail traders making money are the ones who stopped trading. They just copy the wallets that copy us.
I read it three times.
Then I deleted my indicators. My charts. My strategy.
Because there's no strategy against someone who sees your cards, knows your tells, and moves before you think.
There's only one play left:
Stop being yield. Start being a shadow.
They spend millions on infrastructure. You spend nothing.
They take the risk. You take the same entry.
They do the math. You copy the answer.
In Polymarket, you're either the algorithm or the agriculture.
Choose.
Not financial advice.
English

Why VWAP Renders Every Other Technical Analysis Method Irrelevant
#VWAP $QQQ $SPY $UVXY $SOXL $BTC $MU $SFIX $KBH $ACN $JBL $KMX $SNX $SCS $TSLA $NVDA $AMZN $META $AAPL
In the fast-paced world of trading, where split-second decisions can make or break fortunes, technical analysis tools abound. From simple moving averages (SMAs) to relative strength index (RSI), MACD, Bollinger Bands, and beyond, traders have long relied on a plethora of indicators to gauge market sentiment, identify trends, and pinpoint entry or exit points. But what if one tool could encapsulate the essence of them all, providing a more accurate, volume-driven perspective that exposes the limitations of these traditional methods? Enter the Volume Weighted Average Price (VWAP)—a powerhouse indicator that, when understood and applied correctly, makes every other technical analysis method feel outdated and irrelevant.
Understanding VWAP: The Foundation of Superior Analysis
At its core, VWAP calculates the average price of a security over a given period (typically intraday), but with a critical twist: it's weighted by trading volume. The formula is straightforward—sum the product of price and volume for each transaction, then divide by the total volume. This results in a single line on your chart that represents the "true" average price where the bulk of trading activity has occurred.
Unlike traditional indicators that treat every price point equally, VWAP prioritizes where the real money is moving. High-volume trades pull the average toward prices where institutions and big players are active, filtering out the noise from low-volume fluctuations. This isn't just a minor upgrade; it's a paradigm shift. VWAP doesn't just show you *what* the price did—it reveals *how* the market truly valued the asset, making it indispensable for intraday traders and analysts alike.
The Fatal Flaw in Traditional Indicators: Ignoring Volume
Most technical analysis tools suffer from a glaring oversight: they focus solely on price action, disregarding volume entirely. Take simple moving averages (SMAs) or exponential moving averages (EMAs), for instance. These plot average prices over time but assign equal weight to every period, regardless of whether a price spike occurred on thin volume (easily manipulated) or heavy trading (indicative of genuine market interest). The result? Distorted signals that can lead traders astray during volatile sessions.
VWAP, by contrast, integrates volume directly into its calculation, providing a more accurate reflection of market dynamics. This makes it superior for identifying support and resistance levels, as price tends to gravitate back to VWAP after deviations—much like how it interacts with moving averages, but with the added credibility of volume backing it up. In fact, VWAP often appears smoother than moving averages on intraday charts, reducing false signals and offering clearer trend insights. Why bother with an EMA when VWAP delivers the same trend-following utility but with volume-weighted precision?
Oscillators like RSI or Stochastic, which measure overbought or oversold conditions, fare no better. These tools rely on price momentum alone, often generating whipsaw signals in ranging markets. VWAP sidesteps this by serving as a dynamic benchmark: trading above VWAP signals bullish control (ideal for longs), while below indicates bearish dominance (favoring shorts). It effectively combines momentum analysis with volume validation, rendering standalone oscillators redundant.
Even volume-based cousins like the Volume Weighted Moving Average (VWMA) fall short. While VWMA weights closing prices by volume, it lacks VWAP's inclusion of high, low, and open prices, making it less comprehensive for intraday use. VWAP's holistic approach—factoring in the full price range—provides a fuller market picture, especially for assessing institutional activity.
VWAP in Action: Real-World Superiority
Consider a typical trading scenario: a stock gaps up on news but on low volume. Traditional indicators like MACD might flash a buy signal based on the crossover, luring traders into a trap. VWAP, however, would lag behind if the volume doesn't support the move, warning of potential reversion. Institutions, who drive 70-80% of daily volume, use VWAP as a performance metric to ensure their executions beat the average—further cementing its role as the "real" market pulse.
In backtesting, strategies incorporating VWAP often outperform those using price-only tools. For example, on Heikin Ashi charts with a 14-period setting, VWAP has shown superior profitability compared to standard OHLC-based moving averages. It acts as a magnet for price, pulling it back during overextensions, which mimics Bollinger Bands' mean reversion but with volume's added reliability.
For day traders, VWAP resets daily from the opening bell, ensuring relevance to the current session—unlike multi-day indicators that carry over irrelevant historical data. This intraday focus makes it particularly potent on shorter timeframes, like 5-minute charts, where it outperforms EMAs in signaling bullish or bearish biases.
Indicator
Key Limitation
Why VWAP Supersedes It
SMA/EMA
Ignores volume; equal weighting leads to noise
Volume-weighted for accurate averages; smoother trends
RSI/MACD
Price momentum only; prone to false signals
Combines momentum with volume for reliable overbought/oversold reads
Bollinger Bands
Volatility-based; no volume context
Acts as dynamic support/resistance with volume backing
VWMA
Limited to closing prices
Includes full price range for comprehensive analysis
The Institutional Edge: Why Pros Rely on VWAP
Professional traders and analysts swear by VWAP because it aligns with how markets actually function—volume drives price, not the other way around. It eliminates intraday noise, allowing for precise gauging of fair value. Anchored VWAP variants even extend this power by tying the calculation to specific events, enhancing accuracy over standard indicators.
In essence, VWAP doesn't just complement other tools—it supplants them by offering a unified, volume-informed lens on the market. While beginners might cling to a dashboard of indicators for "confirmation," seasoned traders know that overcomplicating charts leads to analysis paralysis. VWAP streamlines this, providing entry/exit levels, trend direction, and reversal cues in one elegant metric.
Conclusion: Embrace VWAP and Ditch the Rest
The trading landscape is evolving, and clinging to outdated, volume-agnostic tools is a recipe for mediocrity. VWAP's integration of price and volume delivers a more complete, actionable view of the market, making traditional technical analysis methods not just inferior, but irrelevant in modern trading. Whether you're scalping intraday or analyzing institutional flows, VWAP stands alone as the ultimate indicator. Start incorporating it today, and watch how it transforms your strategy from guesswork to precision.

English
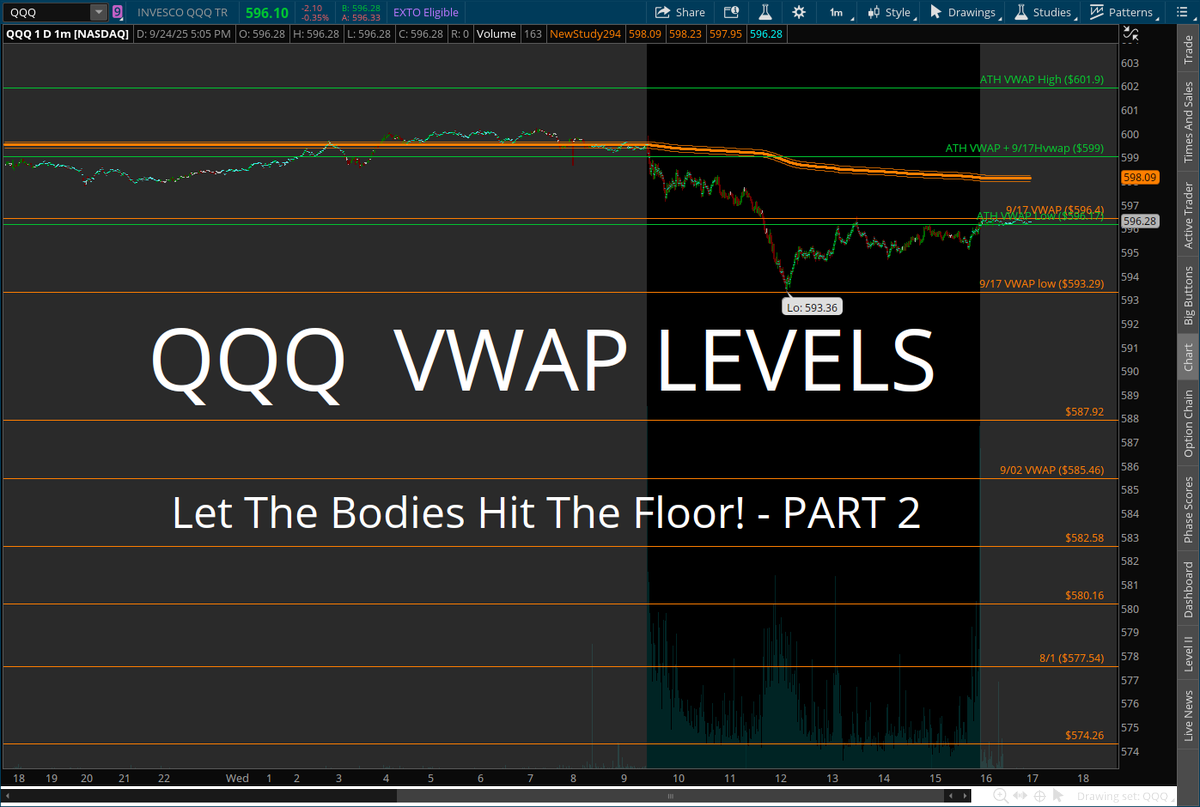
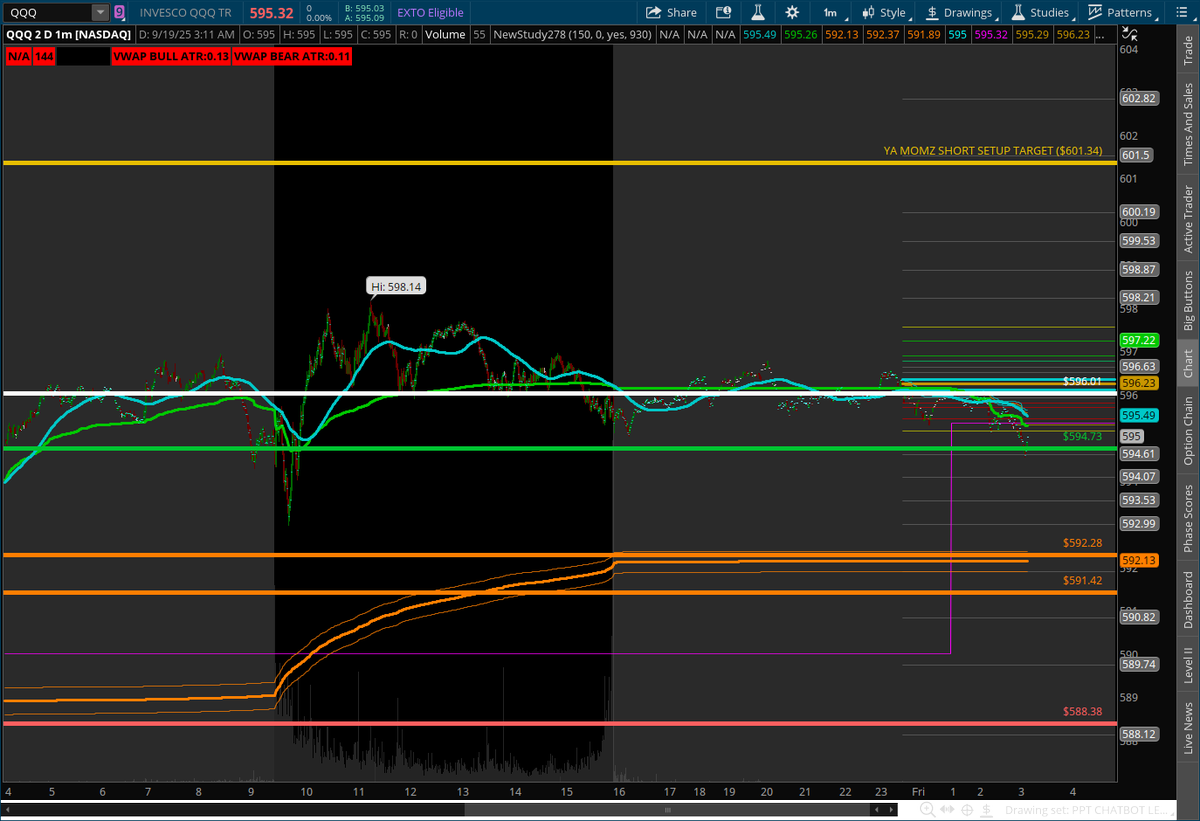
$QQQ #VWAP Market Correction Levels
Let The Bodies Hit The Floor! - Part 2
I told you you could now short the market off of 601.34
If you believe me now, Please Like Share and Follow!
English


SOLIDJELLO retweetledi

Charlie Kirk’s Death Exposed the Biggest Scam in History.
Video by: Chase Hughes (@NCIUniversity)
English


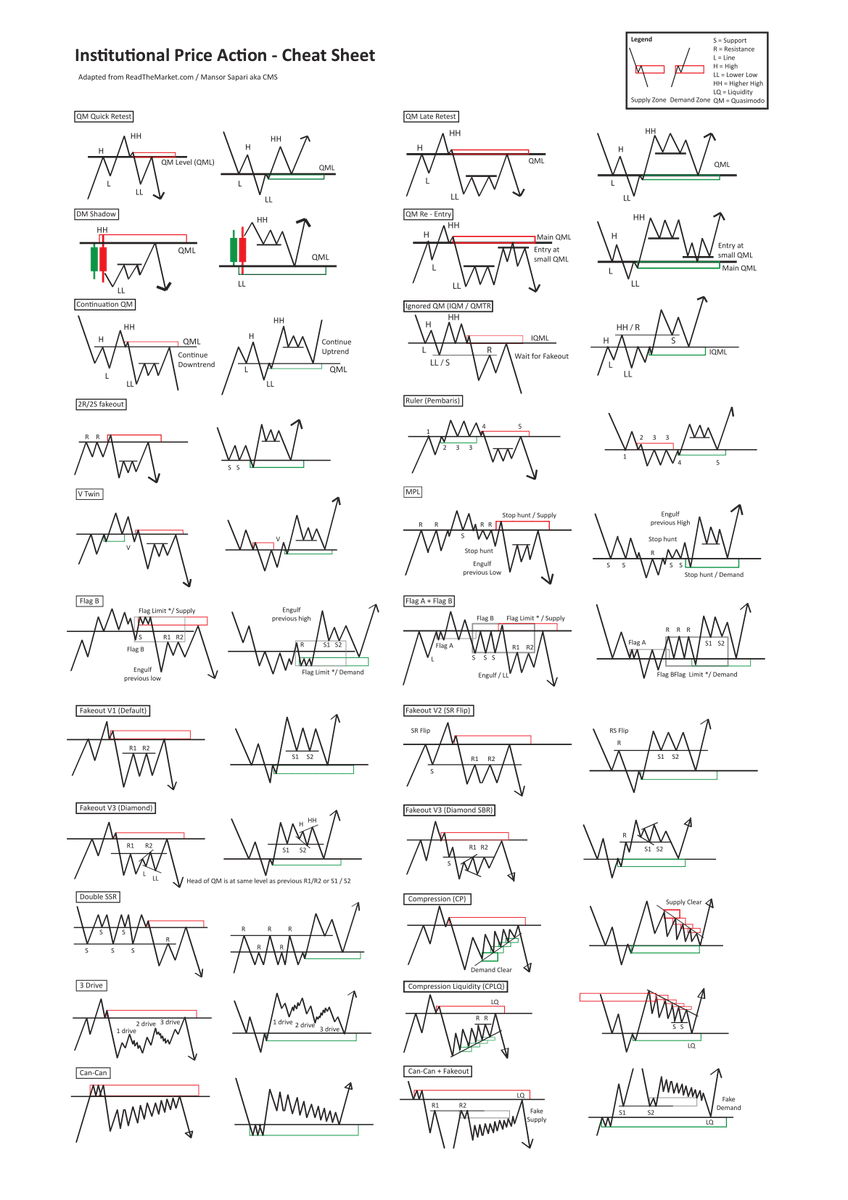
@RebellioMarket #VWAP Thanks for posting this amazing group of chart patterns. If you ever wondered what a FO SHO BRO or a VWAP shuffle looks like here are most if not all of the best possible examples.
English
SOLIDJELLO retweetledi


$QQQ #VWAP BEAR BULL MARKET
QQQ as of today if we break 557.73 then we worry ELSE BULLS ON PARADE

English
$SPY #VWAP BEAR BULL MARKET
SPY as of today if we break 624.30 then we worry ELSE BULLS ON PARADE

English