nixtla

361 posts

nixtla banner
nixtla

nixtla

@nixtlainc

Open-source time series forecasting software.

San Francisco Katılım Şubat 2022
50 Takip Edilen4K Takipçiler
nixtla
nixtla@nixtlainc·
🎉 Announcing Nixtla Enterprise 2.0 🎉 Tl;DR: more models, domain expertise, reasoning capabilities, mcp interactions and optimized compute environments. 
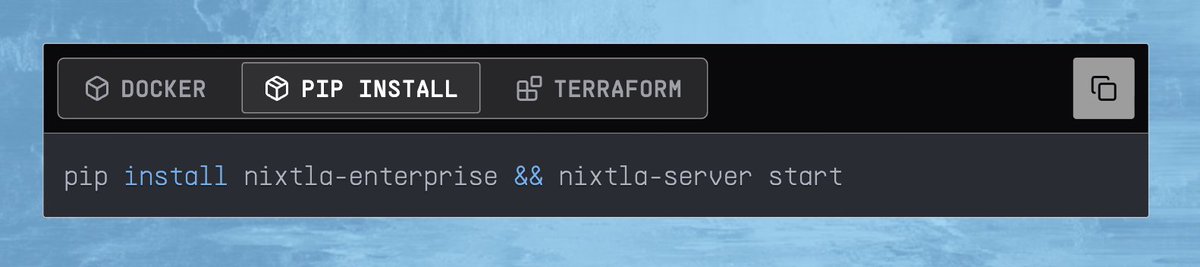
We’re excited to share the next iteration of our enterprise offering. Starting today, companies can sign up for early access. 🚀 These new features are designed to help engineers build, evaluate, and deploy forecasting pipelines more effectively. 🌐 In Nixtla Enterprise 2.0, time series models, LLMs, agents, and humans work together through three core capabilities: 1️⃣ Model Zoo: built with the best models - Optimized implementations of leading foundation models, including Chronos 2 (Amazon Web Services (AWS)), TimesFM 2.5 (Google), and FlowState-r1 (IBM) - Enterprise-ready, battle-tested models from the Nixtlaverse, spanning statistical, ML, and neural approaches 2️⃣ Unified Interface: simple, consistent integration - Add or swap models in your pipelines by changing a single line of code 3️⃣ Time Series Agent: AI-assisted forecasting, redefined - Trained on years of experience deploying state-of-the-art forecasting systems at leading companies - Plan and run end-to-end pipelines in your favorite IDE or AI provider - Powered by Nixtla MCP, which provides domain knowledge and a fully integrated execution environment so agents can reason, generate code, run analysis, refine results, and make recommendations Together, these capabilities unlock a new way to build, compare, and operationalize time series intelligence: 🧠 Guided generation and iterative refinement informed by domain expertise and the latest research. ⚙️ Adaptive support across models and strategies based on performance feedback. 🔄 End-to-end experimentation workflows that reduce manual overhead while keeping humans in control. 🤝 Flexibility to use natural language or Python and plug Nixtla into existing AI workflows. This launch marks a new chapter in Nixtla’s mission: building a time-series ecosystem that blends adaptive tooling with human expertise, helping teams forecast and iterate more efficiently with the latest innovations. 📩 Join the waitlist to be among the first to try this version 👇 Links to demos and blog post #HappyForecasting #timeseries #forecasting #AI #LLM
nixtla tweet media
English
0
3
6
526
nixtla
nixtla@nixtlainc·
Training a custom model for every cryptocurrency you want to forecast is tedious and impossible to scale. There are thousands of tokens. Market conditions shift constantly. By the time your model is trained, the opportunity is gone. TimeGPT changes this with zero-shot forecasting: predict new cryptocurrencies without any training on them. Researchers tested this on 21 cryptocurrencies (BTC, ETH, SOL, and 18 others): • Lowest average error across all 21 assets • MAPE of 2.7% on daily data, 0.7% on hourly data • No training required per cryptocurrency • Outperformed TFT, TiDE, and PatchTST statistically This research by Wang, Braslavski, and Ignatov demonstrates how foundation models are changing financial forecasting. 🚀 Full paper: bit.ly/4orAfGX #TimeGPT #TimeSeries #Cryptocurrency
nixtla tweet media
English
0
1
5
644
nixtla
nixtla@nixtlainc·
The same anomaly detection model can flag 89 or 505 anomalies, depending on one parameter. At 99% confidence, TimeGPT only flags extreme outliers. Drop it to 70%, and you catch subtle shifts that might indicate early warning signs. Neither is "correct." It depends on whether you want fewer false positives or fewer missed detections. This article by Khuyen Tran covers the end-to-end process to: • Set up TimeGPT for anomaly detection • Run detection on real Wikipedia traffic data • Add exogenous features to catch context-dependent patterns • Tune sensitivity from 99% to 70% confidence 🚀 Full article: bit.ly/44L48uS #TimeGPT #AnomalyDetection #TimeSeries #Nixtla
nixtla tweet media
English
3
3
29
2.1K
nixtla
nixtla@nixtlainc·
When you’re forecasting many time series, each one has its own pattern. A single model won’t capture all that complexity, so you shouldn’t rely on one model across the entire dataset. But testing several models per series by hand is tedious and impossible to scale. StatsForecast handles this automatically by training multiple statistical models in parallel and using cross-validation to choose the best one for each time series. This article walks through the full workflow: • How to define several automatic models • How rolling cross-validation works • How StatsForecast picks the best model per series • How to generate final forecasts with uncertainty 🚀 Full article: bit.ly/49FMY5o #timeseries #forecasting #python #statsforecast
nixtla tweet media
English
0
1
5
606
nixtla
nixtla@nixtlainc·
Get interpretable neural forecasts with NHITS and NBEATSx decomposition 📈 Understanding forecast components (trend, seasonality, contributions) enables data scientists to explain model decisions to stakeholders and debug unexpected predictions. Traditional statistical methods like STL decomposition assume additive structure (trend + seasonal + residual) and can't capture complex feature interactions that neural networks learn automatically. NeuralForecast's NHITS and NBEATSx automatically learn flexible decomposition patterns, capturing complex feature interactions without fixed structural assumptions. The decomposition breaks forecasts into interpretable components: • Stack 1: Captures long-term trend patterns • Stack 2: Captures seasonal/cyclical patterns • Visual component attribution showing each stack's contribution 🚀 Guide on interpretable decompositions: bit.ly/4oWvyGk #TimeSeries #NeuralForecast #Decomposition
nixtla tweet media
English
2
0
5
391
nixtla
nixtla@nixtlainc·
How do you tell if recent behavior is normal variation or a fundamental business shift? MLForecast's Combine class lets you compose any two transformations with operators to create features like: • Baseline deviation (subtraction): Track drift from historical norms • Momentum ratios (division): Detect acceleration and deceleration • Volatility measures (std/mean): Identify unstable periods • Cumulative signals (addition): Aggregate multiple time windows In the example below, we create a baseline deviation feature by subtracting the expanding average from the 7-day rolling mean. The deviation signal shows you: ⬆️ Positive deviation: Recent values consistently higher than historical average ⬇️ Negative deviation: Recent values consistently lower than historical average ➡️ Zero deviation: Operating at historical norm 🚀 Full tutorial on lag transformation: bit.ly/4o4g5me #MLForecast #TimeSeries #FeatureEngineering #DataScience
nixtla tweet media
English
0
0
7
396
nixtla
nixtla@nixtlainc·
Automate date feature engineering with TimeGPT 🚀 For time series with seasonal patterns like holidays, weekday effects, or monthly trends, date-based features can significantly improve forecast accuracy. However, manually creating these features is time-consuming and requires writing code to extract and encode date components. TimeGPT's date_features parameter automatically generates temporal features from timestamps and one-hot encodes them. The plot below shows the forecast with date features (blue) tracks actual values (white) more accurately than without date features (pink). 🚀 Full tutorial: bit.ly/4p6J0a6 #FeatureEngineering #TimeSeriesAnalysis #DataScience #TimeGPT
nixtla tweet media
English
0
0
6
433
nixtla
nixtla@nixtlainc·
Quantify forecast uncertainty with MLForecast conformal prediction intervals 📊 Point forecasts provide no measure of prediction uncertainty. Without confidence intervals, analysts cannot assess reliability or make probability-based decisions. MLForecast provides conformal prediction intervals that quantify forecast uncertainty with statistical guarantees. How to generate conformal prediction intervals: • Pass PredictionIntervals(n_windows, h) to fit() for calibration • Set level parameter in predict() to specify confidence levels 🚀 Full guide: bit.ly/4oSijGp #DataScience #MachineLearning #TimeSeries #Python
nixtla tweet media
English
0
4
15
1.4K
nixtla
nixtla@nixtlainc·
Detect production anomalies in minutes with TimeGPT's rolling forecast 🚨 Traditional anomaly detection requires retraining on entire datasets, making real-time monitoring impossible. This leads to delayed responses when critical system failures or data quality issues occur in production. TimeGPT solves this with online anomaly detection that analyzes recent data windows in real-time using rolling forecasts. How to use: • Call detect_anomalies_online() with your data • Set detection_size (how many recent data points to use) • Configure h (forecast steps) and level (confidence) 🚀 Full guide: bit.ly/4oGsxJB #TimeSeries #AnomalyDetection #TimeGPT #AI
nixtla tweet media
English
0
0
2
341
nixtla
nixtla@nixtlainc·
Automate NeuralForecast hyperparameter tuning with Ray Tune ⚡️ Manual hyperparameter tuning for neural forecasting models can be time-consuming and requires deep expertise in model architectures. NeuralForecast's Auto models (AutoNHITS, AutoTFT, AutoLSTM) automatically search hyperparameter spaces using Ray Tune or Optuna. Key capabilities: • Automated hyperparameter optimization • Multiple search backends (Ray Tune, Optuna) • Built-in neural architectures (NHITS, TFT, LSTM) • Parallel search with Ray Tune 🚀 Full guide: bit.ly/4pONALq #DataScience #AutoML #TimeSeries #Forecasting
nixtla tweet media
English
0
1
4
397
nixtla
nixtla@nixtlainc·
Spotted at Nike World Headquarters 👟 where Nixtla appeared on the big screen during a forecasting session. Moments like this remind us how far the work on better forecasting and modeling continues to travel. #Nixtla #Forecasting #DataScience #Nike
nixtla tweet media
English
0
0
5
342
nixtla
nixtla@nixtlainc·
Add event context to your forecasts with TimeGPT categorical variables ⚡ Categorical variables capture discrete event types (promotions, holidays, seasons) that drive demand patterns in time series data. Without them, models treat all time periods uniformly, missing the signal from events that influence demand patterns. TimeGPT handles categorical variables with a single parameter: pass your encoded events as X_df and the model incorporates them automatically. 🚀 Full guide: bit.ly/4nYdtam #TimeSeries #Forecasting #AI #TimeGPT
nixtla tweet media
English
0
1
4
475
nixtla
nixtla@nixtlainc·
Validate time series models the right way with cross-validation ⚡ Cross-validation tests your model on multiple time windows to ensure it generalizes well to future data. However, setting up temporal splits and running validation loops is slow and complex. StatsForecast makes this simple with one method call. Just specify: • Forecast horizon (h) - how far ahead to predict • Step size - interval between validation windows • Number of windows (n_windows) - how many times to validate StatsForecast handles the rest with distributed operations across your CPU cores, making validation significantly faster. 🚀 Full guide: bit.ly/3LkqAnI #TimeSeries #Forecasting #DataScience #MachineLearning
English
2
1
8
495
nixtla
nixtla@nixtlainc·
Improve forecast accuracy with TimeGPT's exogenous variables 📊 Including external variables like weather, marketing spend, or holidays helps capture the real drivers behind your forecasts, reducing prediction errors. This approach lets you leverage domain knowledge and account for planned events, moving beyond pure historical pattern recognition. TimeGPT incorporates numeric exogenous variables alongside historical data to capture external variables. The implementation is straightforward: • Include exogenous variables in your historical data (df) • Create future exogenous values with the same columns • Pass future values via X_df parameter • TimeGPT learns relationships between external factors and your target variable The plot below shows the difference: basic forecasts follow smooth trends, while exogenous-enhanced forecasts capture day-of-week patterns and external factor volatility. 🚀 Full guide: bit.ly/48ALeKc #TimeSeries #Forecasting #DataScience #TimeGPT
nixtla tweet media
English
0
2
14
886
nixtla
nixtla@nixtlainc·
🚀 Introducing the TimeGPT-2 family: next-generation time-series foundation models Today, we’re announcing the private preview of TimeGPT-2 Mini, TimeGPT-2, and TimeGPT-2 Pro, built for reliable, enterprise-grade time series forecasting. The TimeGPT-2 family is optimized for enterprise needs, prioritizing accuracy and stability with a privacy-first approach and full support for self-hosted and on-premises deployments. After extensive testing, the new family of models shows up to 60% accuracy improvement for enterprise use cases compared to the previous generation. We also ran exhaustive benchmarking on public baselines: consistently ranks in the top 3 on benchmarks such as GiftEval, FEV, and VN1 (reproducible results available upon request). TimeGPT-2 marks a new milestone in time-series modeling and is already delivering real value for Fortune 1000 companies in retail, logistics, finance, energy, and IoT. This is the first of three releases rolling out in the coming weeks. Stay tuned. 📩 We’ve opened pilot programs for select organizations. Sign up here for early access to TimeGPT-2: bit.ly/3KWN12d #TimeGPT2 #timeseries #forecasting #AI #MLOps #analytics #supplychain #energy #finance #IoT
English
0
4
17
1.7K
nixtla
nixtla@nixtlainc·
Handle noisy data and outliers with Huber loss 📈 Standard loss functions are sensitive to outliers, causing models to overfit to anomalies and produce unstable forecasts. Huber loss in NeuralForecast provides robust training that's less sensitive to outliers while maintaining accuracy. In the plot below, normal distribution loss overfits to every anomaly in the forecast period, while Huber Loss maintains consistent predictions despite noisy training data. 🚀 Full guide: bit.ly/3Kvjht2 #DataScience #TimeSeries #MachineLearning #Python
nixtla tweet media
English
0
0
12
566
nixtla
nixtla@nixtlainc·
Build an adaptive monitoring system with rolling forecasts 🎯 Production metrics drift with growth and seasonality, which makes static alerts unreliable. For example, if you set an alert at 5k when your baseline later moves to 10k, you will be flooded with useless alerts, and you will start ignoring the system. In our latest article, you will learn how to build an adaptive monitoring system with rolling forecasts using TimeGPT-1. The process is simple: 1. Train the model on all daily spend up to today 2. Forecast tomorrow with a 99 percent confidence band 3. When tomorrow arrives, alert only if the actual falls outside the band by a meaningful amount 4. Add the new data point to the training set and repeat 🚀 Full article (Anomaly Detection for Cloud Cost Monitoring): bit.ly/4mZ3Tmr #DataScience #MachineLearning #TimeSeries #AnomalyDetection
nixtla tweet media
English
0
0
6
415
nixtla
nixtla@nixtlainc·
The community asked, and Nixtla responded! ✅ We’re excited to announce a time series webinar to help you get started in the VN2 inventory planning competition. In this live webinar, Nixtla's experts will share concrete tips and code examples on how to easily build forecasting solutions. Participants are welcome to interact and ask questions at the end. We have also created a Slack channel where you can suggest topics you’d like covered and/or ask any questions. 🚀 Register here: bit.ly/3IDbVDp ☕️ Join the conversation on Slack: bit.ly/3WilwT4
nixtla tweet media
English
0
1
5
407
nixtla
nixtla@nixtlainc·
Time series decomposition breaks down forecasts into constituent components like trend and seasonality. This reveals underlying patterns and improves understanding. NHITS (Neural Hierarchical Interpolation for Time Series) advances this with hierarchical multi-scale decomposition, using specialized stacks for different frequency ranges from daily fluctuations to long-term trends. Unlike simple two-component decompositions, NHITS shows exactly which time scale drives each prediction. This helps you trust model decisions and debug poor forecasts while maintaining neural network accuracy. In the plot below: • The top panel shows the overall forecast • The middle panel displays the low-frequency component • The bottom panel shows the high-frequency component • The two frequency components add together to create the total forecast 🚀 Full tutorial on decomposition: bit.ly/3Krqlad #DataScience #TimeSeries #MachineLearning #Python
nixtla tweet media
English
0
0
3
355
nixtla
nixtla@nixtlainc·
Handle forecast uncertainty with StatsForecast prediction intervals! Point forecasts provide only a single predicted value without any uncertainty information. You can't assess how confident the model is in its prediction, making risk assessment impossible. StatsForecast generates prediction intervals at multiple confidence levels, enabling statistical confidence assessment for any risk tolerance level. Key prediction interval features: 🔹 Support for multiple confidence levels 🔹 Built-in plotting with automatic interval visualization 🔹 Works with 30+ forecasting models (AutoETS, AutoARIMA, Theta, etc.) 🔹 Memory-efficient processing for large datasets 🚀 Full tutorial: bit.ly/42xOylx #StatsForecast #Forecasting #DataScience #TimeSeries
nixtla tweet media
English
1
0
7
436